
@andeya/create-grafana-plugin-darwin-arm64
v0.2.6
Published
Prebuilt create-grafana-plugin binary for macOS (Apple Silicon)

Readme
create-grafana-plugin
One command. A production-ready Grafana plugin project.
Scaffold panel, data source, or app plugins with the fastest modern frontend toolchain — Rspack for bundling, Bun for runtime, Biome for formatting and linting — and optionally add Rust WASM for native-speed computation, a full Docker observability stack (Grafana + Prometheus + Tempo + Loki), and a ready-to-run mock telemetry generator that produces correlated traces, logs, and metrics out of the box.
English · 中文
Dashboard Preview
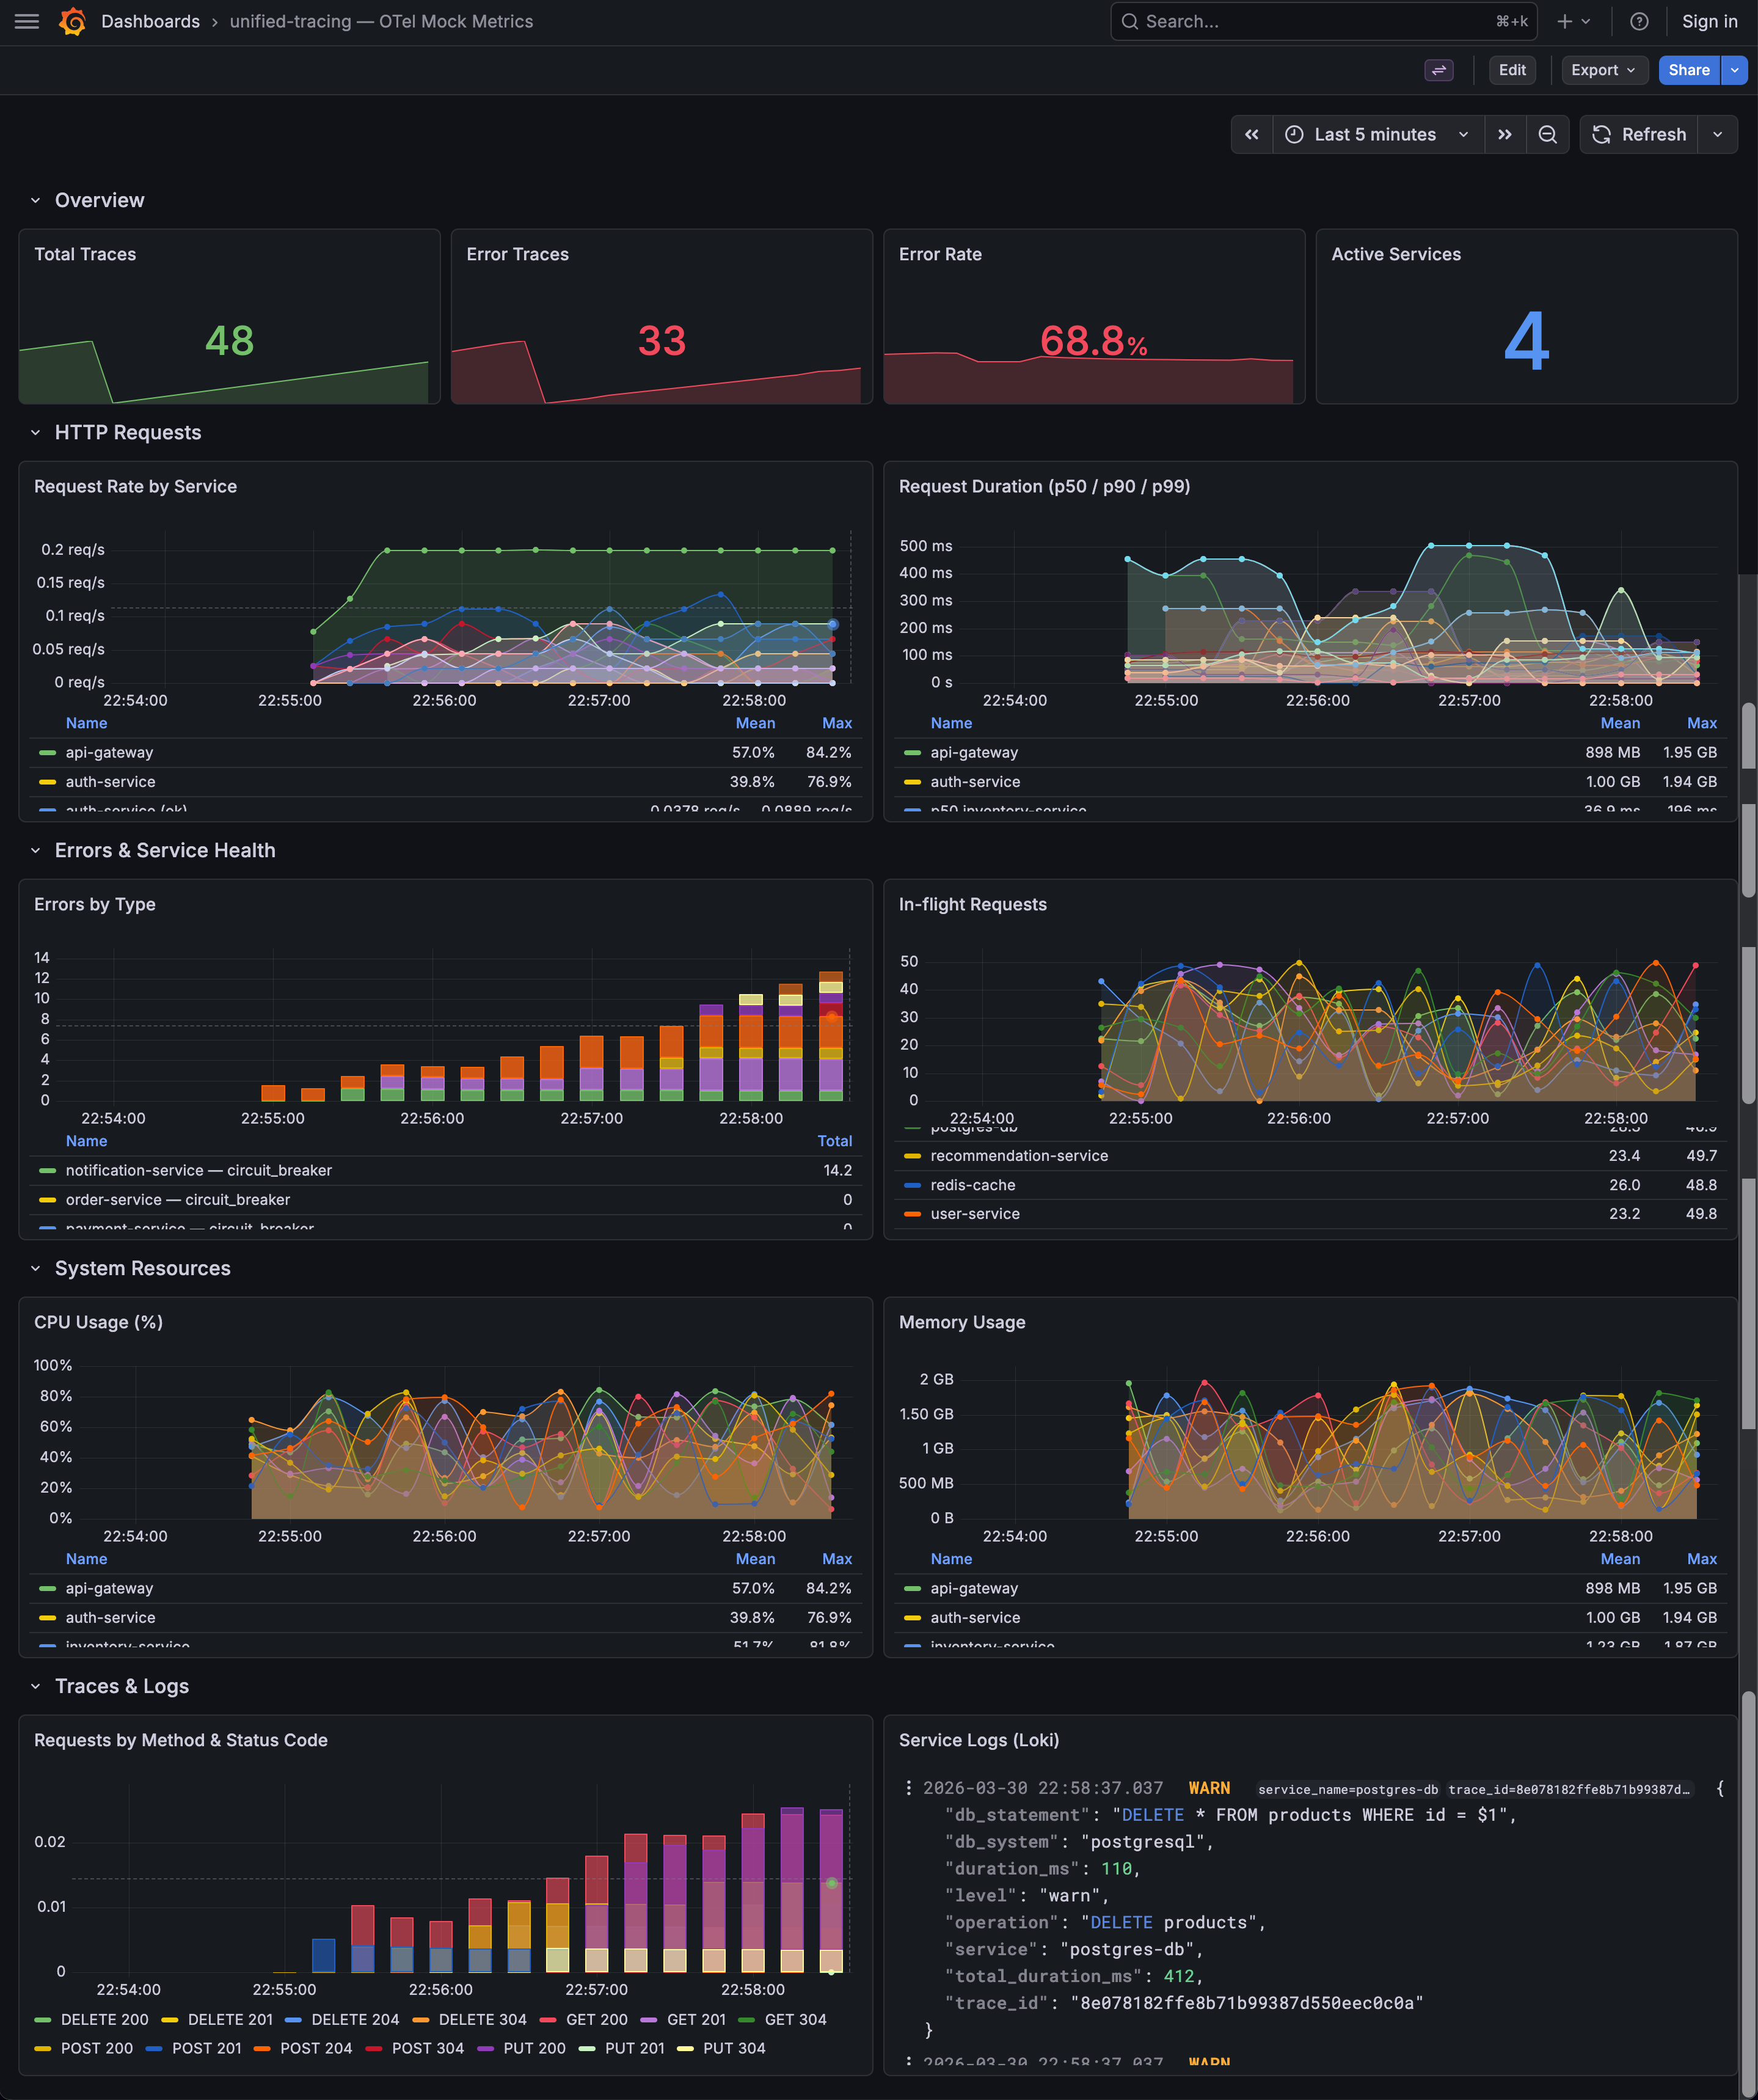
Pre-configured Grafana dashboard with request rates, latency percentiles, error breakdown, system resource gauges, and Loki logs — auto-provisioned when you use
--mock.
Why create-grafana-plugin?
| Pain point | How this tool solves it |
| ----------------------------------------------------------------------- | -------------------------------------------------------------------------------------------------- |
| Grafana's plugin SDK has no official scaffolding tool for custom stacks | Generates a complete, opinionated project in seconds |
| Setting up Rspack + AMD output for Grafana is non-trivial | Pre-configured rspack.config.js with JSDoc types, SWC loader, and AMD externals |
| Integrating Rust WASM into a Grafana plugin requires manual plumbing | --wasm adds a wasm-pack crate, TypeScript bridge, and build scripts automatically |
| Local development needs Grafana + backends running together | --docker provisions Grafana, Prometheus, Tempo, and Loki via Compose |
| No realistic test data for observability dashboards | --mock ships a Rust-based mock generator with correlated multi-service traces, logs, and metrics |
| Keeping generated boilerplate up-to-date across teams | update subcommand refreshes managed files while preserving custom code |
| Running multiple plugin projects on one machine causes port conflicts | --port-offset shifts all Docker host ports by a fixed delta |
Highlights
- Rust-powered CLI — single static binary, instant startup, cross-platform (macOS, Linux, Windows).
- Fastest-in-class toolchain — Rspack (Rust bundler), Bun (runtime + test runner), Biome (Rust linter/formatter). No webpack, no Jest, no Prettier.
- Three plugin types — Panel, Data Source, App. Each gets type-specific components, types, and module entry points.
- Optional Rust → WASM — wasm-pack crate, TypeScript bridge (
wasm-bridge.ts), Cargo workspace — ready for compute-heavy logic in the browser. - Full observability dev stack — Docker Compose with Grafana, Prometheus, Tempo, Loki, auto-provisioned datasources, and network isolation per project.
- Production-grade mock data —
otel-mocksimulates 10 microservices with fixed realistic call chains, generating distributed traces (OTLP → Tempo), correlated JSON logs (→ Loki), and Prometheus-scrapable metrics (counters, gauges, histograms) with a random error rate (10–90%). A pre-configured Grafana dashboard is auto-provisioned with panels for request rates, latency percentiles, error breakdown, system resource gauges, and Loki logs. - Port isolation —
--port-offset Nshifts every Docker host port by N (e.g.,--port-offset 100→ Grafana on 3100, Prometheus on 9190). - Config-driven — Interactive prompts, CLI flags, or a
.grafana-plugin.tomlfile. CI-friendly. - Smart updates —
create-grafana-plugin updatediffs managed files against the latest template;--dry-runpreviews changes. - Auto-formatted output — Biome and
cargo fmtrun automatically after scaffold, so generated code is lint-clean from the start. - CI included — GitHub Actions workflow for lint, test, and build ships with every generated project.
Quick start
npx create-grafana-plugin@latestFollow the prompts — or go fully non-interactive:
npx create-grafana-plugin \
  --name my-dashboard \
  --type panel \
  --org acme \
  --author "Jane Doe" \
  --wasm \
  --docker \
  --mock
Then:
cd my-dashboard
bun run setup        # install deps + build WASM (if enabled)
docker compose up -d # start Grafana + backends (if --docker)
bun run dev          # Rspack watch mode
bun run package      # build + create dist .tar.gz archive
bun run dev:reload   # build + force-recreate Grafana container
Open Grafana at http://localhost:3000 — datasources, plugins, and mock data are pre-configured.
Installation
npm (recommended)
npx create-grafana-plugin@latestZero prerequisites beyond Node/Bun. The npm package detects your OS and pulls the right native binary.
Cargo (Rust)
cargo install create-grafana-pluginFrom source
git clone https://github.com/andeya/create-grafana-plugin.git
cd create-grafana-plugin
cargo install --path cli
Usage
Interactive mode
npx create-grafana-pluginPrompts: plugin name, description, author, organization, type, WASM, Docker, mock data.
Non-interactive mode
Provide --name, --type, --author, and --org to skip all prompts:
npx create-grafana-plugin \
  --name my-plugin \
  --type datasource \
  --org myorg \
  --author "Your Name" \
  --description "Real-time metrics datasource" \
  --docker \
  --mock \
  --port-offset 200
Configuration file
npx create-grafana-plugin --config .grafana-plugin.tomlname = "my-org-panel"
description = "My Grafana plugin"
author = "Your Name"
org = "myorg"
type = "panel"
wasm = true
docker = true
mock = true
port_offset = 100CLI flags override TOML values. The generated project does not depend on this file at runtime.
Update an existing project
cd my-plugin
npx create-grafana-plugin update
The updater discovers plugin type, org, WASM/Docker/mock layout, and port offset from your project files. Only managed files (those marked with @managed) are overwritten; your custom code is untouched.
npx create-grafana-plugin update --dry-run # preview diffs without writingConfiguration reference (.grafana-plugin.toml)
| Field | Type | Description |
| ------------- | ------- | ----------------------------------------------- |
| name | string | Plugin name (normalized to kebab-case) |
| description | string | Human-readable description |
| author | string | Author display name |
| org | string | Grafana org segment (plugin id = org-name) |
| type | string | panel, datasource, or app |
| wasm | bool | Include Rust WASM workspace and bridge |
| docker | bool | Include Docker Compose + provisioning |
| mock | bool | Include mock data generator (requires docker) |
| port_offset | integer | Global host port offset for Docker services |
Generated project structure
A panel plugin with WASM + Docker + mock data:
my-plugin/
├── .github/workflows/ci.yml       # lint + test + build
├── .grafana-plugin-version         # tracks scaffold tool version
├── biome.json                      # Biome config (formatter + linter)
├── bunfig.toml                     # Bun config
├── Cargo.toml                      # Rust workspace (when --wasm)
├── docker-compose.yml              # Grafana + Prometheus + Tempo + Loki
├── provisioning/                   # auto-provisioned datasources, dashboards & config
├── otel-mock/                      # Rust mock telemetry generator
│   └── src/
│       ├── main.rs                 # OTLP traces + Loki logs + Prometheus metrics
│       ├── graph.rs                # synthetic multi-service call graph (10 services)
│       ├── loki_push.rs            # Loki push API client
│       └── openmetrics_exemplars.rs # histogram with trace_id exemplars
├── src/
│   ├── components/MainPanel.tsx    # plugin UI
│   ├── module.ts                   # Grafana entry point
│   ├── types/index.ts              # shared types
│   └── services/wasm-bridge.ts     # WASM bridge (when --wasm)
├── my_plugin/src/lib.rs            # Rust WASM crate (when --wasm)
├── scripts/
│   ├── bump-version.ts             # semver bump utility
│   └── clean-plugin-dist.ts        # dist cleaner
├── tests/                          # Bun test suite
├── plugin.json                     # Grafana plugin manifest
├── package.json                    # Bun scripts
├── tsconfig.json
├── rspack.config.js                # Rspack (AMD output for Grafana)
├── README.md
└── AGENTS.md                       # AI coding standards
Plugin type determines src/ contents: panel gets MainPanel.tsx, datasource gets QueryEditor.tsx + ConfigEditor.tsx + DataSource.ts, app gets AppRootPage.tsx + AppConfig.tsx.
CLI reference
Scaffold (default command)
| Option | Description |
| ---------------------- | ------------------------------------------------- |
| --name <NAME> | Plugin name (kebab-case) |
| --description <TEXT> | Plugin description |
| --author <NAME> | Author name |
| --org <ORG> | Organization segment for plugin id |
| --type <TYPE> | panel, datasource, or app |
| --wasm | Include Rust WASM crate and bridge |
| --docker | Include Docker-based dev environment |
| --mock | Include mock data generator (requires --docker) |
| --port-offset <N> | Shift all Docker host ports by N |
| --config <FILE> | Load settings from a TOML file |
update subcommand
| Option | Description |
| ----------- | ---------------------------------------- |
| --dry-run | Show diffs and new files without writing |
Built-in: -h / --help, -V / --version.
Template customization
Templates live under templates/ using the Tera engine (Jinja2-like syntax). Template stacks: base, panel, datasource, app, wasm, docker, mock.
- Fork or vendor this repo to customize defaults, dependencies, or layout.
- Context variables:
plugin_name,org,plugin_id,crate_name,has_wasm,has_docker,has_mock,port_offset, etc. SeeTemplateContext. - Managed markers: Generated files contain
@managed by create-grafana-plugin — do not edit. Theupdatecommand uses these markers to safely merge template changes.
Development (this repository)
bun run format       # Biome format + cargo fmt
bun run lint         # Biome check + clippy
bun run lint:fix     # auto-fix lint issues
bun run test         # cargo test --workspace
bun run verify       # lint + test
Versioning
Rust crate and npm packages share a single semver. Source of truth: [workspace.package] version in Cargo.toml.
bun run bump:patch   # 0.1.0 → 0.1.1
bun run bump:minor   # 0.1.0 → 0.2.0
bun run bump:major   # 0.1.0 → 1.0.0
To release: commit, push tag vX.Y.Z, and the GitHub Actions workflow handles crates.io + npm publishing.
Contributing
Contributions welcome.
- Open an issue first for larger changes.
- Use English for commit messages and code comments.
- Run
bun run verifybefore submitting a PR. - Match existing template and CLI style; update tests for behavior changes.