
@artmizu/nuxt-prometheus
v3.0.3
Published
Allows you to better understand what's going on with your application and how to optimize performance and other things in production

Readme

📊 Prometheus integration for Nuxt 3
Allows you to better understand what's going on with your application and how to optimize performance and other things in production. Nuxt 2 users can use this version.
Features
- Default NodeJS metrics exported through the prometheus middleware
- Custom metrics about pages render time and external request consumption time
- Health check middleware
Default routes that you can customise via the module options
/metrics- prometheus metrics/health- health check
Installation
Install package via a package manager:
# using nuxi, it automatically appends the module in your nuxt.config
npx nuxi@latest module add prometheus

# using npm
npm install @artmizu/nuxt-prometheus

# using yarn
yarn add @artmizu/nuxt-prometheus

# using pnpm
pnpm add @artmizu/nuxt-prometheus
Add it to a modules section of your nuxt config:
export default {
  modules: ['@artmizu/nuxt-prometheus']
}
Grafana sample setup
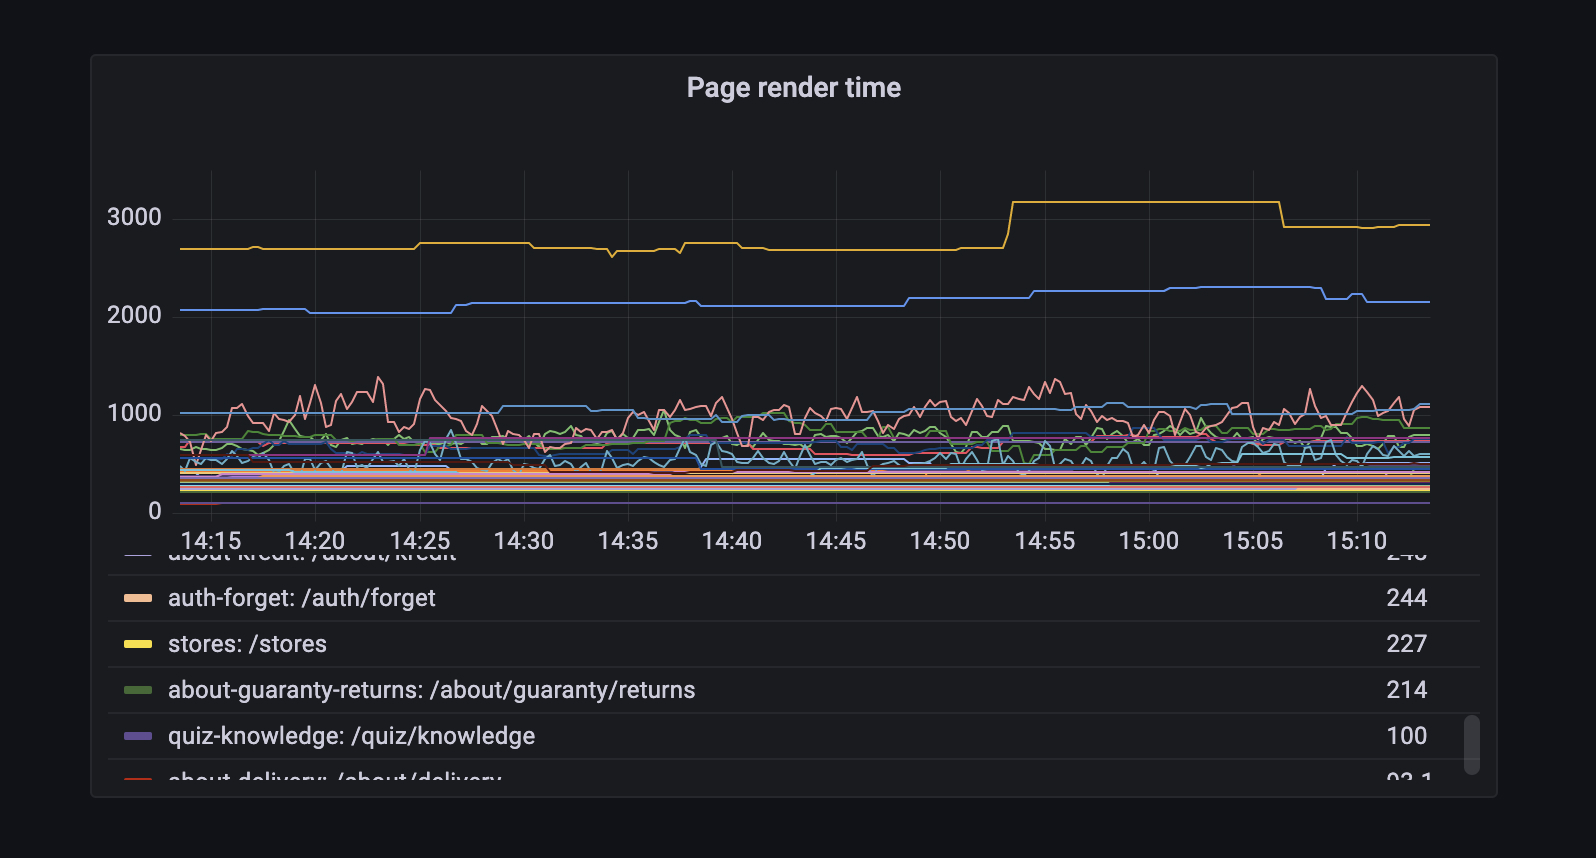
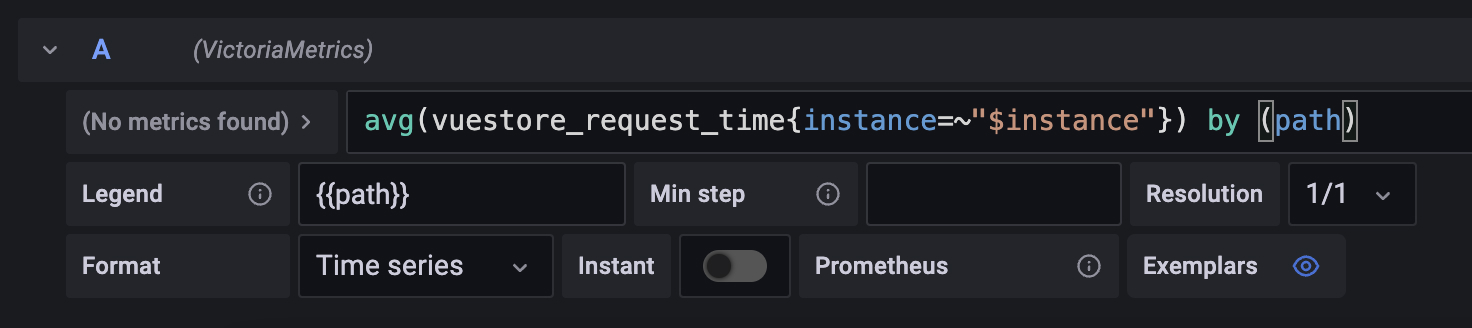
Once the metrics have been collected by Prometheus, you will want to review them. I use Grafana for this purpose, and my metrics setup looks something like this:
Collected Metrics
In addition to the default Node.js metrics provided by prom-client, this module collects the following custom metrics:
| Metric | Type | Labels | Description |
|--------|------|--------|-------------|
| page_render_time | Gauge | path | Time spent rendering a page (total minus external request time), in ms |
| page_request_time | Gauge | path | Time spent on external API requests during page processing, in ms |
| page_total_time | Gauge | path | Total time to complete a request, in ms |
| page_render_time_summary | Summary | path | Distribution of page render times, in ms |
| page_request_time_summary | Summary | path | Distribution of external API request times, in ms |
| page_total_time_summary | Summary | path | Distribution of total request times, in ms |
All custom metric names can be prefixed using the prefix option (e.g., myapp_page_render_time).
Options
You can pass it through module options and the nuxt config property prometheus.
enabled
- Type:
boolean - Default:
true - Description: Enables or disables Prometheus integration at runtime. When set to
false, no metrics are collected and no hooks are registered. This allows you to build the app with the module but disable it in certain environments.
verbose
- Type:
boolean - Default:
true - Description: Additional logs in the dev mode, about page rendering time and time of external API requests
healthCheck
- Type:
boolean - Default:
true - Description: To turn on and off the healthcheck route
healthCheckPath
- Type:
string - Default:
/health - Description: Healthcheck url path
prometheusPath
- Type:
string - Default:
/metrics - Description: Prometheus exporter url path
prefix
- Type:
string - Default: no prefix
- Description: An optional prefix for metric names
metricsEndpoint
- Type:
boolean - Default:
true - Description: Whether to expose the
/metricsendpoint. When set tofalse, metrics are still collected internally but the endpoint is not registered. This allows you to access metrics programmatically via prom-client'sregisterobject and expose them on a separate internal port.
Runtime Environment Variables
All options can be configured at runtime via environment variables following Nuxt's convention NUXT_PUBLIC_PROMETHEUS_<OPTION_NAME>:
| Environment Variable | Option | Example |
|---------------------|--------|---------|
| NUXT_PUBLIC_PROMETHEUS_ENABLED | enabled | false |
| NUXT_PUBLIC_PROMETHEUS_VERBOSE | verbose | false |
| NUXT_PUBLIC_PROMETHEUS_HEALTH_CHECK | healthCheck | false |
| NUXT_PUBLIC_PROMETHEUS_METRICS_ENDPOINT | metricsEndpoint | false |
| NUXT_PUBLIC_PROMETHEUS_PREFIX | prefix | myapp_ |
| NUXT_PUBLIC_PROMETHEUS_DISABLE_REQUEST_INTERCEPTOR | disableRequestInterceptor | true |
Example usage:
# Disable metrics endpoint in production while keeping collection active
NUXT_PUBLIC_PROMETHEUS_METRICS_ENDPOINT=false node .output/server/index.mjs

# Use custom prefix
NUXT_PUBLIC_PROMETHEUS_PREFIX=myapp_ node .output/server/index.mjs
Development
# Install dependencies
pnpm install

# Prepare the module (build types and module)
pnpm run dev:prepare

# Start development server with playground
pnpm run dev

# Run tests
pnpm test
Important: After making changes to the module source code, you must run pnpm run dev:prepare to rebuild the module before testing.