
@backtest-kit/ui
v17.0.0
Published
Full-stack UI framework for visualizing cryptocurrency trading signals, backtests, and real-time market data. React dashboard with candlestick charts, signal tracking, and risk analysis.
Maintainers
 tripolskypetr
Readme
📊 @backtest-kit/ui
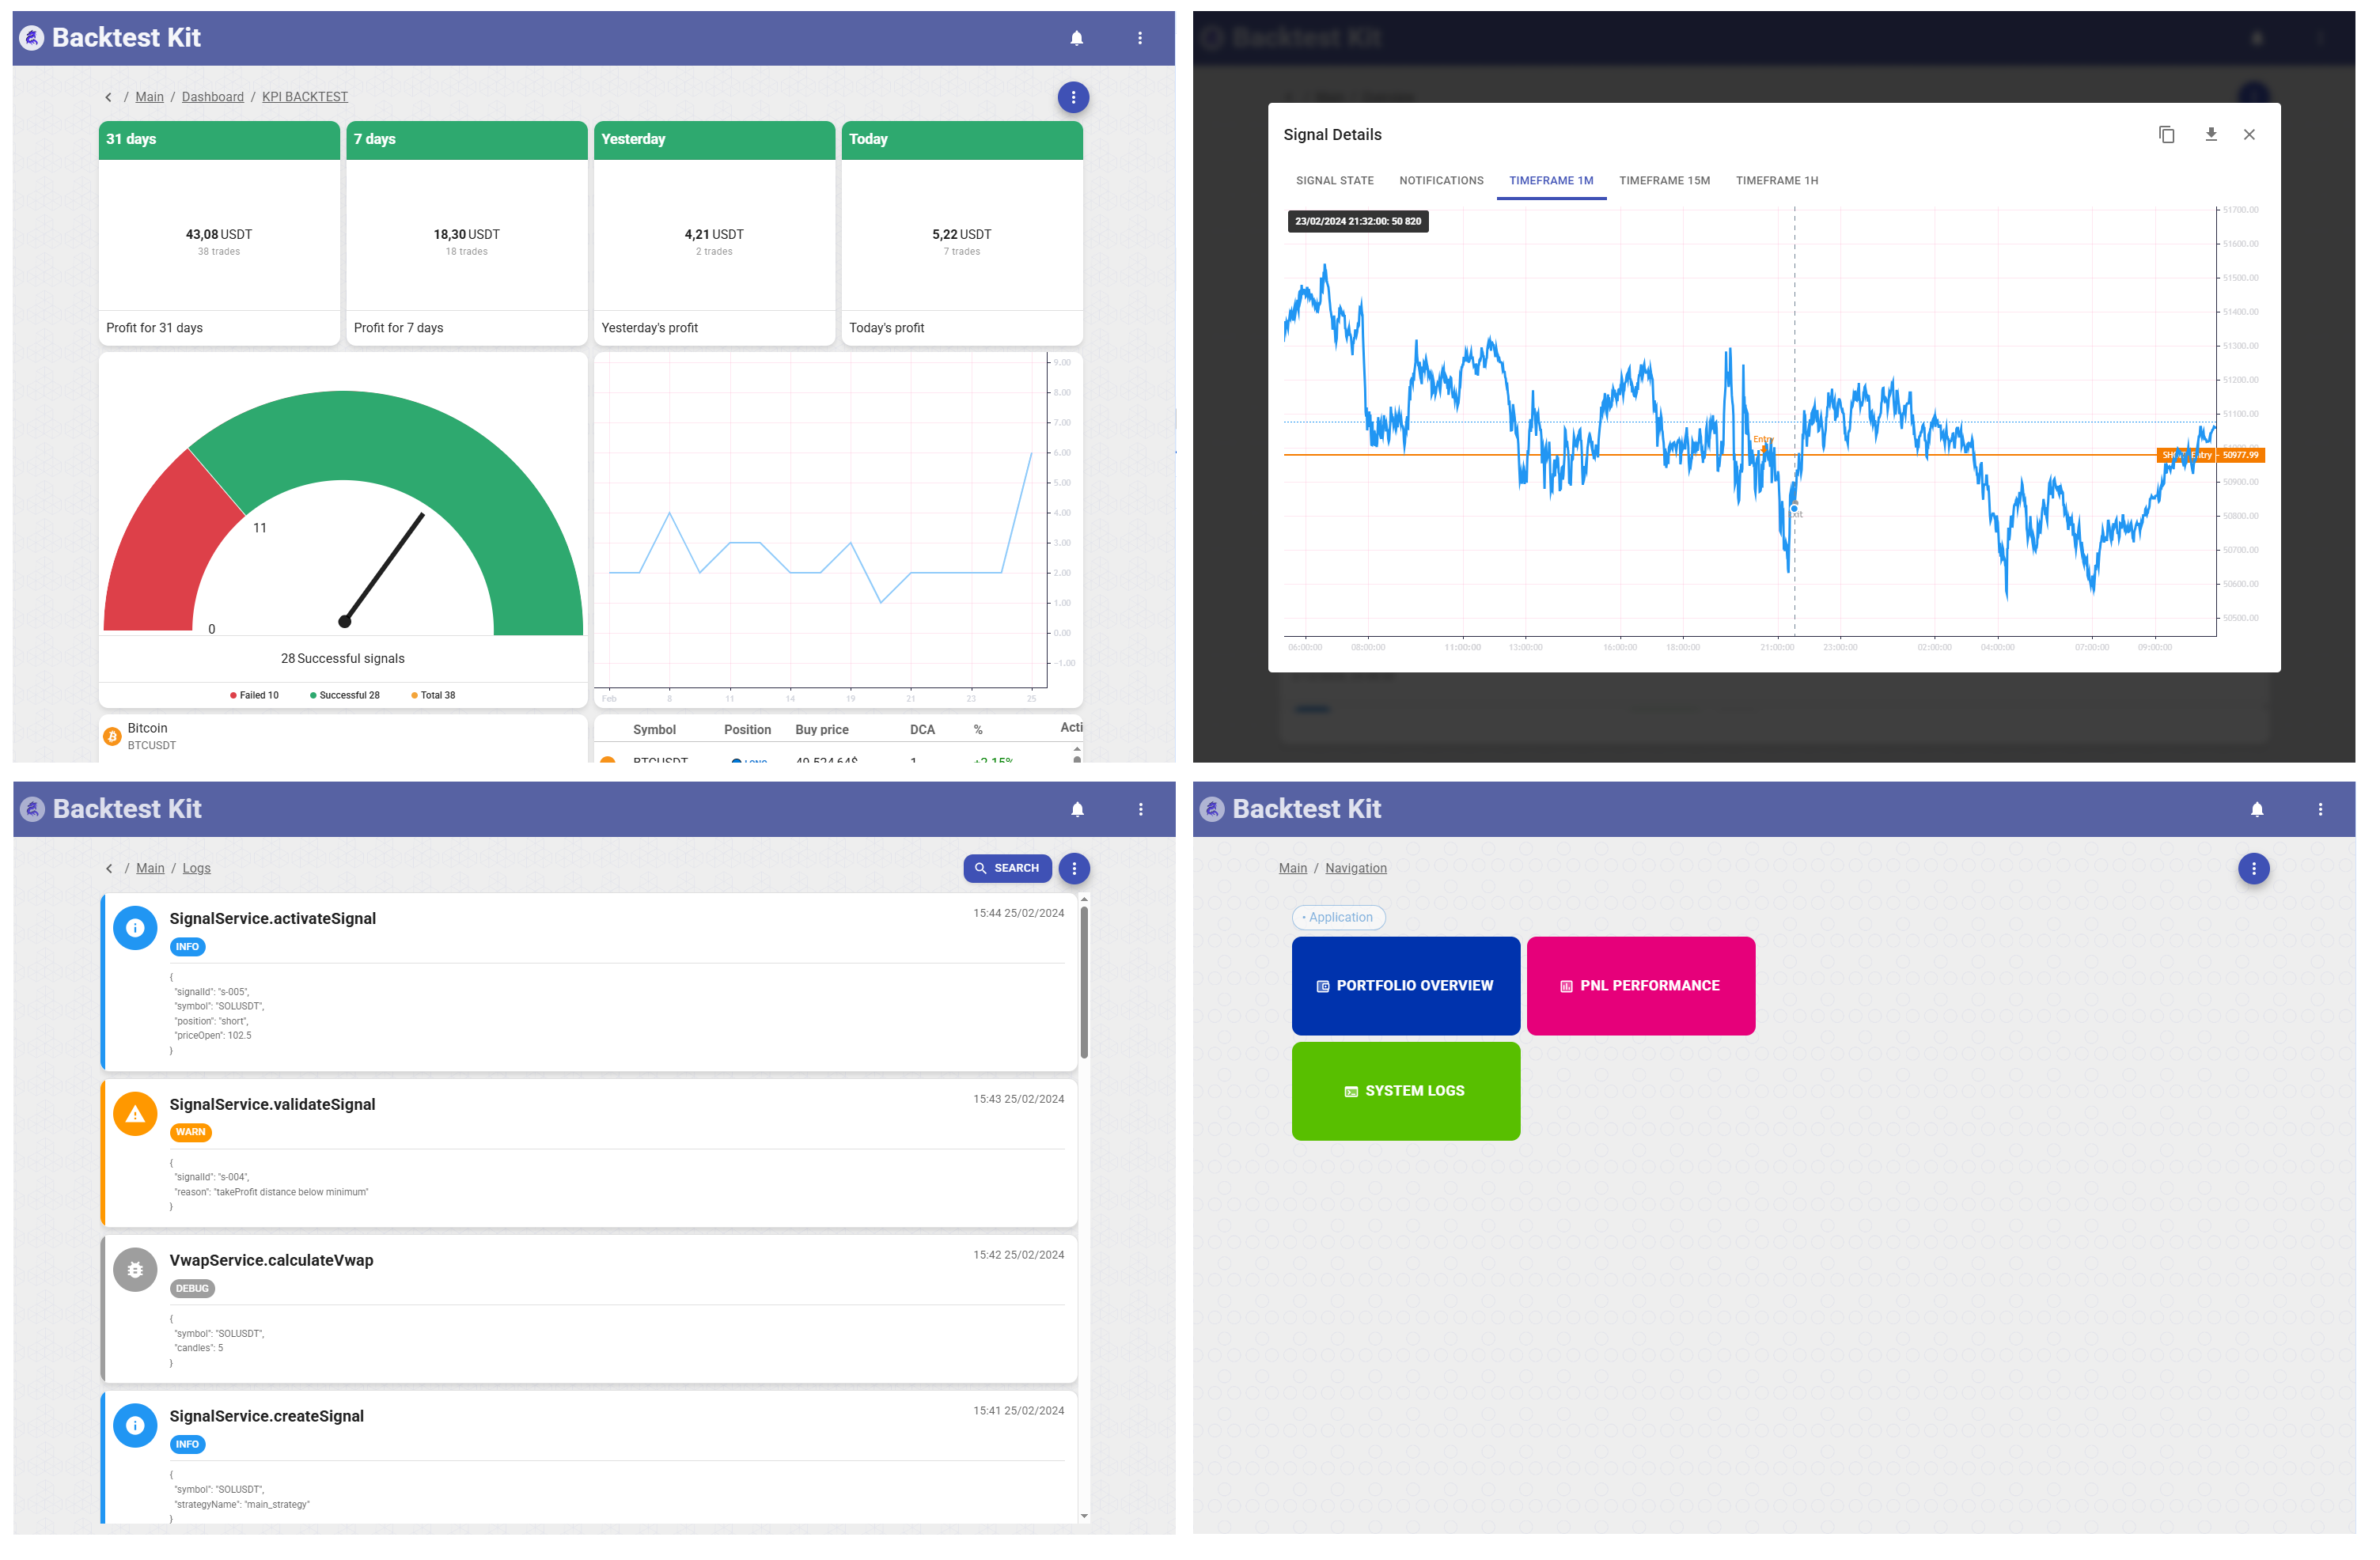
The web cockpit for backtest-kit. A self-hosted dashboard that turns a running backtest or live session into screens you can read: portfolio cards, KPI boards, candlestick charts with signal overlays, a notification feed, a strategy heatmap, markdown reports, a dump-file explorer, a live manual-control panel, and an in-browser Pine Script editor.
![]()

Interactive dashboard for backtest-kit with signal visualization, candle charts, risk analysis, and notification management. Built with React 18, Material-UI, and Lightweight Charts.
📚 Backtest Kit Docs | 🌟 GitHub
New here? The fastest real setup is to clone the reference implementation — a working news-sentiment AI trading system with LLM forecasting, multi-timeframe data, and a documented February 2026 backtest. Start there, not from scratch.
npm install @backtest-kit/ui backtest-kitimport { serve } from "@backtest-kit/ui";
serve("0.0.0.0", 60050); // → http://localhost:60050One call boots the server and serves the dashboard. Everything below describes what each screen shows you — the layout, the data on it, and what you can do there.
The shell
Every page sits inside a common frame: a top app bar with the logo (click to toggle home), a horizontally-scrollable row of section tabs, a live notification bell, a fullscreen toggle, and a GitHub link. A thin progress bar under the app bar animates whenever a screen is loading data. Below the bar, most screens open with a breadcrumb strip (Main › Section › …) that doubles as the action bar — refresh, download, print, and mode-switch buttons live there.
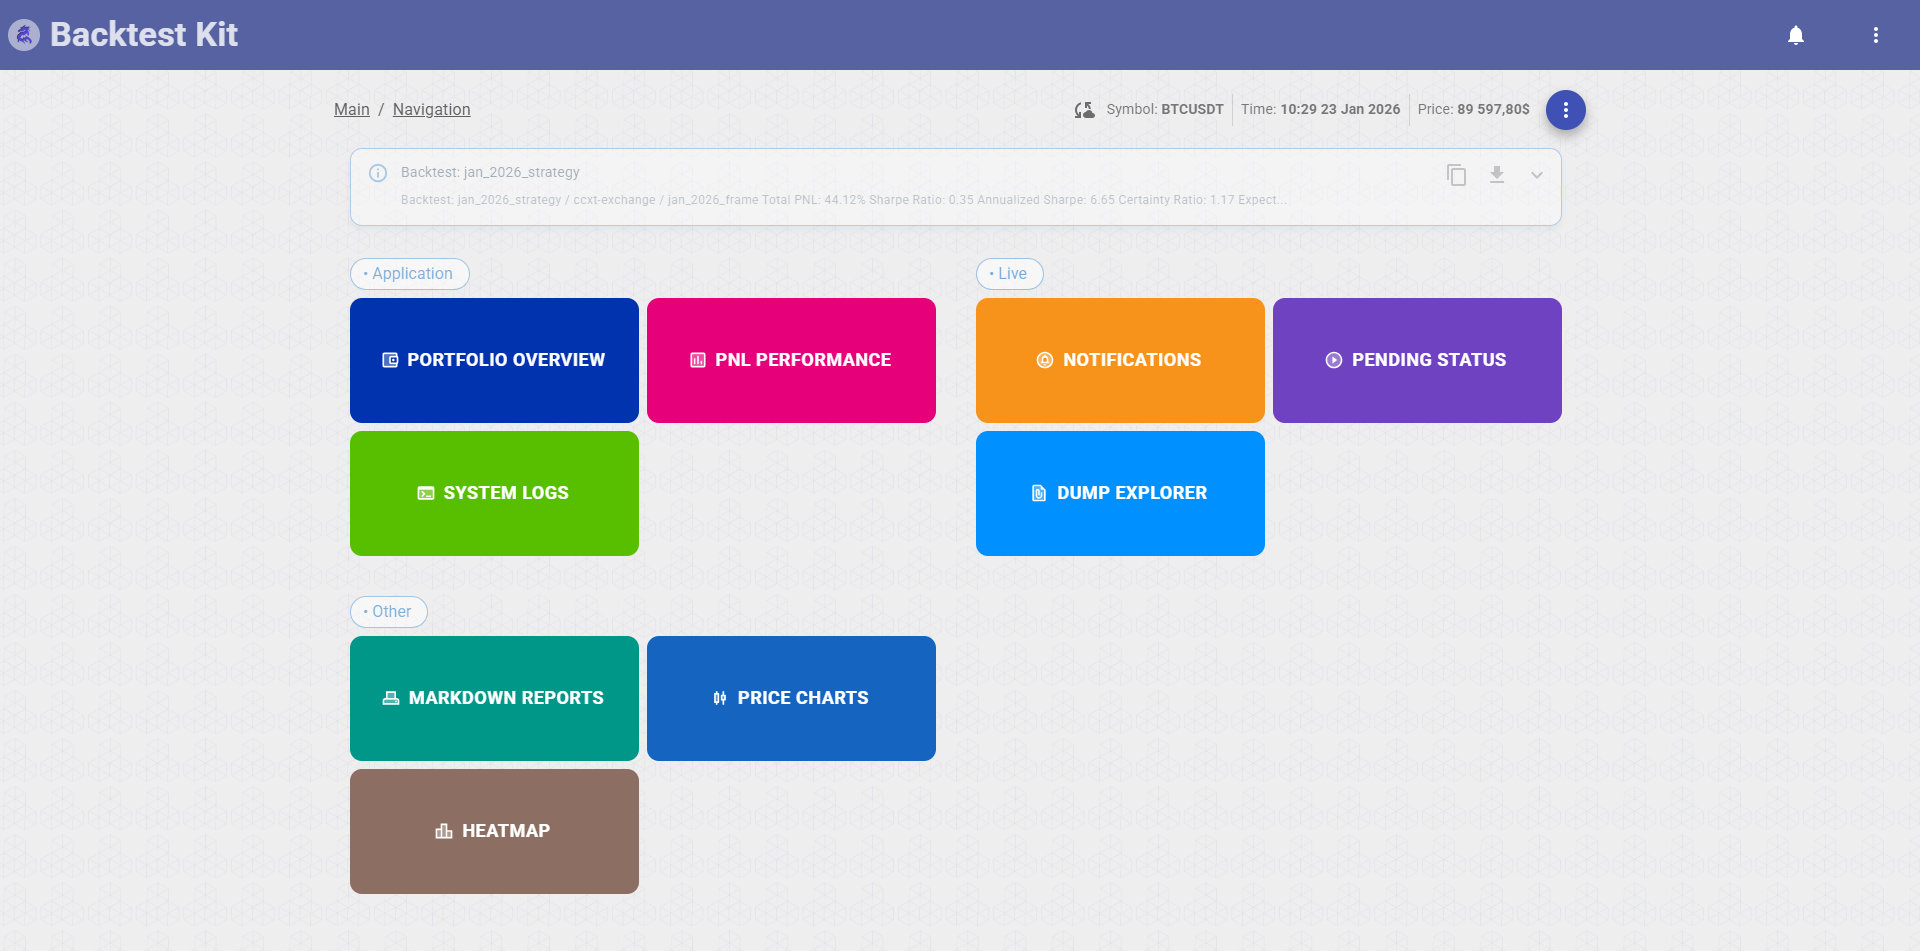
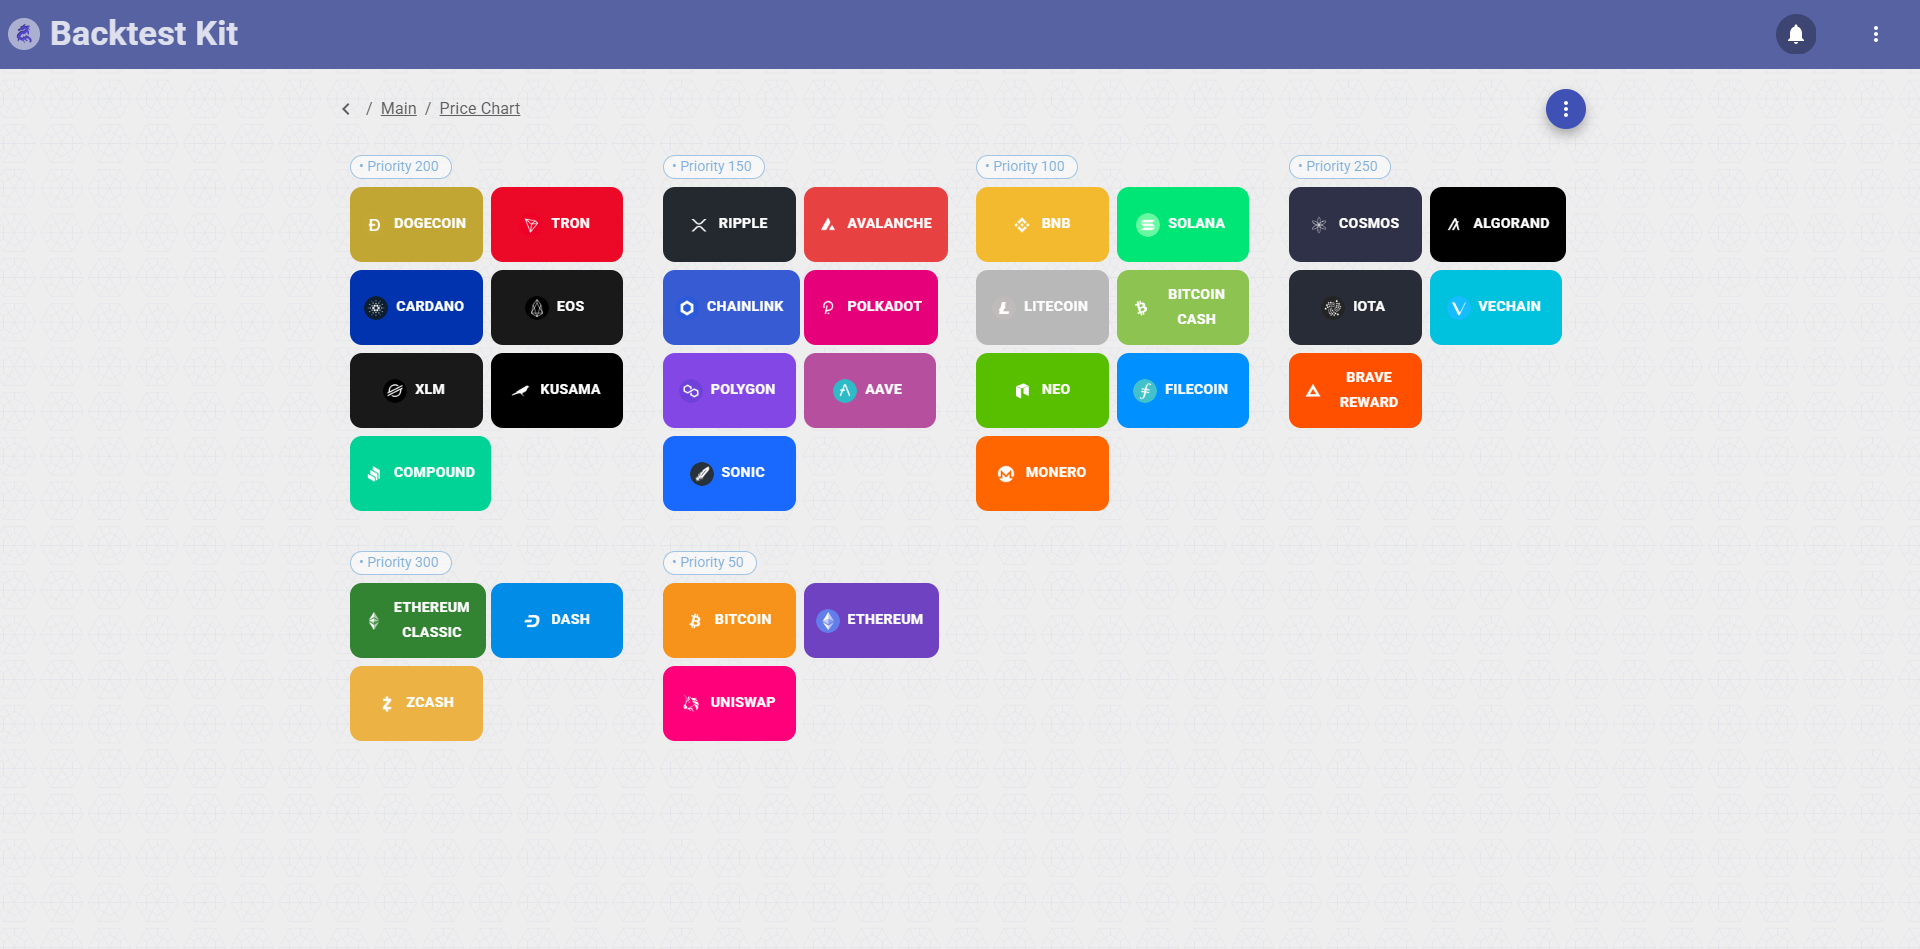
The home screen (/main) is a launchpad: three labelled groups of large colored tiles, each tile a doorway to one section, with a status banner up top summarizing the engine. The groups:
- Application — Portfolio Overview, PNL Performance, System Logs
- Live — Notifications, Pending Status, Dump Explorer
- Other — Markdown Reports, Price Charts, Heatmap
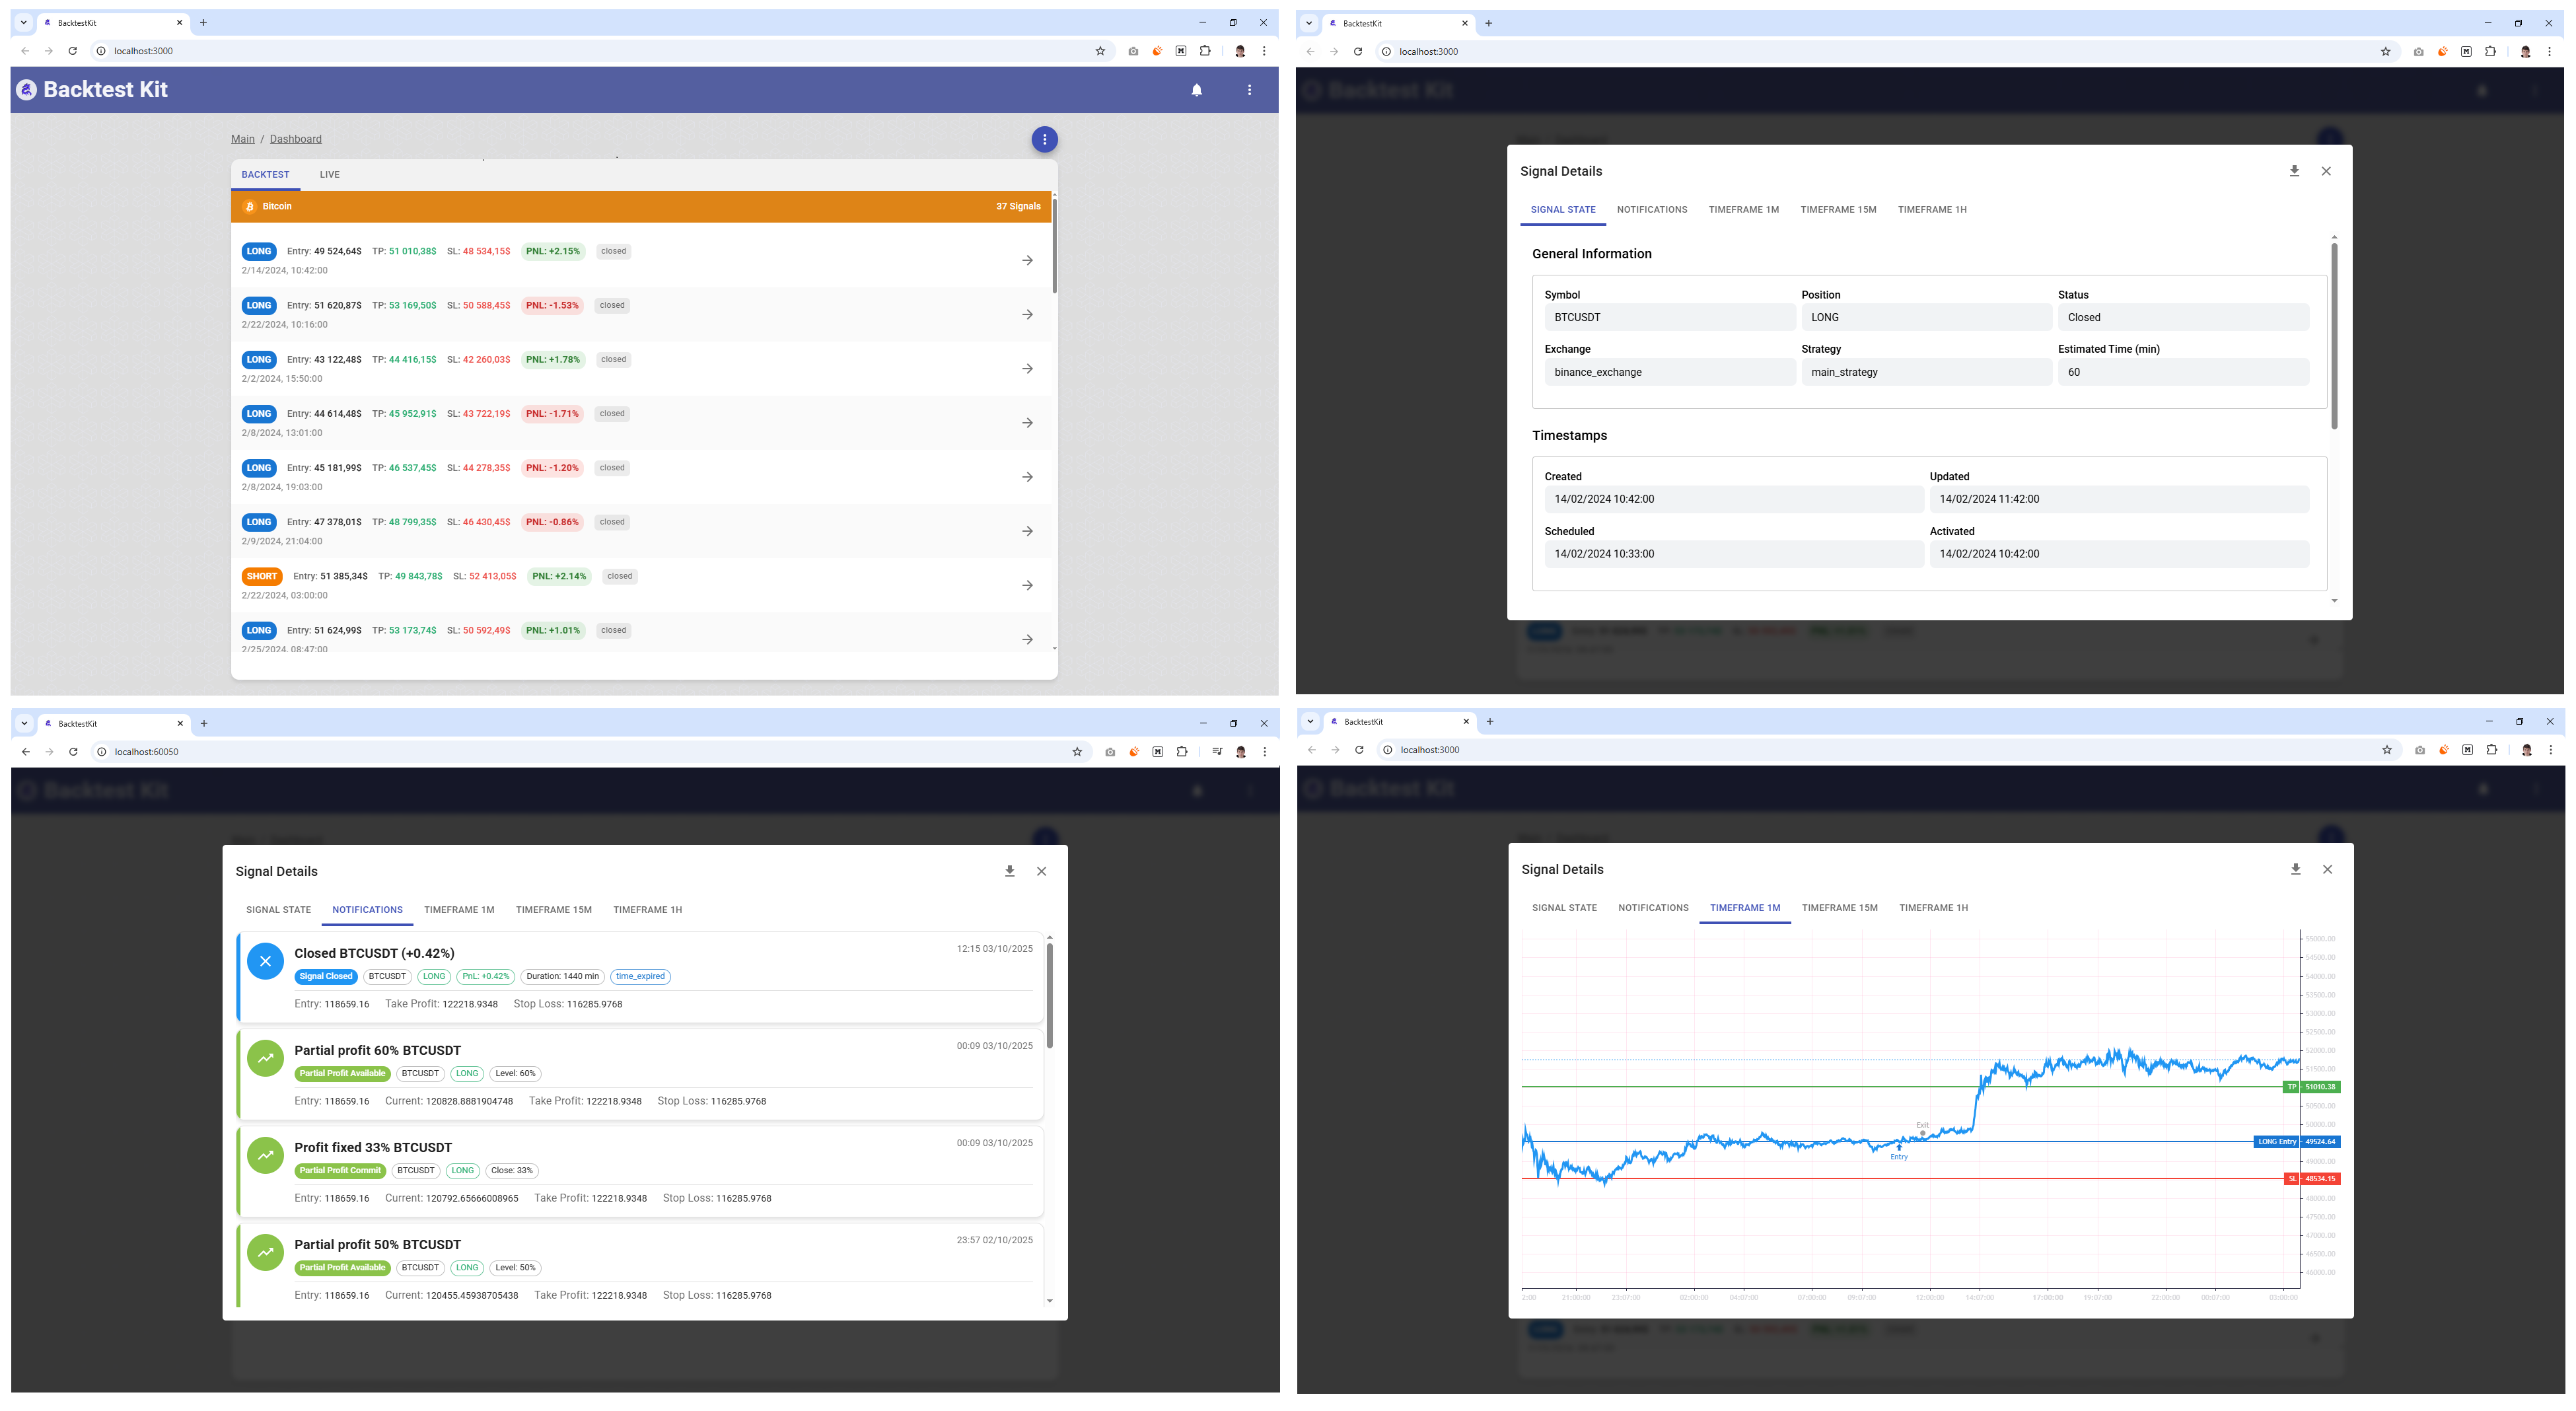
Portfolio Overview — /overview
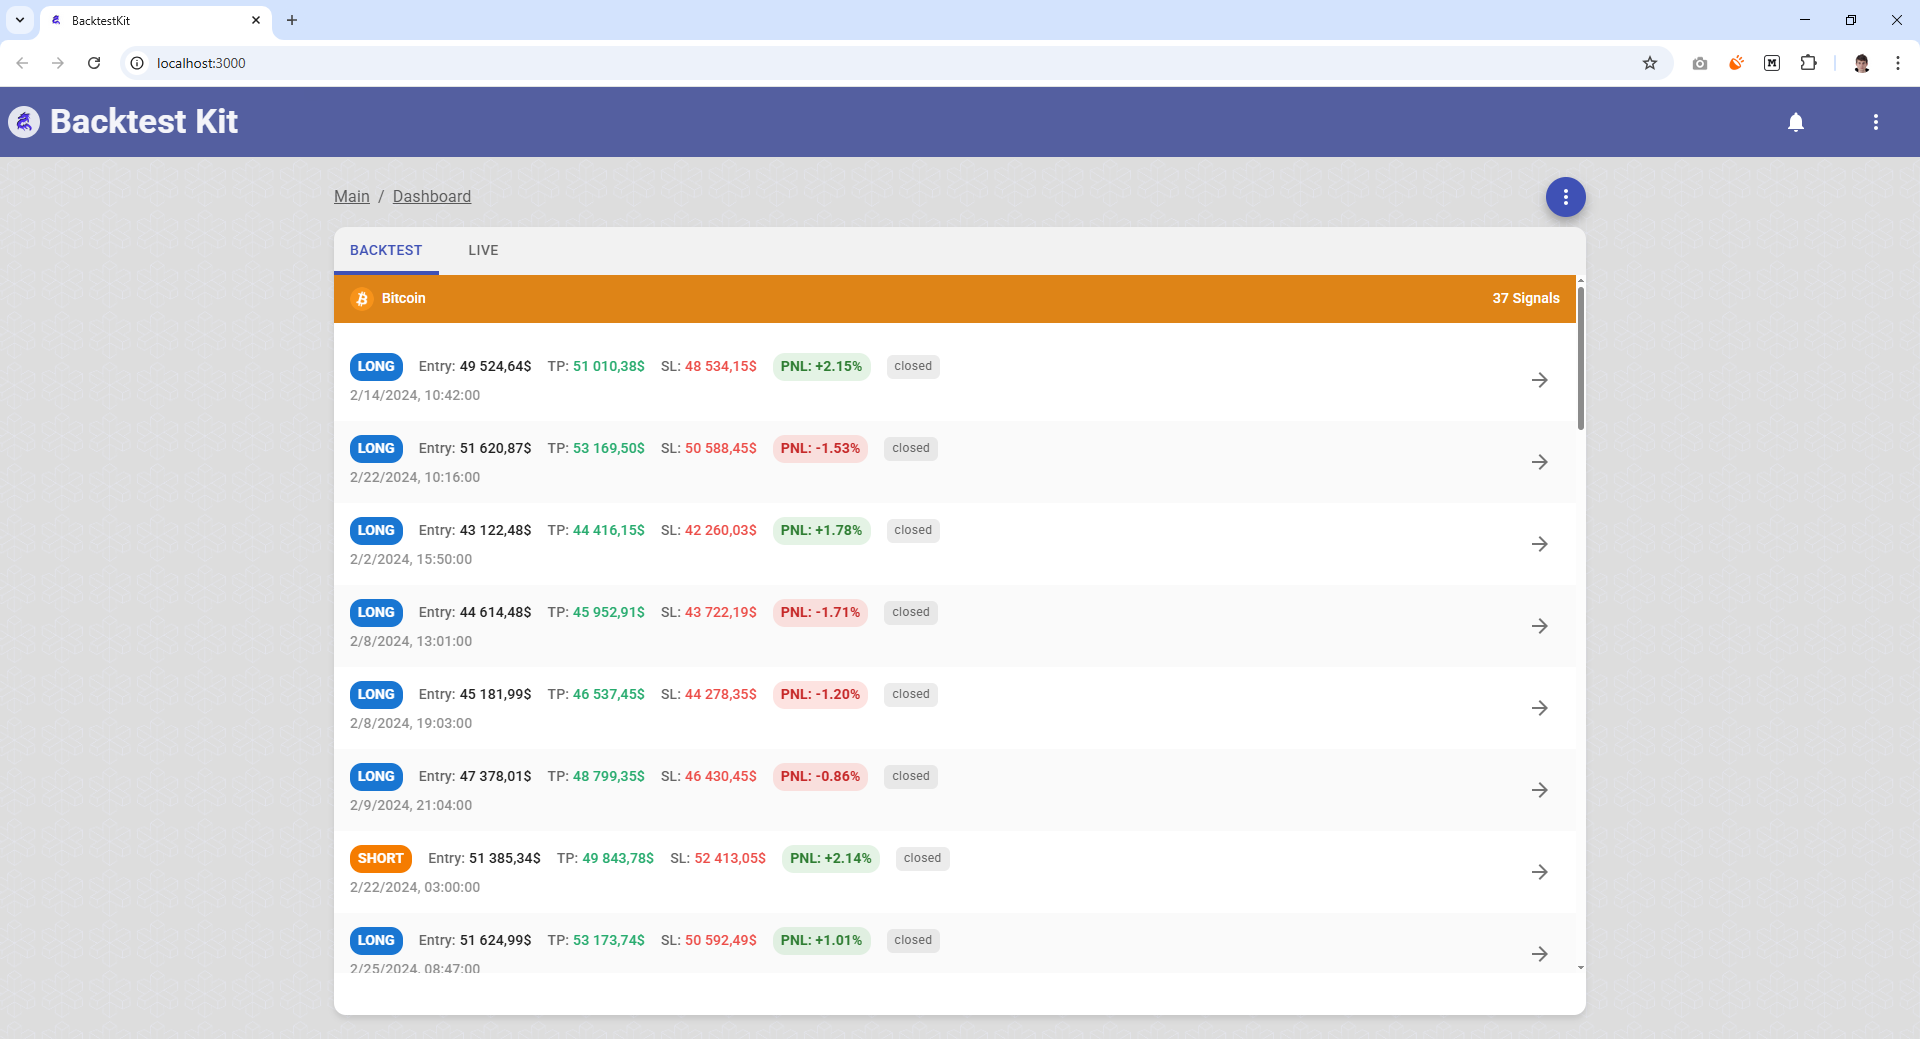
Closed trading signals, grouped by symbol, split across Backtest and Live tabs at the top.
Each symbol gets a section of cards; every card is one closed signal showing position type (long/short), entry price, take-profit and stop-loss levels, and the realized PNL in both amount and percent. Where a position used dollar-cost averaging or partial closes, the card displays the DCA entry count and partial-close count. A Backtest/Live tab toggle switches the dataset; the list supports JSON export and manual refresh. Layout is a scrollable tabbed container with a decorative background.
PNL Performance (Dashboard) — /dashboard · /dashboard/:mode
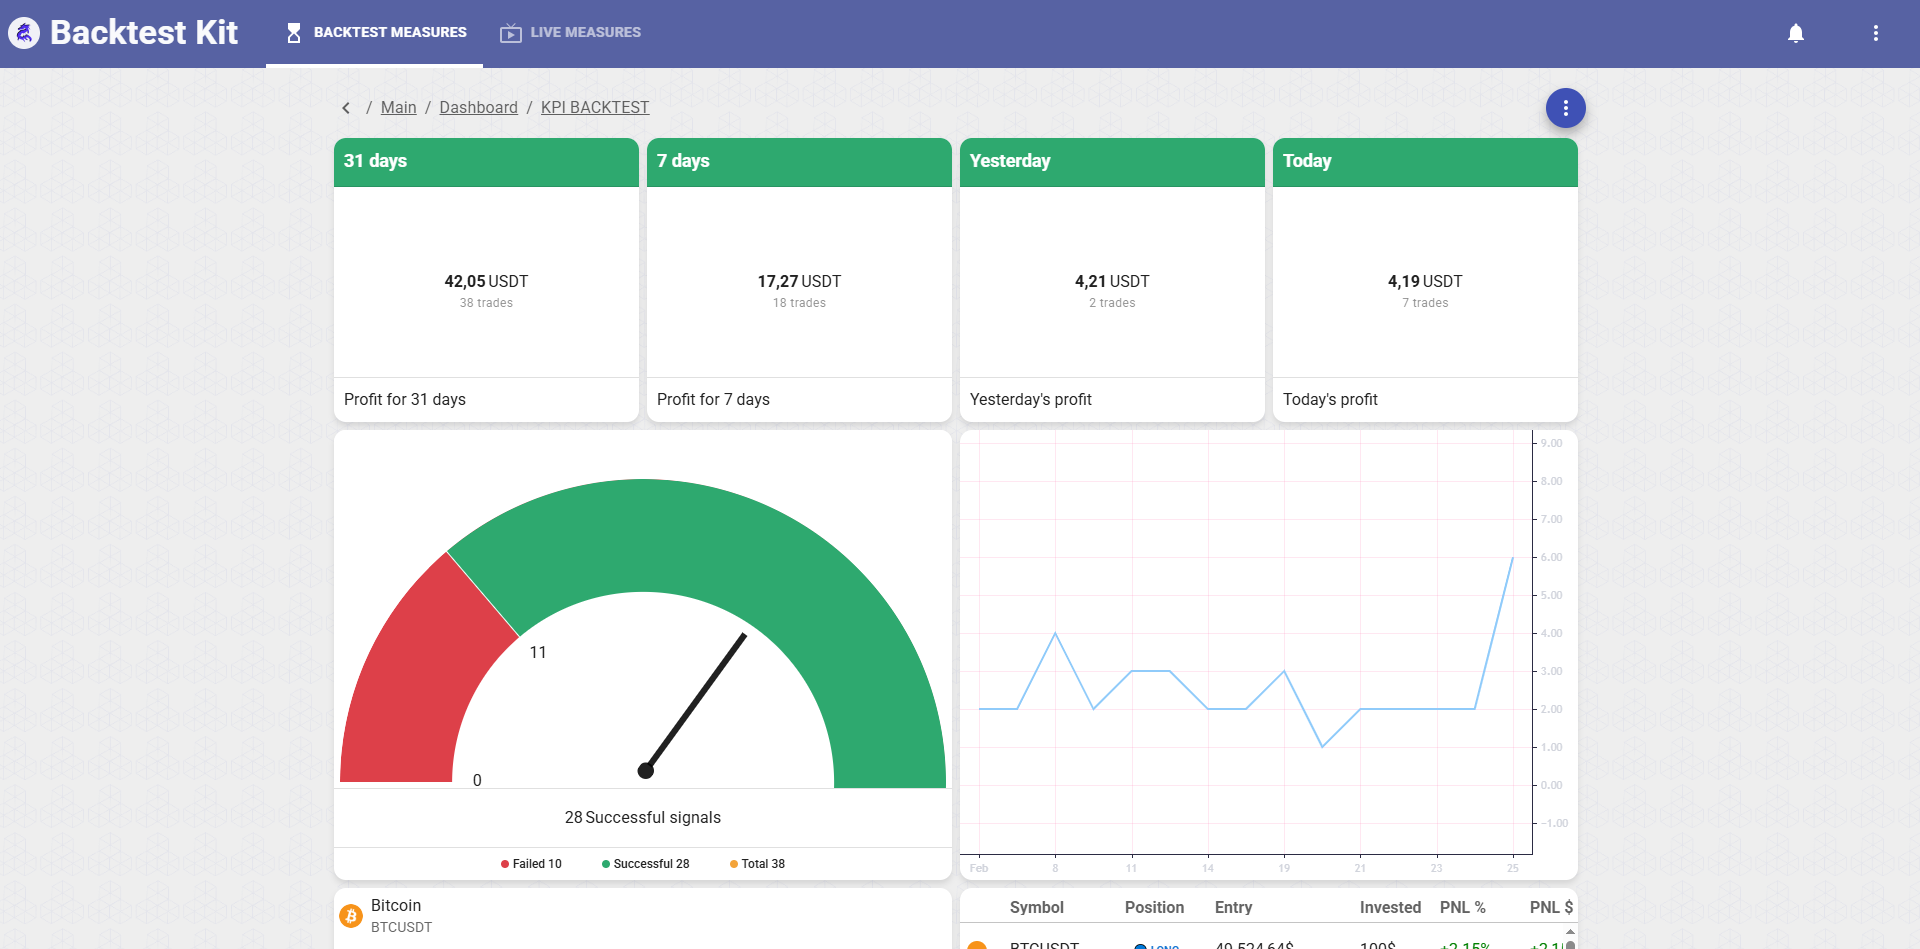
The KPI board. Aggregates trading performance across all symbols for the chosen mode.
Inside a breadcrumb header (KPI BACKTEST / KPI LIVE) the body is a declarative field grid (dashboard_fields) of live widgets fed by four aggregated measures pulled per-symbol and summed:
- Four revenue cards (
SingleValueWidget) — Today / Yesterday / 7 days / 31 days, each showing profit in USDT with a trade-count caption, color-coded red (loss) / green (profit) / orange (flat). - Trade-performance donut (
SpeedDonutWidget) — Failed vs. Successful vs. Total signal counts. - Daily-trades chart (
ChartWidget) — a per-day series of total / resolved / rejected trades. - Success-rate panel (
SuccessRateWidget) — per symbol (icon + display name), broken into take-profit / stop-loss / close-resolved / close-rejected counts. - Signal grid (
SignalGridWidget) — the paginated signal table for the active mode.
The breadcrumb actions: Download (exports the raw signals as a timestamped JSON blob), Switch to LIVE / BACKTEST (jumps between modes), and Refresh manually (clears the signal cache and reloads). A modal loader covers the board while it recomputes.
System Logs — /logs
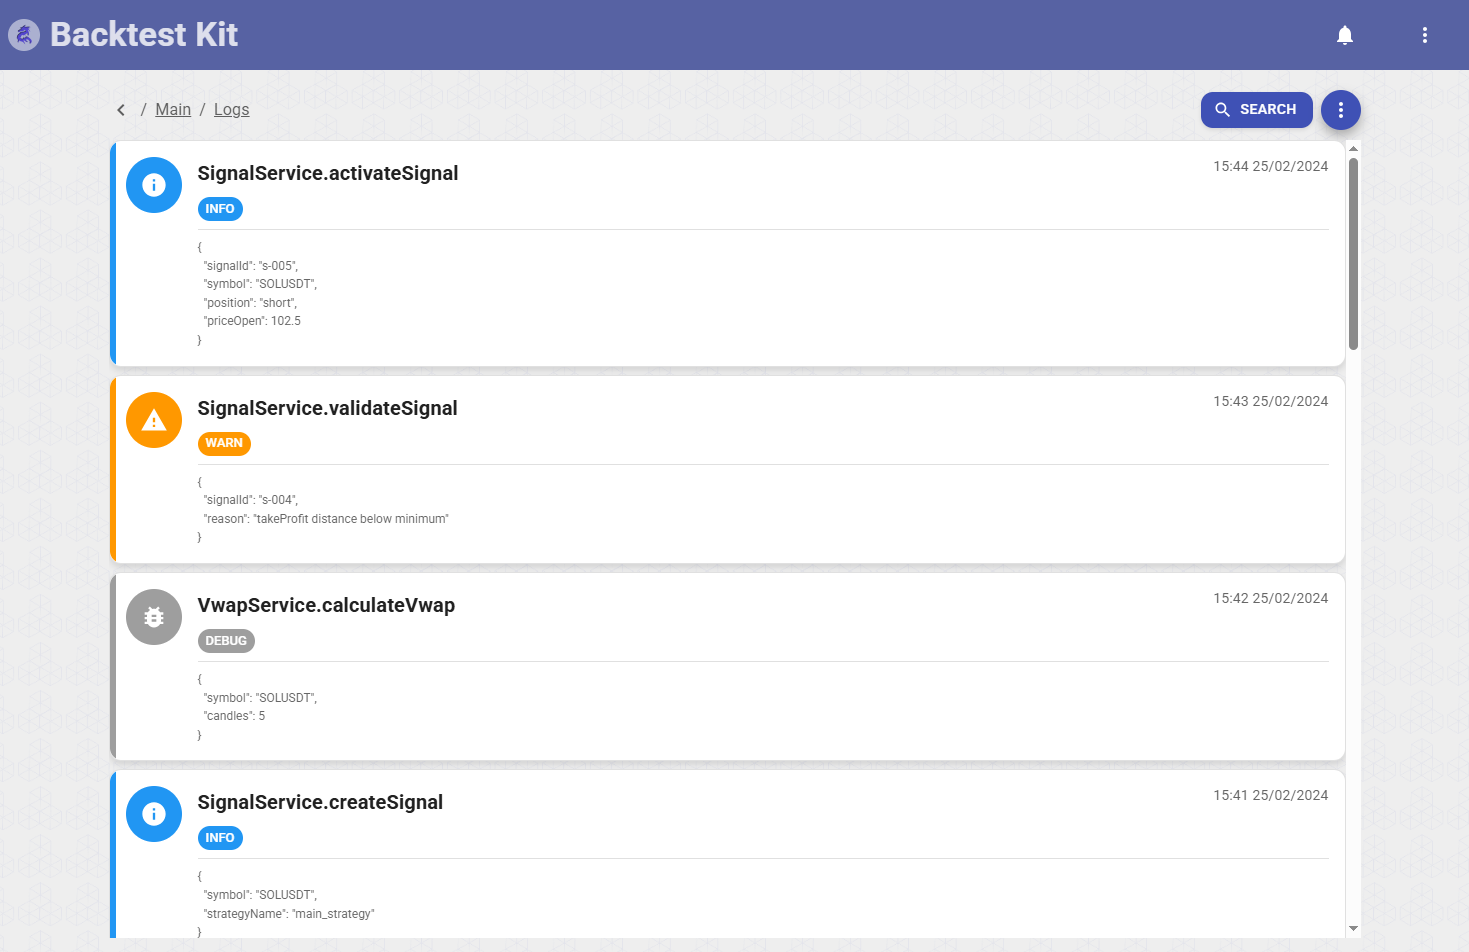
A virtualized, filterable feed of the engine's runtime log.
Each entry is a row with a type badge (Debug / Info / Warn / Log), the log topic, a timestamp, and the raw JSON arguments rendered in monospace. A search prompt filters by keyword or regex. The whole log exports as a JSON file. Virtualized so it stays smooth over very long histories.
Notifications — /notifications
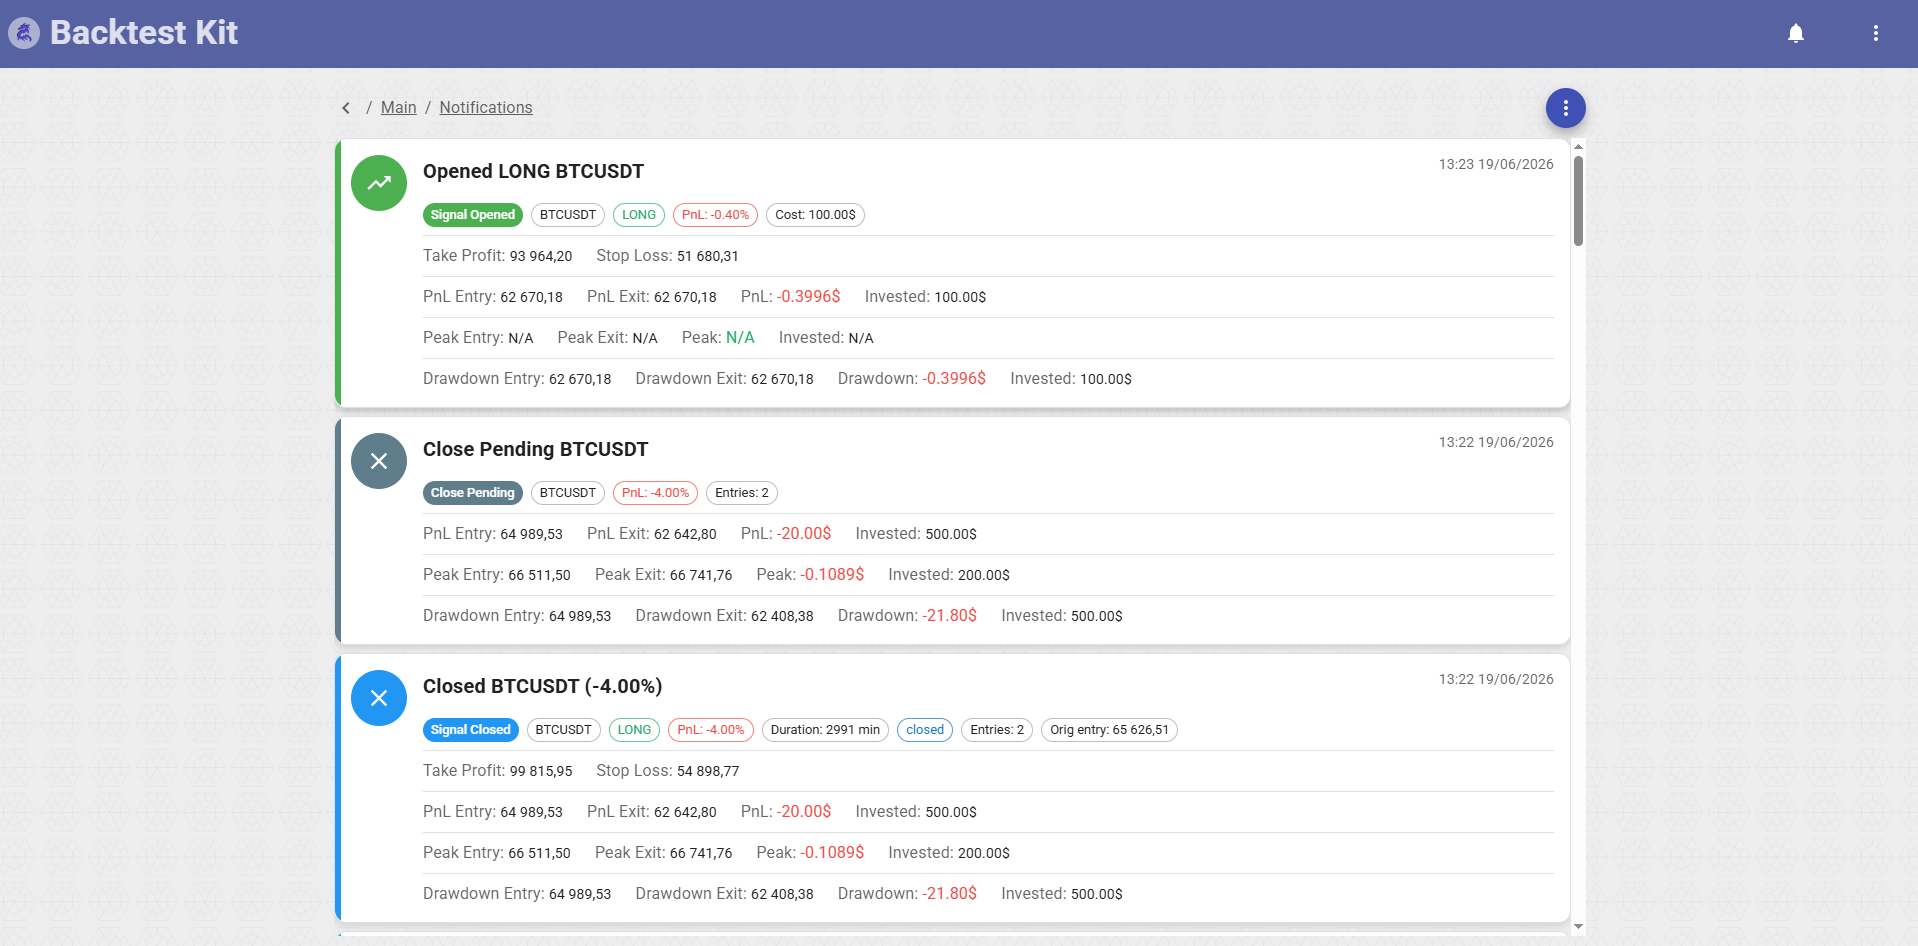
The event feed for the entire signal lifecycle.
Color-coded cards, one per event — opens, closes, schedules, errors — each showing symbol, position, PNL, and the entry / exit / TP / SL prices. Infinite-scroll pagination loads more as you go; clicking a card opens a detailed modal for that event. Manual refresh pulls the latest activity. The same notifications drive the bell badge in the app bar.
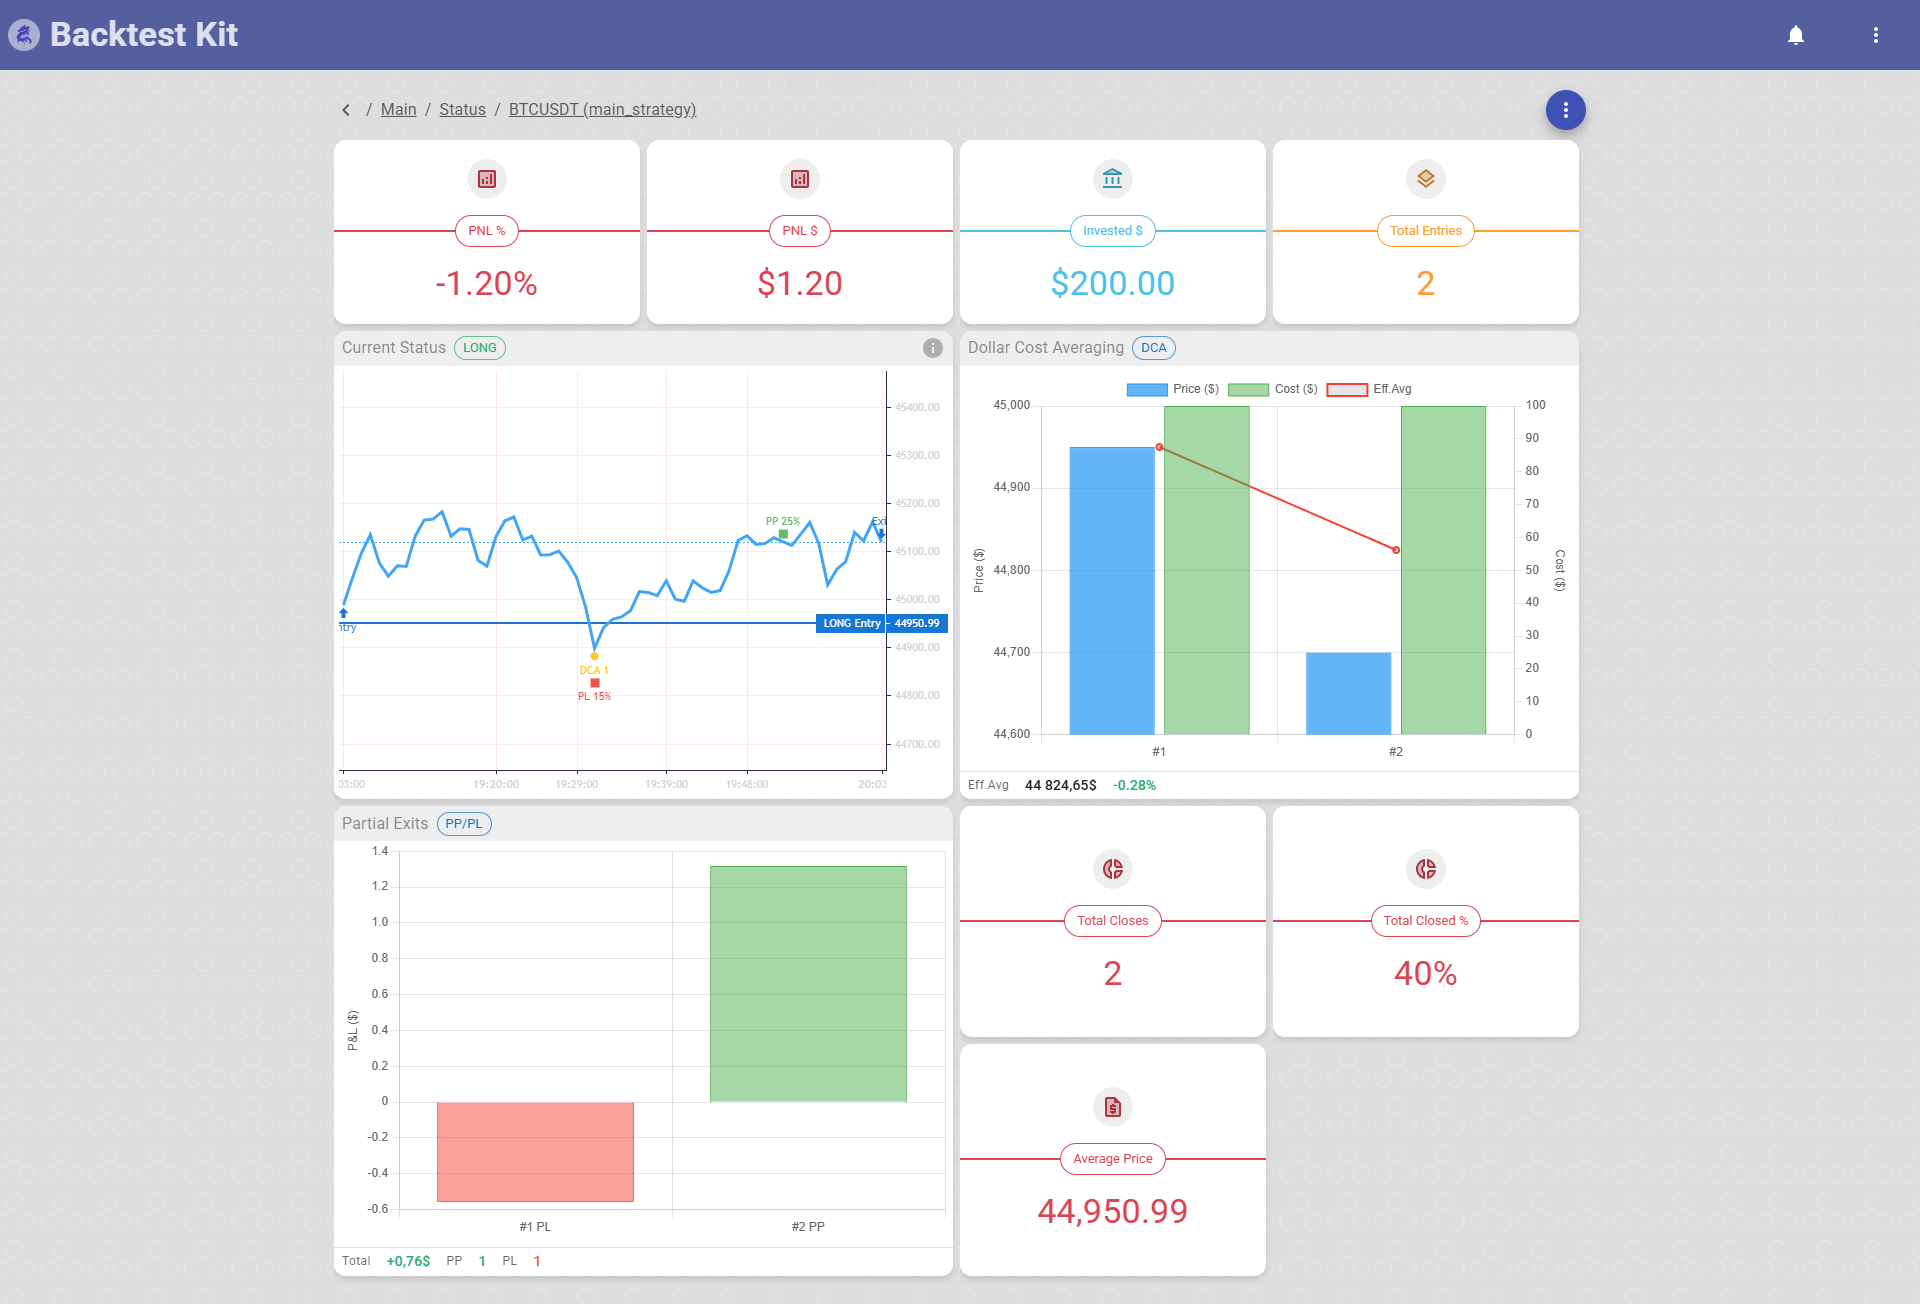
Pending Status — /status → /status/:id → /status/:id/control
A three-level drill-down for live positions: list → detail → manual control.
List (/status) — active signals grouped by strategy, rendered as a grid of strategy buttons; click one to inspect it.
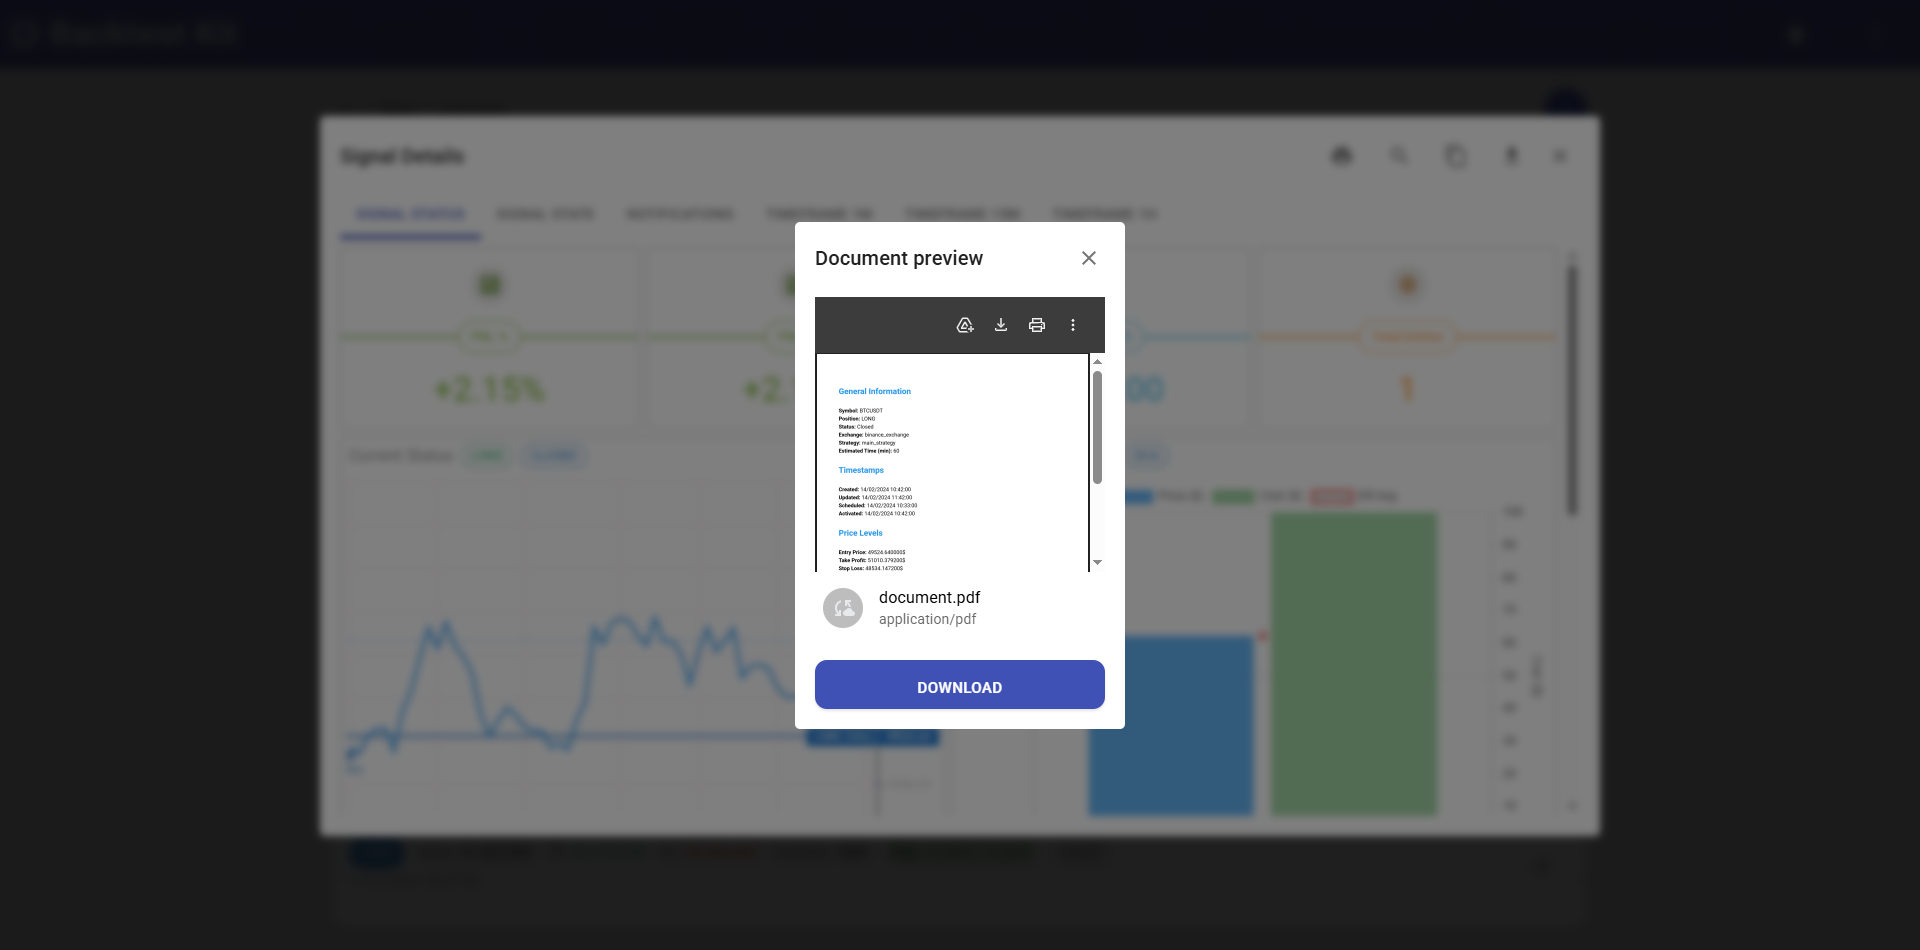
Detail (/status/:id) — the full state of one pending signal as a structured field view (status_fields): entry, exit, effective (blended) price, DCA entry count and partial-close count, and live PnL. Header actions: Manual Control, Print (renders the signal's fields to a downloadable PDF/markdown), Download (JSON), Refresh. Empty states read "Loading…" or "No pending signal."
Manual Control (/status/:id/control) — an operator panel (RecordView, expand-all) where you intervene in a live position by hand through four multi-step wizard modals: Open Pending, Average Buy, Close Pending, and Breakeven. Each is launched from the panel via an emitter, walks you through Briefing → Input → Submit, fires the commit, and reloads the record. Export to JSON is available. (See The modal system below for how these are built.)
Markdown Reports — /report
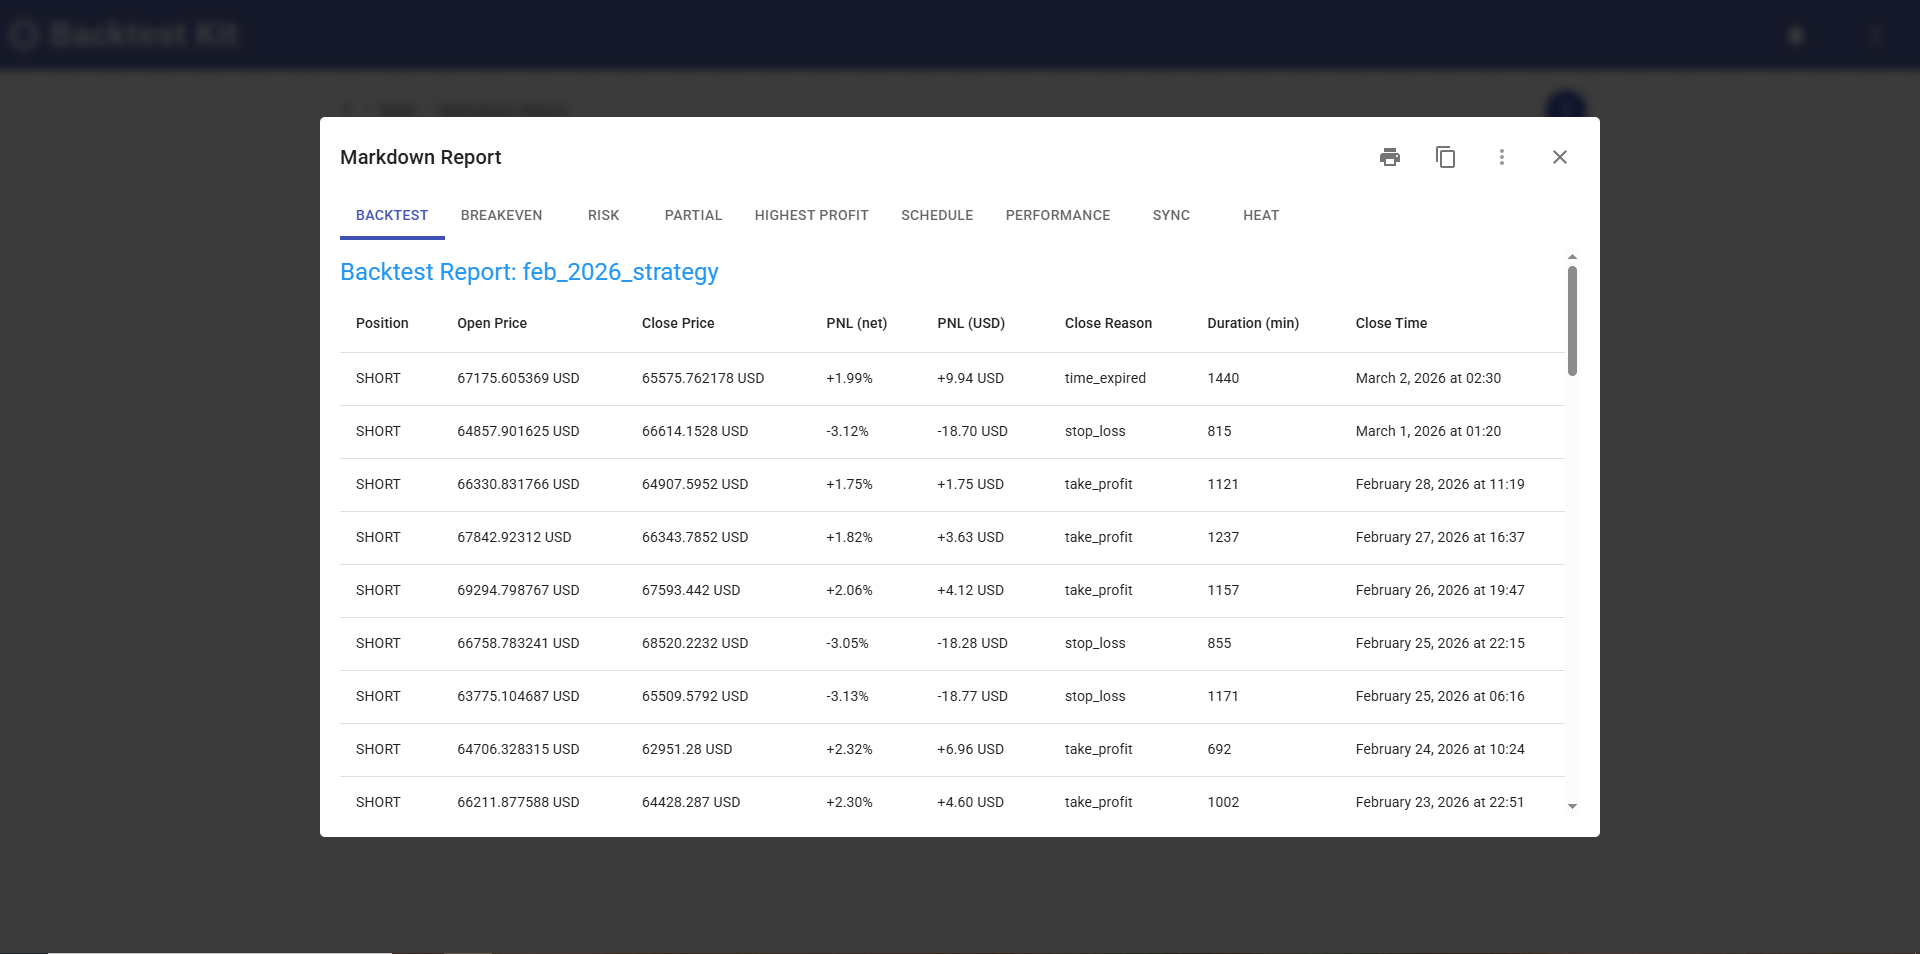
Rendered strategy-performance reports for Backtest and Live runs.
A grid of strategy buttons, grouped by type and sorted by signal volume; selecting one renders its markdown report inline. Each report downloads as markdown, PDF, or raw JSON. Manual refresh regenerates the content. This is the human-facing view of the engine's analytics (strategy / breakeven / risk / partial / drawdown / schedule / performance / sync reports).
Price Charts — /price_chart → /price_chart/:symbol → /price_chart/:symbol/:interval
Interactive candlesticks powered by TradingView Lightweight Charts.
You navigate by symbol, then by interval (1m / 15m / 1h) to view price history. The chart overlays the active signal's lines: entry, take-profit (green), and stop-loss (red). Supports chart-image export and clicking through to signal detail. Built on the shared ChartWidget.
Heatmap — /heat
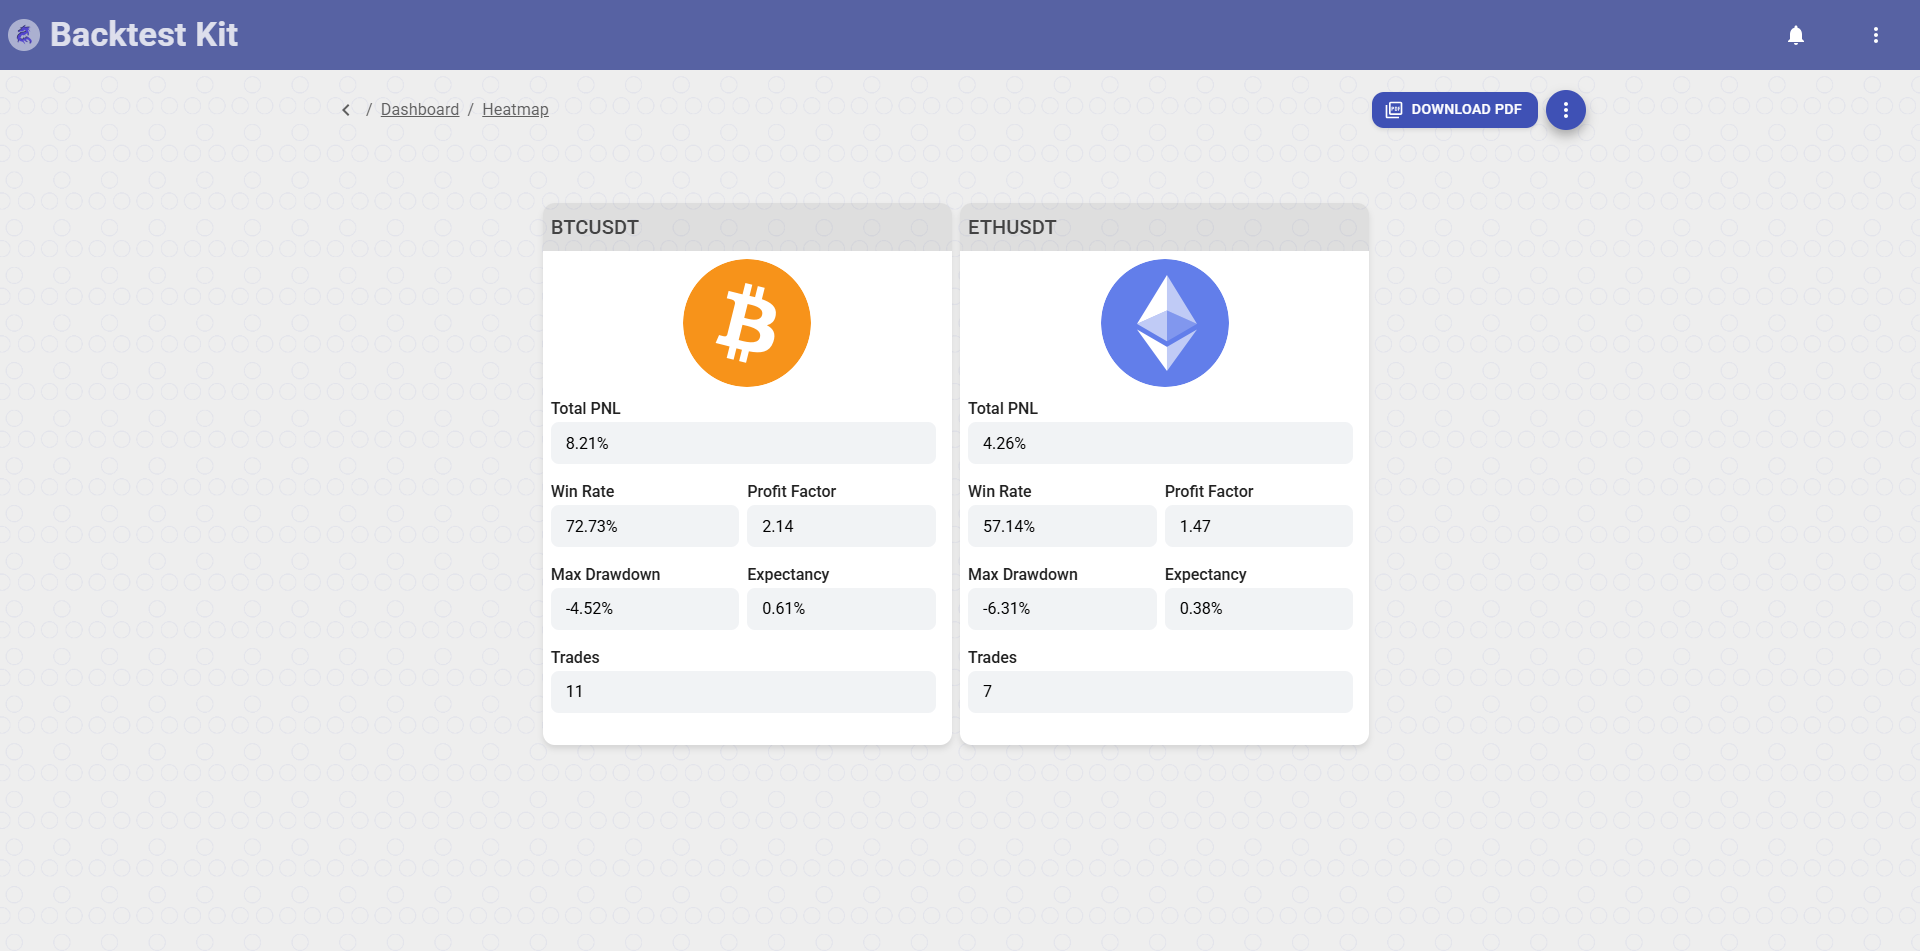
A color-coded performance matrix across every tracked symbol.
Cells are colored by performance; each shows win rate, profit factor, Sharpe ratio and other aggregated metrics per symbol. The whole heatmap exports as JSON, markdown report, or PDF, with manual refresh to recalculate the statistics. (The same heat report download lives on the home screen's action bar.)
Dump Explorer — /dump · /dump/:search
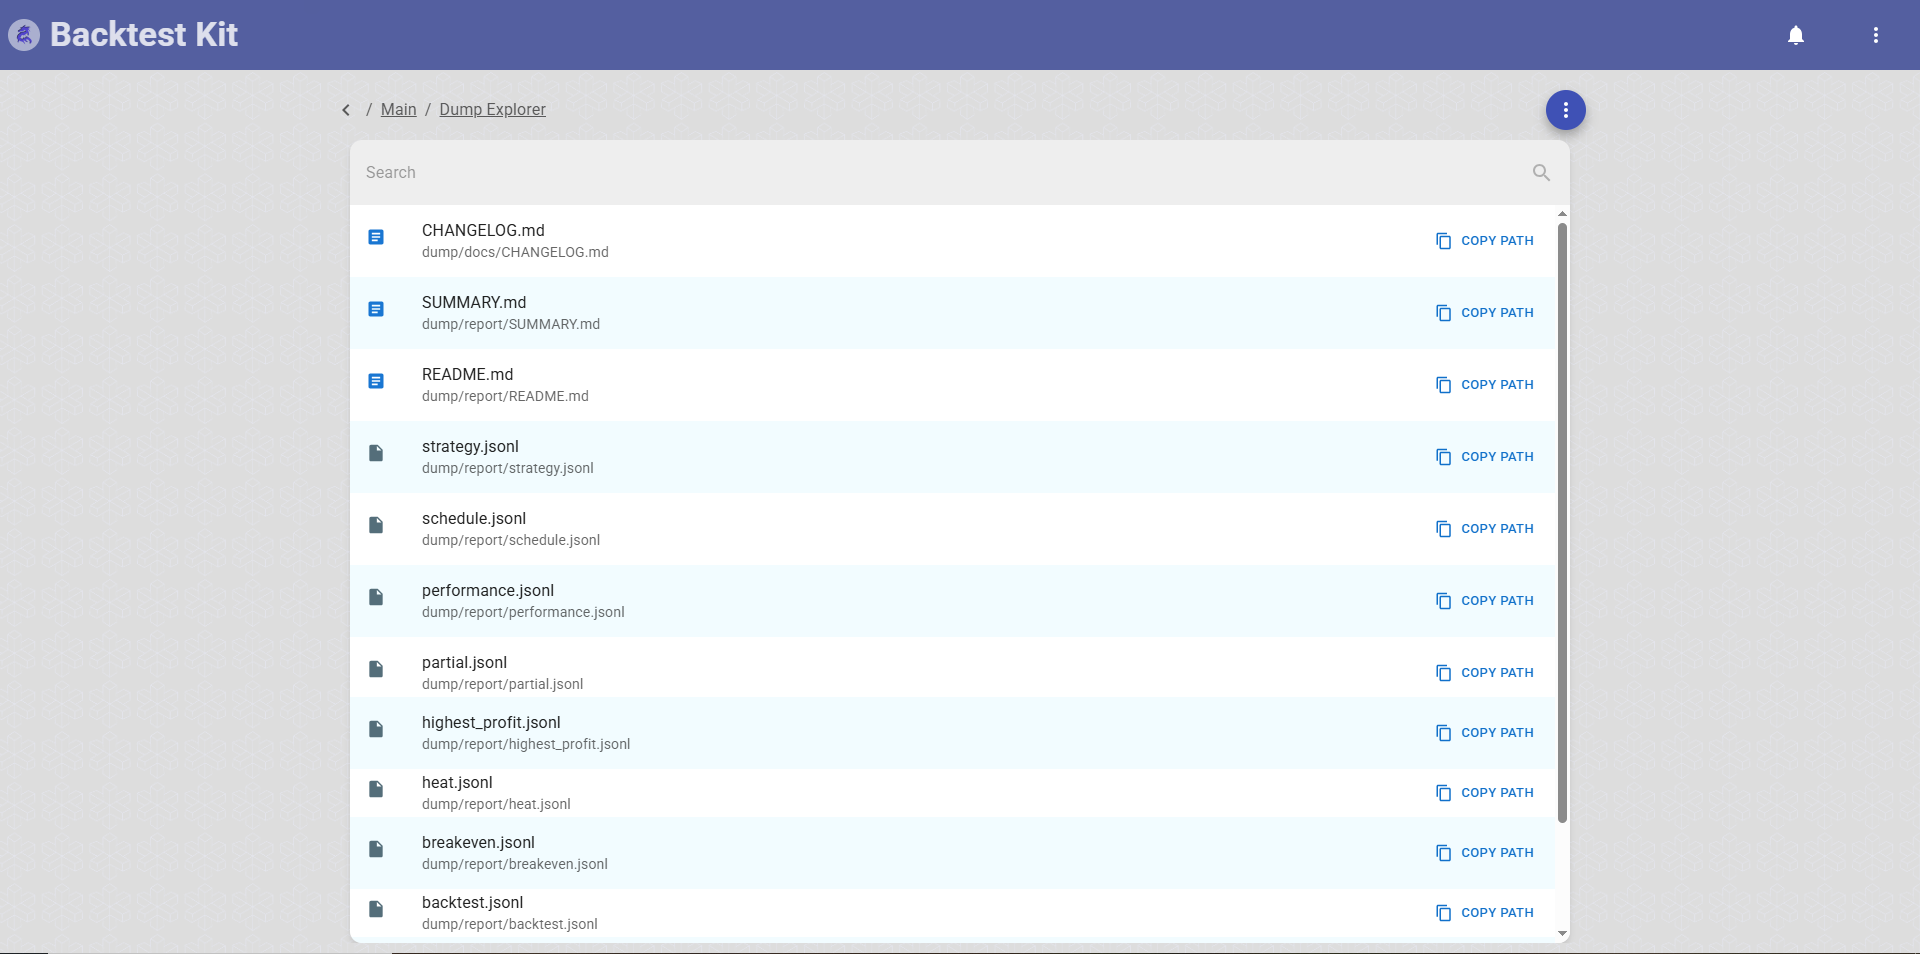
A file browser for everything the engine wrote to disk.
A tree-structured browser of backtest output and artifact files. Icons mark file type — image, JSON, plain text, or generic. Clicking a file opens a full-screen preview modal. Keyword search filters the tree; manual refresh rebuilds it. Backed by the FileTreeWidget.
About & Setup — /about · /about/setup
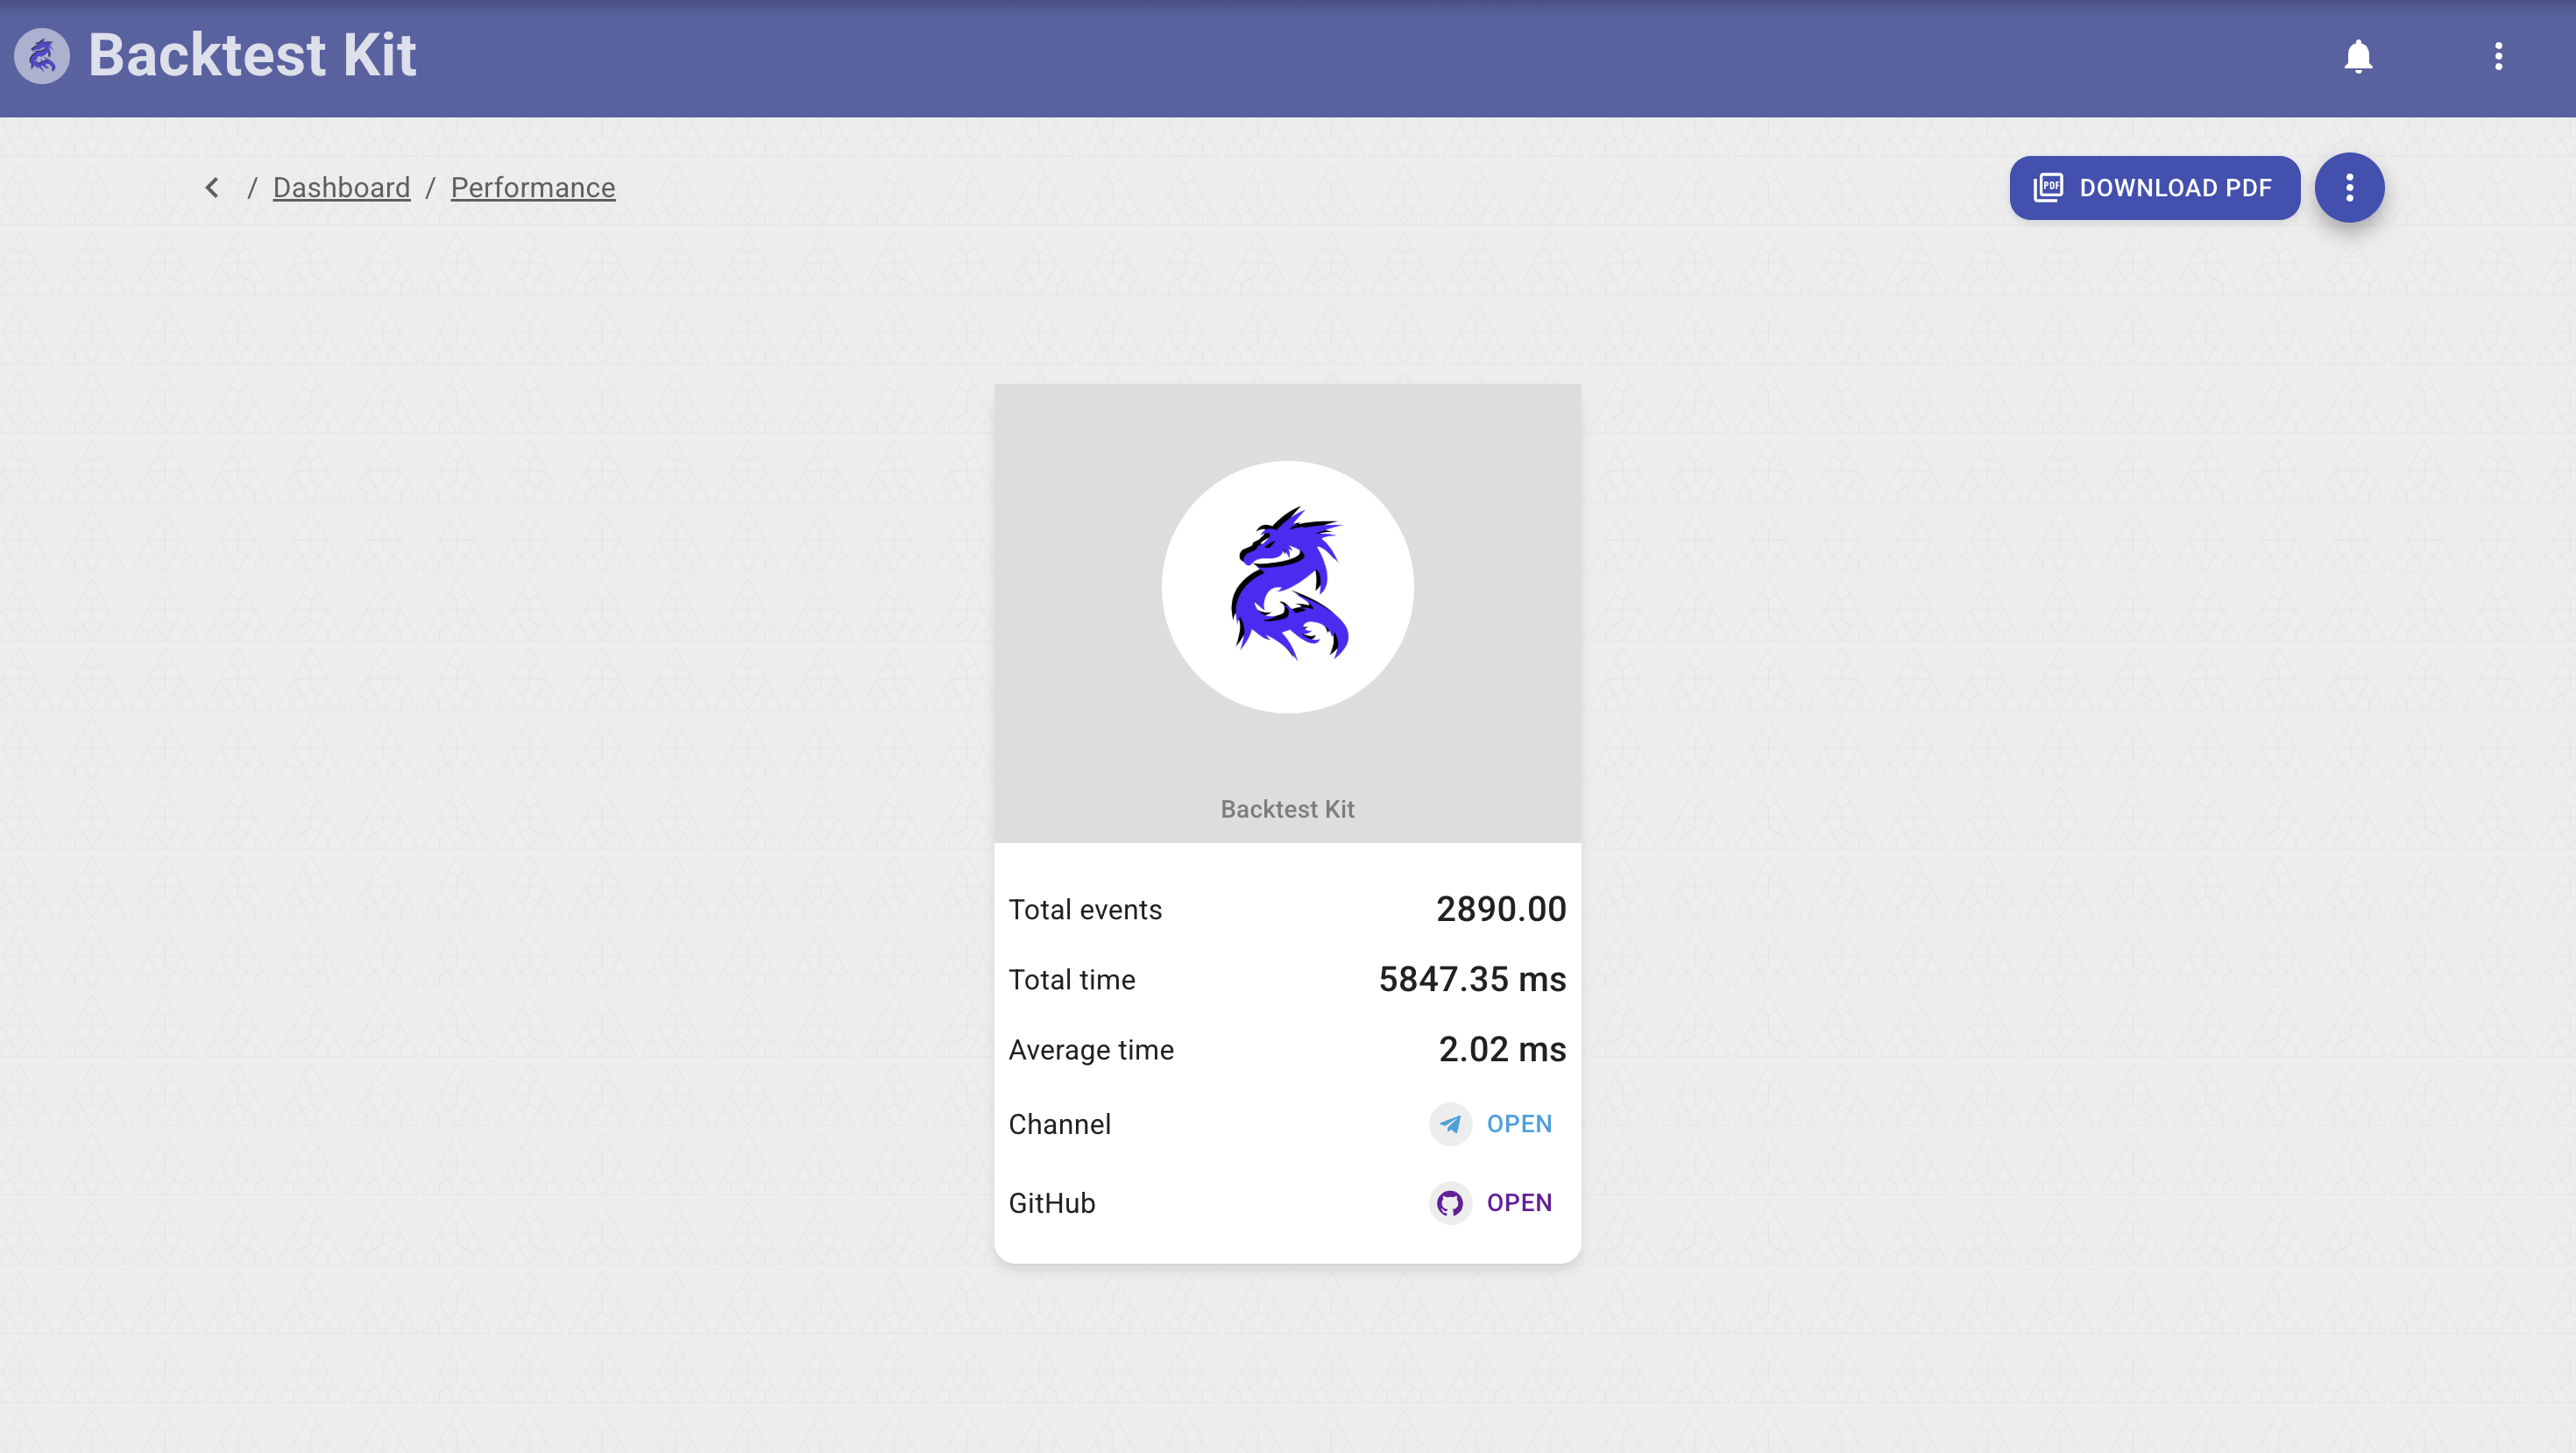
Framework information (/about) and a Setup view (/about/setup) showing the resolved configuration / environment of the running instance.
Widgets — the reusable pieces screens are built from
- ChartWidget — Lightweight Charts candlestick/line rendering with signal overlays (Price Charts, signal detail).
- SignalGridWidget — the paginated signal table (offset pagination + async item iterator).
- StatusWidget — live workload status tiles.
- SuccessRateWidget / SpeedDonutWidget — donut gauges for win-rate and throughput.
- SingleValueWidget / IndicatorValueWidget — single-KPI and indicator-value cards.
- AveragingWidget — DCA-ladder / effective-price visualization.
- PartialWidget — partial-close breakdown.
- FileTreeWidget — the dump-explorer tree.
Shared chrome lives in components/common/: AppHeader, a Markdown renderer, the CodeEditor, NotificationView, Tooltip, IconPhoto, ErrorView, decorative Background / BottomImage. Providers (AlertProvider, ErrorProvider, LayoutModalProvider, StatusInfo, Translate) wrap the app for alerts, error boundaries, modal stacking, the status banner, and i18n.
The modal system — a window manager with navigation history
The dashboard is, at its core, a modal window manager. Two complementary mechanisms sit on top of react-declarative's useModalManager / useWizardModal, both of which keep their own navigation history so modals stack, go back, and close as a managed stack rather than ad-hoc dialogs.
1. Global modal registry — tabbed detail modals on a managed stack
One provider wraps the whole app and registers ~25 detail modals — one per signal-lifecycle event and commit type — each wired to a layoutService subject. Anywhere in the app, pushing to a subject (e.g. pickSignalSubject.next(signal)) pushes the matching modal onto the managed stack; because the stack tracks depth, opening a modal from inside another (e.g. clicking a related signal) stacks it, and the title-bar Back arrow pops you to the previous one. closeModalSubject / ctx.clear() tears the whole stack down centrally. The provider also hosts global prompt, alert, and document-download/preview (useOpenDocument) flows.
These are the modals that open when you click a notification card, a signal in a grid, or a risk event — every point in a position's life has a dedicated, fielded modal, each with the same Back / Print / Search / Copy / ActionMenu / Close title bar and the same StockChart candle tabs.
Each hook below is a pick* opener subscribed to its layoutService.pick*Subject; the hook renders a modal that displays the event's DTO through its assets/*_fields.tsx schema, inside the tabbed shell + <ActionMenu /> title bar described above:
| Hook | Opens a modal for |
|---|---|
| useSignalView | a generic signal (signal_fields) |
| useRiskView | a risk rejection (risk_fields) |
| useSignalOpenedView / useSignalClosedView / useSignalScheduledView / useSignalCancelledView | the four signal-notification kinds |
| useSignalNotifyView | an info notification |
| useSignalSyncOpenView / useSignalSyncCloseView | broker-sync open/close |
| useActivateScheduledView | a scheduled signal activating |
| useAverageBuyCommitView | a DCA-rung commit |
| useClosePendingView / useCancelScheduledView | close / cancel commits |
| usePartialProfitAvailableView / usePartialProfitCommitView | partial-profit available + committed |
| usePartialLossAvailableView / usePartialLossCommitView | partial-loss available + committed |
| useBreakevenAvailableView / useBreakevenCommitView | breakeven available + committed |
| useTrailingStopView / useTrailingTakeView | trailing stop / take |
| useDumpContentView | a dump-file preview |
These are the modals that open when you click a notification card, a signal in a grid, or a risk event — every point in a position's life has a dedicated, fielded modal, each with the same Back / Print / Search / Copy / ActionMenu / Close title bar.
2. Manual-control wizard modals (per-operation, own history)
The four operations on the Manual Control screen are multi-step wizards, each built with useWizardModal over a private createMemoryHistory() — so each modal has its own back/forward navigation through three routed steps.
Folders: useOpenPendingModal, useAverageBuyModal, useClosePendingModal, useBreakevenModal. Each contains useXModal.tsx (the useWizardModal config — title, fullscreen size request, close button, onSubmit → reload), routes.tsx (three IWizardModal routes), steps.ts (the stepper labels), view/{BriefView,FormView,SubmitView}.tsx, and components/StatusCard.tsx. The page (ControlView) subscribes to four emitters (commitOpenPendingEmitter, commitAverageBuyEmitter, commitClosePendingEmitter, commitBreakevenEmitter) and calls pickData() to launch the matching wizard.
The three steps (Open Position example):
- Brief — fetches and shows the symbol + current effective price (
controlViewService.getAveragePrice) with a "verify the symbol AND the price" warning.Next → /form,Closedismisses. - Form — collects direction (long/short), amount in USDT, and a note; live-computes coin quantity = amount ÷ price as a read-only field; warns that the position opens immediately.
Back → /brief,Next → /submit. - Submit — fires the commit (
controlViewService.commitOpenPending/commitAverageBuy/commitClosePending/commitBreakeven) and shows aStatusCardin loading → success / error state;Closefinalizes (beginSave) and the underlying record reloads.
Average Buy, Close Pending, and Breakeven follow the same Brief→Form→Submit shape with operation-specific form fields and StatusCard copy.
Field schemas (assets/*_fields.tsx) — every DTO rendered as a real form
The 24 files in assets/ are the declarative field schemas that drive both the detail pages and every modal above. Each exports a default TypedField[] array (react-declarative), so a DTO is shown with typed, labeled, validated, grouped fields — and, where useful, live widgets — instead of a raw JSON dump. Nothing in a signal's life is hidden from the operator.
dashboard_fields(→DashboardPage) — not a text form but a widget grid: revenue cards, donut, daily-trades chart, success-rate panel, signal grid (see PNL Performance above).signal_fields(→StatusViewdetail + print,useSignalView) andstatus_fields(→StatusView) — the full pending/closed signal record.risk_fields(→useRiskView),setup_fields(→ About/Setup view).- Lifecycle/commit schemas (each → its
use*Viewhook in the global registry):signal_opened_fields,signal_closed_fields,signal_scheduled_fields,signal_cancelled_fields,signal_notify_fields,signal_sync_open_fields,signal_sync_close_fields,activate_scheduled_fields,average_buy_commit_fields,close_pending_commit_fields,cancel_scheduled_commit_fields,breakeven_available_fields,breakeven_commit_fields,partial_profit_available_fields,partial_profit_commit_fields,partial_loss_available_fields,partial_loss_commit_fields,trailing_stop_fields,trailing_take_fields.
These are the largest source files in the package (most 27–37 KB) precisely because they describe every field of every lifecycle DTO — the schemas are the UI's knowledge of the engine's data model.