
@bull-board/cli
v9.10.1
Published
Run the bull-board dashboard against a Redis instance from the command line.

Maintainers
 felixmosh
Readme
@bull-board/cli
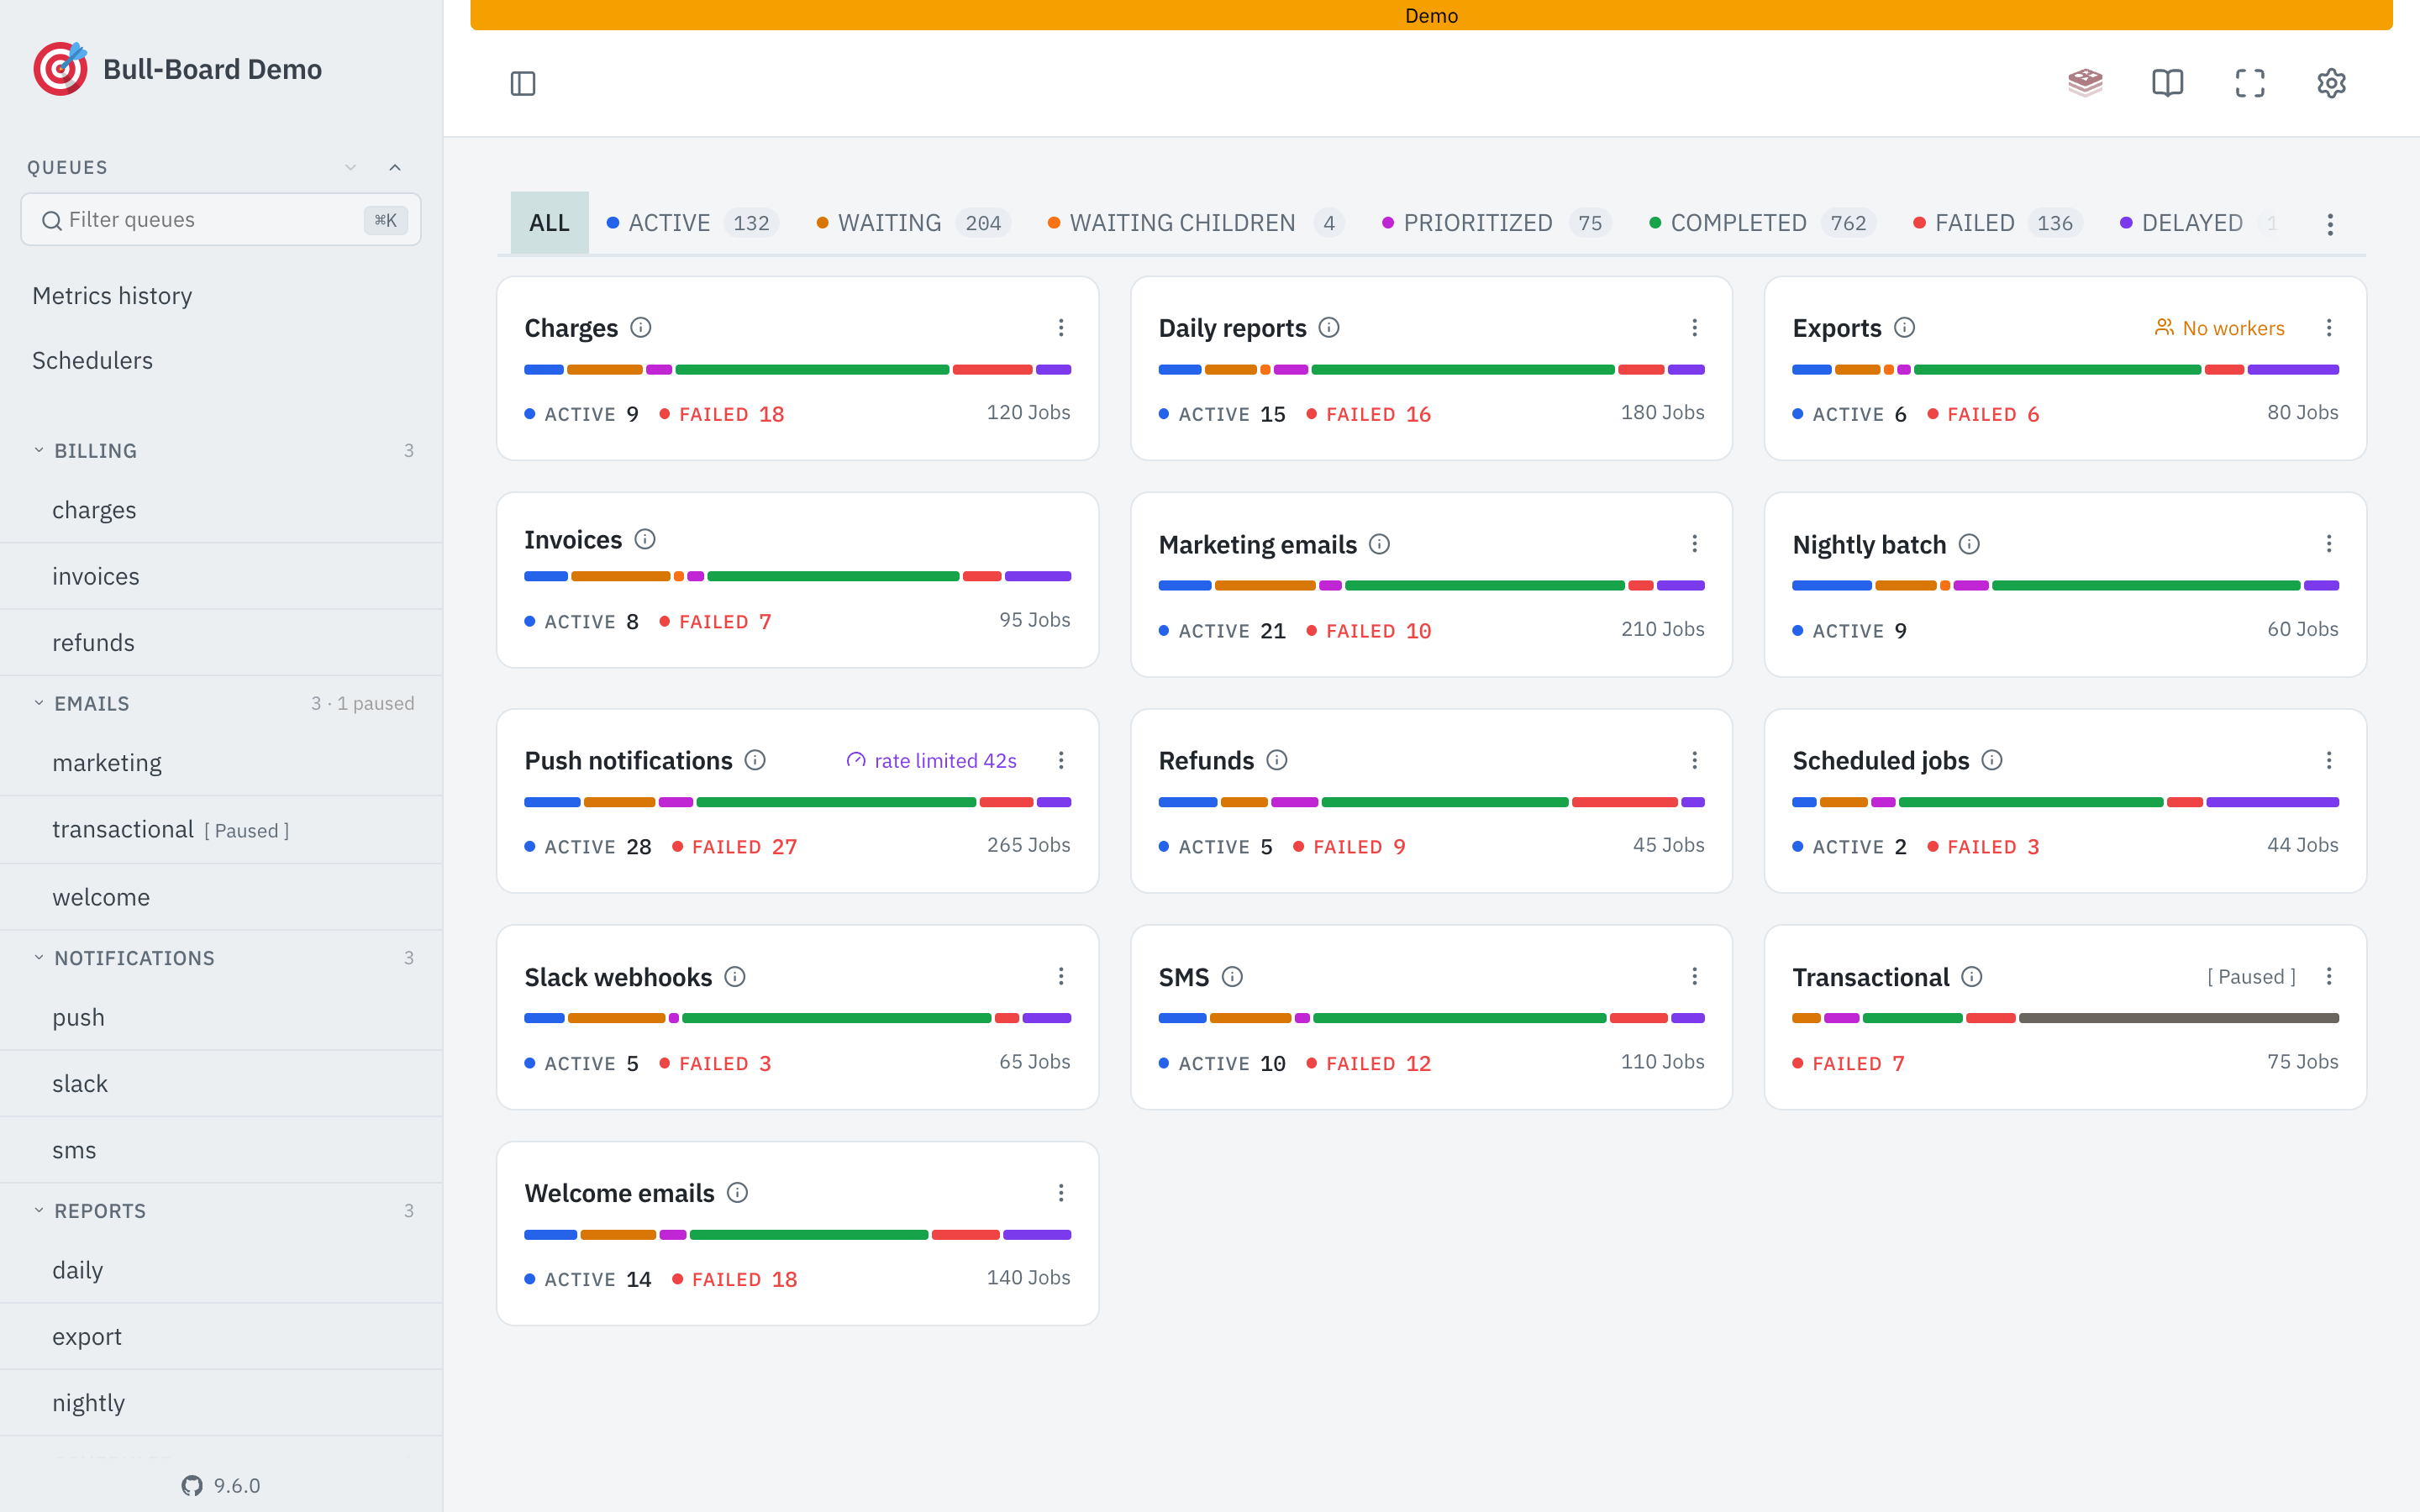
Run the bull-board dashboard against a Redis instance, no app to wire it into.
npx @bull-board/cli -r redis://localhost:6379That opens http://127.0.0.1:3000 with the dashboard for every Bull and BullMQ queue it finds under the bull key prefix.
When you'd reach for this
- The workers live in a repo or a container you are not editing, and you want to watch jobs move without adding a route to an app you would then have to remember to remove.
- Your producers are not Node. BullMQ has an official Python package and gets written to over the raw protocol from other languages. Those teams have no app to embed the dashboard into.
- You want to look at a queue on staging or production through a tunnel, without deploying anything.
- You are evaluating bull-board and would rather see your own queues than wire up an integration first.
This is not a replacement for mounting an adapter in your own server: there's no auto-login, no framework-level auth to inherit, and every option has to be passed on the command line, an env var, or a config file instead of code.
Options
Usage:
  bull-board [options]
  npx @bull-board/cli [options]

Options:
  -r, --redis <url>       Redis connection URL          [redis://localhost:6379]
      --sentinel <list>   Comma separated sentinel host:port list, port [26379]
      --sentinel-name <n> Redis master group name, required with --sentinel
      --sentinel-password <pass>
                          Password for the sentinel nodes themselves
      --redis-username <name>
                          Username for the Redis nodes behind the sentinels
      --redis-password <pass>
                          Password for the Redis nodes behind the sentinels
      --redis-db <n>      Database to select behind the sentinels
  -p, --port <port>       Port to listen on             [3000]
      --host <address>    Interface to bind             [127.0.0.1]
      --prefix <list>     Comma separated key prefixes  [bull]
      --queues <list>     Use these queue names instead of discovering
      --scan-interval <s> Seconds between rescans, 0 to scan once  [10]
      --base-path <path>  Serve the dashboard under a path prefix
      --read-only         Disable every destructive action
      --user <name>       Basic auth user (requires --password)
      --password <pass>   Basic auth password (requires --user)
      --board-title <s>   Dashboard title
      --history           Record and serve long-retention metrics history
      --history-retention-days <n>
                          Days of history to keep            [90]
      --config <file>     Path to a config file
      --browser <command> Command to open the browser with     [$BROWSER]
      --no-open           Do not open a browser
      --no-retry          Exit if Redis is unreachable instead of retrying
  -h, --help              Show this help
  -v, --version           Show the version
Every flag also has an environment variable equivalent (BULL_BOARD_REDIS_URL, BULL_BOARD_PORT, BULL_BOARD_READ_ONLY, and so on), and a bull-board.config.{mjs,js,cjs,json} file for anything that doesn't fit on a command line. Flags win over environment variables, which win over the config file, which wins over the built-in default.
If Redis is unreachable when the CLI starts, it still opens: it serves a diagnostic page explaining why (the URL it dialled, the underlying error, and the likely causes), keeps retrying every 3 seconds, and switches to the real dashboard on its own the moment Redis answers, no restart needed. That only covers startup, though: once the dashboard is live it stays live, even if Redis later goes away. The diagnostic page does not come back; API requests just stop returning until Redis is reachable again, and Ctrl-C still works. Pass --no-retry for the old behaviour instead: print the error and exit 1 immediately, without ever opening a port, which is what a script or CI checking the exit code wants.
// bull-board.config.js
module.exports = {
  redis: 'redis://localhost:6379',
  prefix: ['bull', 'tenant-a'],
  uiConfig: {
    boardTitle: 'Ops Dashboard',
  },
  queues: {
    'payment-webhooks': { readOnlyMode: true },
  },
};
Redis Sentinel
--sentinel connects through Redis Sentinel rather than to one instance directly, for a deployment where the master address is not fixed:
npx @bull-board/cli --sentinel s1.internal:26379,s2.internal:26379 --sentinel-name mymasterA port is optional per entry and defaults to 26379. --sentinel-name is the master group name from your sentinel configuration and is required. --sentinel and --redis are mutually exclusive, and passing both is an error rather than a silent preference for one.
ioredis resolves the current master through the sentinels listed and follows a failover on its own, so the whole dashboard moves with it: queue reads, the Bull subscriber, and --history recording all share the one connection.
Credentials in sentinel mode come from their own flags, since there is no URL to carry them. --redis-username, --redis-password and --redis-db apply to the Redis nodes behind the sentinels, while --sentinel-password authenticates to the sentinel nodes themselves, which commonly have a different password. Passing any of them alongside a Redis URL is an error, because ioredis would take the URL's own credentials and ignore them.
For anything beyond that, including TLS to the sentinel nodes, the config file's redis key accepts a full ioredis options object and is passed through untouched:
// bull-board.config.js
module.exports = {
  redis: {
    sentinels: [
      { host: 's1.internal', port: 26379 },
      { host: 's2.internal', port: 26379 },
    ],
    name: 'mymaster',
    sentinelPassword: process.env.SENTINEL_PASSWORD,
    enableTLSForSentinelMode: true,
  },
};
Historical metrics
--history turns on the long-retention metrics that otherwise need @bull-board/metrics wired into an app of your own:
npx @bull-board/cli -r redis://localhost:6379 --historyEvery queue chart gains a 60m / 7d / 30d / 90d range selector, and a cross-queue Metrics history page shows up in the sidebar. The CLI process does the recording itself, copying throughput, wait time, run time and queue age into Redis once a minute under the bull-board:metrics: namespace, never over a key Bull or BullMQ owns. Recording follows discovery, so a queue that appears between rescans is picked up on the next tick.
--history-retention-days sets the window, 90 days by default. Per-tier retention, the snapshot interval and latency: false go in the config file under a history key. --read-only keeps the reading and stops the writing, for a board that only displays what another process records.
Completed and failed history comes out of BullMQ's own metrics buffer, so it stays empty unless your workers were built with metrics: { maxDataPoints: MetricsTime.ONE_WEEK }; the CLI warns at startup when no discovered queue has any. Latency and queue age need nothing from your workers. See the historical metrics recipe for storage sizing and what the charts show.
Docker
docker run --rm -p 127.0.0.1:3000:3000 \
  -e BULL_BOARD_USER=admin -e BULL_BOARD_PASSWORD=secret \
  ghcr.io/felixmosh/bull-board --redis redis://host.docker.internal:6379
ghcr.io/felixmosh/bull-board is this package as an image, built for amd64 and arm64 on every release and tagged with the exact version, the major, and latest. The entrypoint is the CLI, so flags and BULL_BOARD_* variables work exactly as they do above. The only things the image decides for you are BULL_BOARD_HOST=0.0.0.0 and BULL_BOARD_OPEN=false, the two defaults that make no sense in a container, and you can override both. Run with Docker covers Compose, tags and mounting a config file.
Discovery only reads Redis, so BullMQ v6 queues backed by PostgreSQL aren't found here; use a server adapter in your own app for those. --prefix doesn't take wildcards either, list the prefixes you need explicitly.
See the CLI guide for the full flag and environment variable reference and the basic auth walkthrough.