
@camille-hdl/hill-chart
v0.2.0
Published
Draws a minimalist, hand-drawn hill chart, as in [Shape Up, chapter 13 “Show Progress”](https://basecamp.com/shapeup/3.4-chapter-13), from a JSON list of scopes, to SVG or PNG.


Readme
@camille-hdl/hill-chart
Draws a minimalist, hand-drawn hill chart, as in Shape Up, chapter 13 “Show Progress”, from a JSON list of scopes, to SVG or PNG.
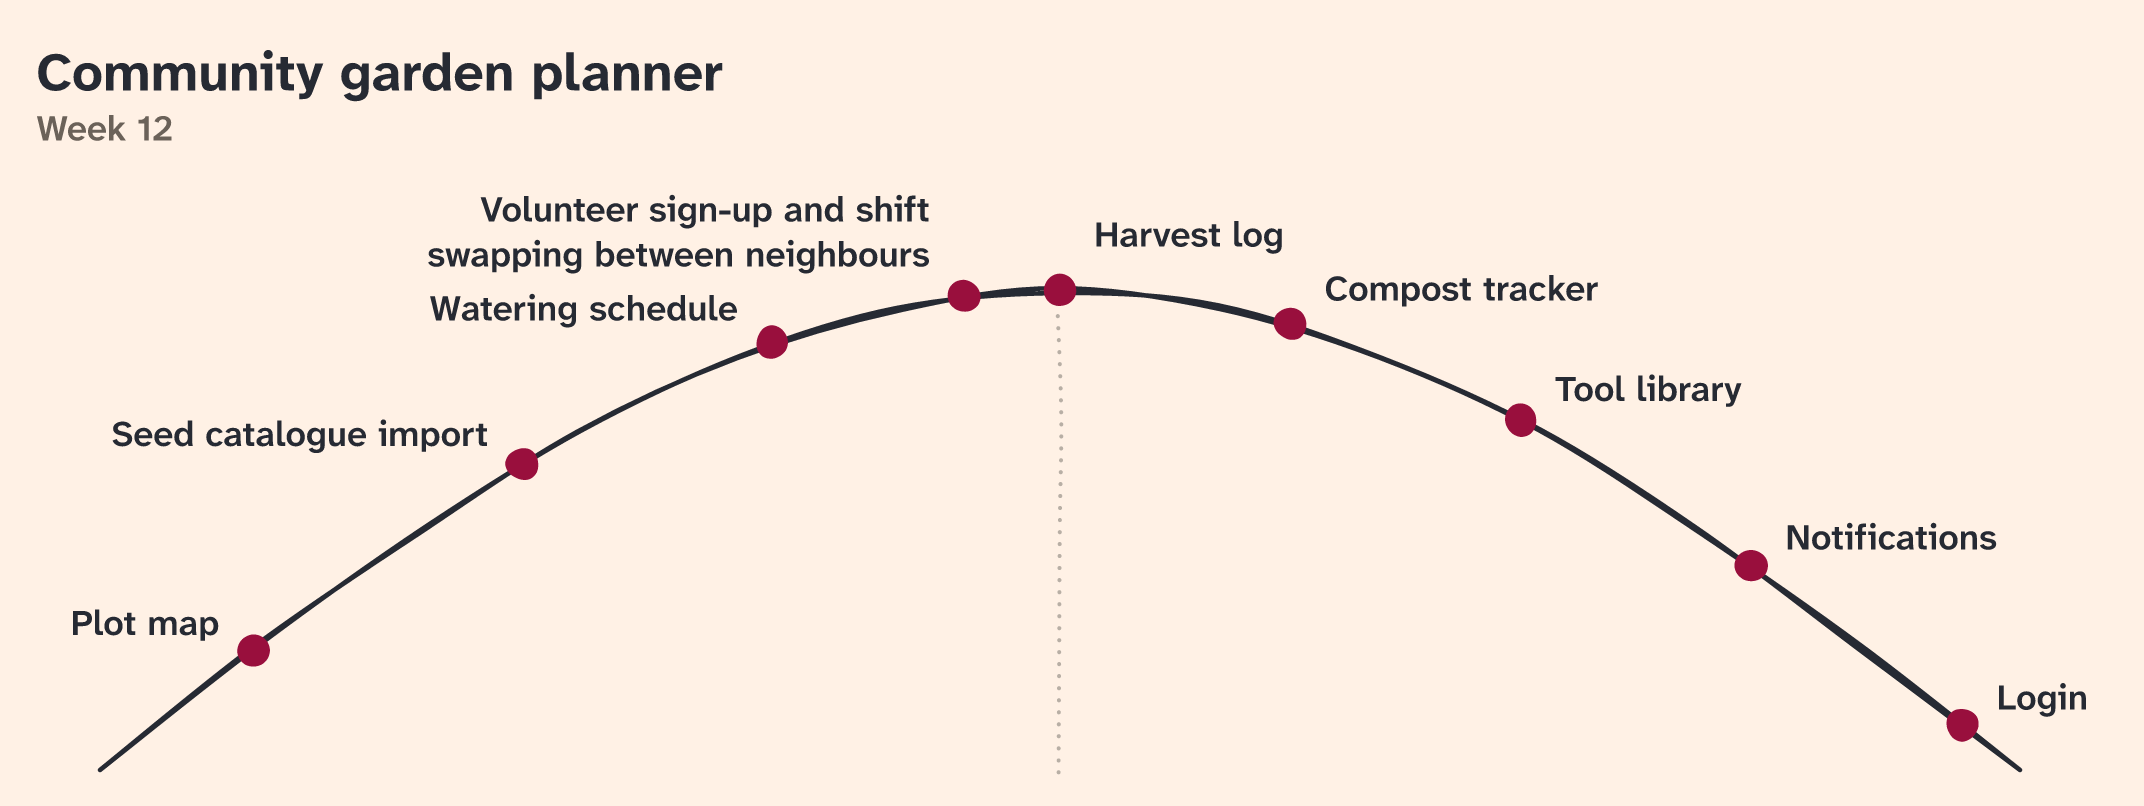
Quick start
Write your scopes to chart.json:
{
  "title": "Community garden planner",
  "subtitle": "Week 12",
  "scopes": [
    { "name": "Plot map", "position": 0.2 },
    { "name": "Watering schedule", "position": 0.5 },
    { "name": "Login", "position": 0.9 }
  ]
}
Then draw it:
npx @camille-hdl/hill-chart chart.json -o chart.pngData format
A scope's position is a judgment, not a percentage of tasks done. It runs from 0 (left foot) to 1 (finish):
- below 0.5, uphill: the team is still figuring out what to do;
- 0.5, the top: now it knows what to do;
- above 0.5, downhill: only execution is left.
The rules:
scopesis required. An empty array draws the hill alone.- A scope has only a
nameand aposition, a number from 0 to 1. - Names are unique within the chart. Two scopes may share a position.
titleandsubtitleare optional. No date is added: put it insubtitleif you want one.- A chart has at most 100 scopes, and a title, subtitle or name at most 200 characters, counted after whitespace is collapsed. The CLI reads at most 1 MiB of JSON from a file or stdin.
- A chart within these limits can still be too large for a PNG, for instance with many long names at the same position. A PNG over 50 megapixels fails with an error giving its width and height in pixels; render SVG instead.
Any other key is an error, and every error names its field:
hill-chart: chart.json: scopes[2].position: must be a number from 0 to 1, got 70CLI
npx @camille-hdl/hill-chart chart.json > chart.svg
npx @camille-hdl/hill-chart chart.json -o chart.png
cat chart.json | npx @camille-hdl/hill-chart --format png > chart.png
npx @camille-hdl/hill-chart chart.json -o chart.svg --theme theme.json
It exits 0 on success, 1 when the JSON, data or theme is at fault, and 2 on a usage error or a file it cannot read or
write. It refuses to write a PNG to a terminal: use -o or redirect. --help lists every option.
Installed in a project (npm install @camille-hdl/hill-chart), run it as npx hill-chart or from npm scripts.
Theme
A theme is a flat JSON object. Give only the keys you change; the others keep their default. For example, in
theme.json:
{ "background": "transparent", "dot": "#0f5499", "seed": 7 }npx @camille-hdl/hill-chart chart.json -o chart.png --theme theme.jsonColors are #rgb or #rrggbb.
| Key | Default | Sets |
| --- | --- | --- |
| background | "#fff1e5" | the background; "transparent" draws none |
| ink | "#262a33" | the hill, names and title |
| muted | "#6b6259" | the subtitle and leader lines |
| dot | "#990f3d" | the dots |
| axis | "#b8afa5" | the axis, a dotted line at the top |
| fontSize | 18 | the size of names and subtitle, from 6 to 96; the title is 1.5× |
| width | 960 | the width of the hill, foot to finish, from 200 to 4000 |
| seed | 1 | the hand-drawn wobble, an integer from 0 to 4294967295 |
widthis the hill's width, not the image's: the image grows around the hill to fit the names, so the spacing of your dots never depends on how long their names are.seedpicks one hand-drawn look among many. Try a few, keep the one you like.
The defaults ship in the package, to copy and edit: node_modules/@camille-hdl/hill-chart/default-theme.json.
API
npm install @camille-hdl/hill-chartimport { writeFile } from "node:fs/promises";
import { HillChartError, renderPng, renderSvg } from "@camille-hdl/hill-chart";
const chart = {
title: "Community garden planner",
scopes: [
{ name: "Plot map", position: 0.08 },
{ name: "Tool library", position: 0.74 },
],
};
const svg = renderSvg(chart); // a string
await writeFile("chart.svg", svg);
await writeFile("chart.png", await renderPng(chart, { seed: 7 })); // a Uint8Array
try {
renderSvg({ scopes: [{ name: "Login", position: 70 }] });
} catch (error) {
if (!(error instanceof HillChartError)) throw error;
console.error(error.field); // scopes[0].position
}renderSvg(chart, theme?)returns a string;renderPng(chart, theme?), aPromise<Uint8Array>.- Both validate their input and throw a
HillChartError, whosefieldis the path at fault. - They do not read files: the CLI's 1 MiB input limit is not theirs. A service that renders untrusted JSON sets its own limit on the size it reads, before parsing.
- The package is ESM only, and exports the
HillChart,ScopeandThemetypes.
Determinism
The same data and theme always give the same image, byte for byte. Adding, removing or reordering scopes leaves the hill and every other dot drawn exactly the same, though names may shift to make room and the image's edges may grow.
Fonts
- PNG is drawn with the embedded font, Atkinson Hyperlegible Next,
and nothing else, so it looks the same on every machine. It covers Latin, including extended Latin such as “Łódź” or
“İstanbul”. Greek, Cyrillic, CJK, emoji and symbols such as ✓ are not covered: the PNG fails with an error naming the
field and the characters. Use SVG for those. A PNG over 50 megapixels (7,000 × 7,000 px) fails too, with field
(root); the image at the top stays under it even with the theme{ "width": 4000, "fontSize": 96 }. - SVG uses the viewer's fonts.
Requirements
- Node ≥ 22.14 to use the package.
- Node ≥ 22.18 to develop it: the tests run the TypeScript sources directly, without a build.
Development
npm install
npm test               # run the tests on the TypeScript sources
npm run test:update    # rewrite the SVG snapshots in test/snapshots/, then review them as images
npm run check          # format, lint and type-check
npm run build-font     # regenerate the embedded font; needs the network and HarfBuzz
After a rendering change, redraw the example image above:
node src/bin.ts test/fixtures/sample.json -o docs/hill-chart.pngReleasing
npm version minor      # or patch, or major
git push --follow-tags
The tag's workflow runs three jobs. build checks the tag, runs the checks, packs the tarball and tries it;
publish, in the npm environment, publishes that tarball to npm with provenance, with none of the repository's code;
github-release creates the GitHub release.
License
The code is under 0BSD. The embedded font, Atkinson Hyperlegible Next, is under the SIL Open Font License 1.1.