
@collective-forecast/react-native-chart
v1.0.6
Published
High-performance interactive financial charts for React Native with Skia and Reanimated
Downloads
36
Maintainers
 collectiveforecast
Readme
@collective-forecast/react-native-chart
Interactive, high-performance React Native financial chart built with Skia, Reanimated, and Gesture Handler.
Supports:
- line and candlestick charts
- pinch/drag gestures
- crosshair + tooltip
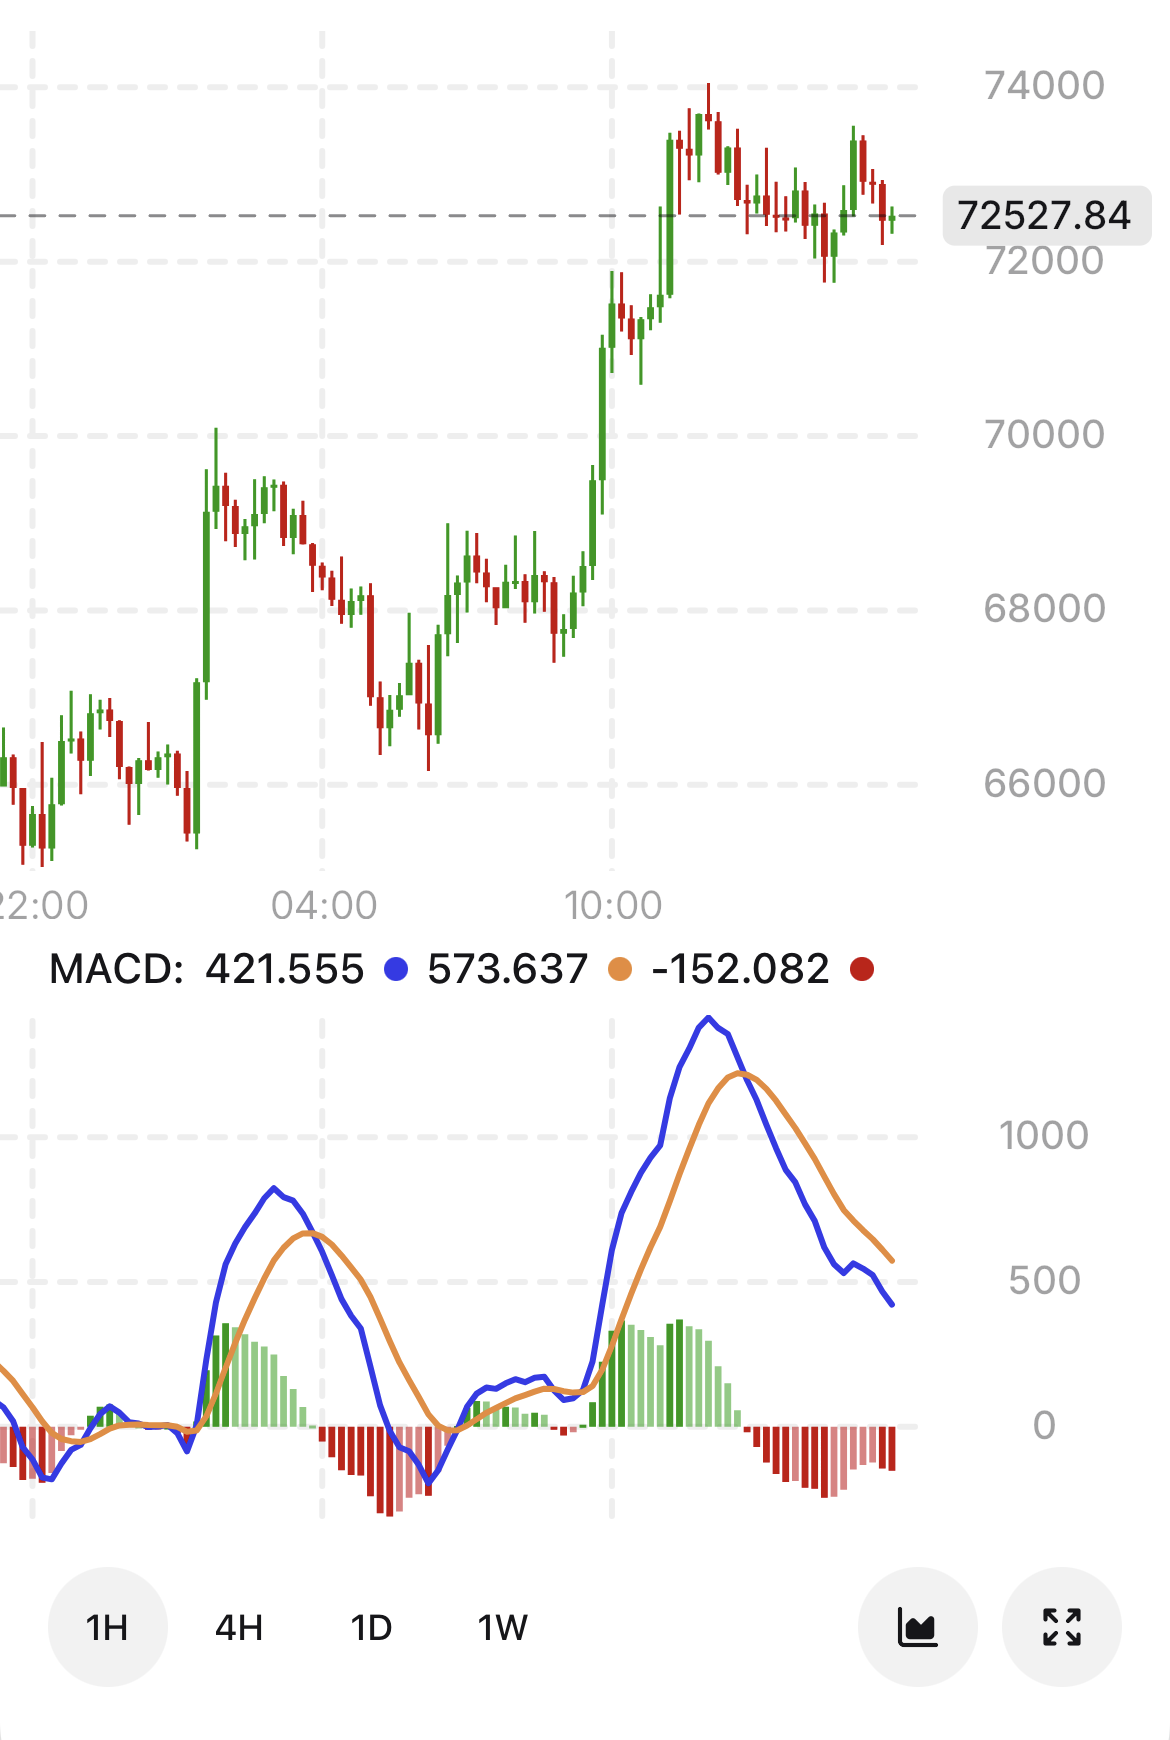
- optional indicator pane (default or MACD-style)
- Fibonacci levels and divergence overlays
Installation
npm i @collective-forecast/react-native-chartInstall peer dependencies (if not already in your app):
npm i @shopify/react-native-skia react-native-reanimated react-native-gesture-handler react-native-svg react-native-workletsExample
React Native setup
This package relies on native libraries. Make sure your app is configured for:
react-native-reanimated(Babel plugin enabled)react-native-gesture-handler@shopify/react-native-skia
For iOS, run:
npx pod-installUsage
import React from "react";
import { View } from "react-native";
import { useFont } from "@shopify/react-native-skia";
import {
  Chart,
  type Kline,
  type IndicatorData,
} from "@cofo/react-native-chart";

const data: Kline[] = [
  {
    timestamp: 1700000000000,
    open: 100,
    high: 108,
    low: 98,
    close: 105,
    value: 105,
    volume: 1200,
  },
  {
    timestamp: 1700003600000,
    open: 105,
    high: 110,
    low: 103,
    close: 109,
    value: 109,
    volume: 900,
  },
];

const indicatorData: IndicatorData = [
  [
    { timestamp: 1700000000000, value: 48 },
    { timestamp: 1700003600000, value: 52 },
  ],
];

export function ChartExample() {
  const fontRegular = useFont(require("./assets/Inter-Regular.ttf"), 11);
  const fontMedium = useFont(require("./assets/Inter-Medium.ttf"), 11);

  if (!fontRegular || !fontMedium) return null;

  return (
    <View
      style={{ flex: 1, justifyContent: "center", backgroundColor: "#fff" }}
    >
      <Chart
        data={data}
        width={360}
        height={260}
        fontRegular={fontRegular}
        fontMedium={fontMedium}
        chartType="candlestick"
        indicatorData={indicatorData}
        indicatorHeight={120}
      />
    </View>
  );
}
Data types
Kline
type Kline = {
  low: number;
  high: number;
  open: number;
  close: number;
  value: number;
  volume: number;
  timestamp: number;
};
IndicatorData
IndicatorData is an array of series: IndicatorSeries[], where each series is an array of { timestamp, value } points.
indicatorVariant="default": use 1..3 line series.indicatorVariant="macd": pass[macdLine, signalLine, histogram].
Props (Chart)
Required:
data: Kline[]width: numberheight: numberfontRegular: SkFontfontMedium: SkFont
Common optional:
chartType?: "line" | "candlestick"(default:"line")onLoadMore?: (firstItemTimestamp: number) => voidindicatorData?: IndicatorDataindicatorVariant?: "default" | "macd"(default:"default")indicatorHeight?: numberindicatorShowGradient?: booleanindicatorContainerPadding?: numberindicatorFixedMin?: numberindicatorFixedMax?: numberindicatorTopEmptySpace?: numberdisableYAxisPan?: booleanfibonacciLevels?: FibLevelDatadivers?: Diver[]additionalContent?: ReactNodeextraContainerStyle?: StyleProp<ViewStyle>colors?: IColorsConfig
Colors
colors accepts IColorsConfig with keys:
bg,text,stroke,gridindicator,indicatorslinemacdPositiveHistogram,macdNegativeHistogrambullishDiver,bearishDiverbullCandle,bearCandle
Build
npm run buildTypecheck
npm run typecheckLicense
ISC