
@ddd-ts-kit/pino
v0.17.0
Published
Adapter of the kernel Logger port on pino, with trace and execution correlation on every line.


Readme
English · Français
@ddd-ts-kit/pino
The kernel Logger port on pino: JSON lines on the standard output, the
correlation fields of the work in progress on every line, credentials redacted, a flush for the
shutdown. Nothing in domain/ or application/ imports this package, or logs anything: the
composition root binds the adapter, and infrastructure, presentation and the aspects write
through the port.
npm i @ddd-ts-kit/pino pino
npm i -D pino-pretty        # only for the pretty format
Written against pino 10. pino-pretty 13 is an optional peer: it is loaded only when the
pretty format is asked for.
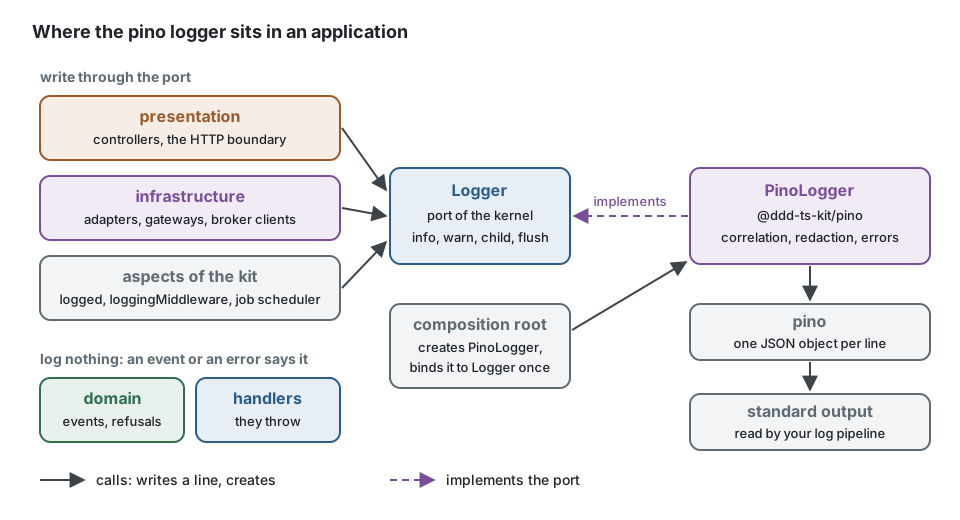
The domain and the handlers say what happened with events and errors, never with a log line.
What writes is around them: the adapters of infrastructure/, the controllers of
presentation/, and the aspects (logged, loggingMiddleware, the job scheduler). They all
receive the kernel Logger; the composition root binds PinoLogger to it once. Replacing pino
later changes that one binding, never a call site.
Composition root
// platform/observability/create-logger.ts
import type { ExecutionScope, LogLevel } from '@ddd-ts-kit/kernel';
import { createPinoLogger, type PinoLogger } from '@ddd-ts-kit/pino';
import { traceLogFields } from '@ddd-ts-kit/tracing';

export interface LogSettings {
  readonly level: LogLevel; // LOG_LEVEL
  readonly format: 'json' | 'pretty'; // LOG_FORMAT
  readonly service: string;
  readonly environment: string;
  readonly scrubMessages: boolean; // LOG_SCRUB_MESSAGES
}

export function createLogger(scope: ExecutionScope, settings: LogSettings): PinoLogger {
  return createPinoLogger({ ...settings, fields: () => traceLogFields(scope) });
}
// main.ts
import { tracing } from '@/platform/tracing'; // first
import { createLogger } from '@/platform/observability/create-logger';
import { AsyncLocalStorageExecutionScope } from '@ddd-ts-kit/kernel';
import { createApplication, kernelModule } from '@ddd-ts-kit/di';
const scope = new AsyncLocalStorageExecutionScope();
const logger = createLogger(scope, config.log);
const app = createApplication({
modules: [kernelModule({ executionScope: scope, logger }), ...contexts],
});
process.once('SIGTERM', () => void shutdown());
async function shutdown(): Promise<void> {
await app.stop(); // flushes the error reporter, then the logger, last
await tracing.shutdown();
}init --logger pino writes this create-logger.ts (it answers a NoopLogger when given no
settings, which is how the tools and the tests stay silent); platform/lay-foundations.ts
calls it once and composeApplication hands the logger to kernelModule({ logger }).
One line of the application, as it is written:
{"level":"info","time":"2026-03-01T10:00:00.000Z","service":"shop-api","environment":"production","correlationId":"9f2c","origin":"http","actorId":"user-1","tenantId":"acme","trace_id":"4bf92f3577b34da6a3ce929d0e0e4736","span_id":"00f067aa0ba902b7","context":"shipping","message":"order shipped"}![The path of one call to logger.info: below the threshold it stops after one comparison; otherwise the adapter describes the errors among the fields and drops the level and time keys; pino writes the header, then service, environment and base, the fields of the children, what fields() answers and the fields of the line; it replaces the value of every credential key by [redacted]; then it hands the JSON line to its destination, at once on the standard output, through a 4 KiB buffer with asynchronous, or to the pino-pretty worker](https://raw.githubusercontent.com/gbourgeat/ddd-ts-kit/main/docs/assets/diagrams/pino-path-of-a-line.svg)
Correlation. fields is read at each line that is written, through the pino mixin: no
call site passes an id. traceLogFields(scope) answers the trace and span ids inside a span,
and inside the execution scope the correlation id, the causation id, the origin, the actor and
the tenant. This package does not depend on the tracing package: any () => LogFields fits,
() => logFieldsOf(scope.current()) included. A function that throws gives no field, never a
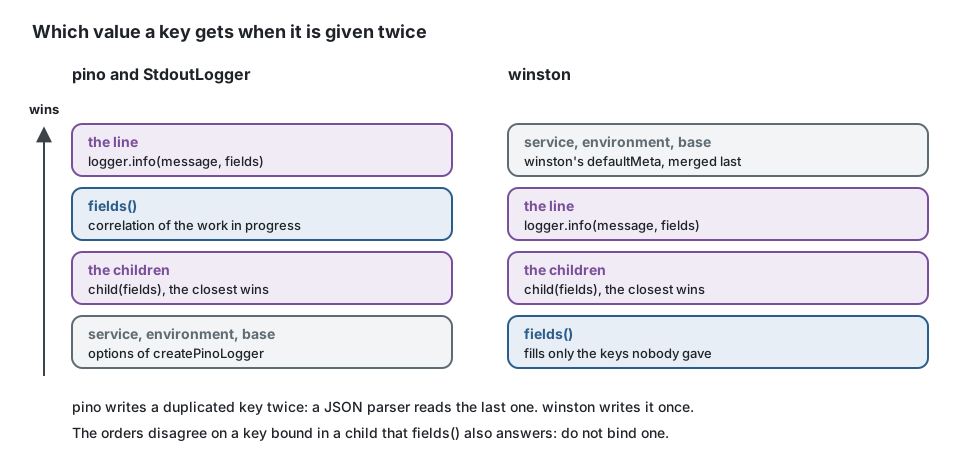
lost line. The fields of the line win over fields, which win over those of a child: pino
writes the bindings of a child first and what the mixin answers after them, so a key given
by both is written twice and a JSON parser reads the one of fields. StdoutLogger orders
them the same way; @ddd-ts-kit/winston does not (there a child wins over fields). Do not
bind in a child a key that fields answers.
An instance of your own. The project that already configures pino keeps doing so, and takes the pieces it wants:
import { CREDENTIAL_KEYS, type ExecutionScope } from '@ddd-ts-kit/kernel';
import { pino } from 'pino';
import { PinoLogger, correlationMixin, credentialRedaction } from '@ddd-ts-kit/pino';
import { traceLogFields } from '@ddd-ts-kit/tracing';

declare const scope: ExecutionScope; // the one the composition root creates

const instance = pino({
  mixin: correlationMixin(() => traceLogFields(scope)),
  redact: credentialRedaction([...CREDENTIAL_KEYS, 'iban']),
});

export const logger = new PinoLogger(instance);
createPinoLogger writes level by its name and the message under message, like the
StdoutLogger of the aspects package and like @ddd-ts-kit/winston: one dashboard reads the
three. An instance of your own keeps the keys you gave it (msg and a numeric level by default).
Logging from an adapter
An adapter receives the Logger of the kernel in its constructor, like any other port, and
never imports this package. Bind once, in a child, what every line of the adapter carries; put
on each line what changes from one call to the next. The correlation fields are already there:
fields adds them.
// infrastructure/carrier/carrier-gateway.ts
import type { Logger } from '@ddd-ts-kit/kernel';

interface Carrier {
  readonly name: string;
  book(orderId: string, weightGrams: number): Promise<string>; // the tracking number
}

export class CarrierGateway {
  private readonly logger: Logger;

  constructor(
    private readonly preferred: Carrier,
    private readonly fallback: Carrier,
    logger: Logger,
  ) {
    this.logger = logger.child({ context: 'shipping' }); // on every line of this adapter
  }

  async book(orderId: string, weightGrams: number): Promise<string> {
    try {
      return await this.preferred.book(orderId, weightGrams);
    } catch (error) {
      // Handled here, not rethrown: worth a line, with the error described by the logger.
      this.logger.warn('carrier unavailable, booking with the fallback', {
        orderId,
        carrier: this.preferred.name,
        error: error instanceof Error ? error : String(error),
      });

      return this.fallback.book(orderId, weightGrams);
    }
  }
}
The message is a constant and the identifiers are fields: a dashboard counts the lines by message, a search finds an order by its field, and no personal data slips into the text.
import type { Logger } from '@ddd-ts-kit/kernel';

declare const logger: Logger;
declare const order: { readonly id: string; readonly customerEmail: string; readonly lines: readonly unknown[] };

// Instead of: one distinct message per order, an email in clear text, a search that cannot filter.
logger.info(`order ${order.id} shipped to ${order.customerEmail}`);

// Write: the same message every time, identifiers as fields, nothing personal.
logger.info('order shipped', { orderId: order.id });

// Fields that cost something to build are built only when the line is written.
if (logger.isLevelEnabled('debug')) {
  logger.debug('order shipped, detail', { orderId: order.id, lineCount: order.lines.length });
}
An error that the code lets go (it throws, or rethrows) is not logged on the way: the bus, the
route or the job reports it to the ErrorReporter once, and the aspects log its type and its
code. Log an error only where it is handled and stops, as the fallback above does.
Development mode
createPinoLogger({ level: 'debug', format: 'pretty', fields: () => traceLogFields(scope) });[10:00:00.000] INFO: order shipped
service: "shop-api"
correlationId: "9f2c"
context: "shipping"The pretty format is the transport pino documents for pino-pretty: it runs in a worker
thread, so it takes a file descriptor or a path as destination, not a stream, and flush()
waits for the worker. For pretty lines on a stream of your own, build the instance on
pino-pretty used as a stream, pino(options, pretty({ destination })), and wrap it in
new PinoLogger(instance). Keep it out of production: choose the format from configuration
(LOG_FORMAT=pretty in .env, json everywhere else).
Privacy
Log lines are where personal data leaks: they are written everywhere, read by everyone and kept
for long. Three things are done in the adapter, so that no call site has to remember them. The
list of credential keys, the description of an error and the two markers (CREDENTIAL_KEYS,
describeError, REDACTED, SCRUBBED_MESSAGE) are those of the kernel, shared by every
logger of the port.
Credentials are redacted by pino's own redact, in the fields of a line, of a child and of
fields alike. The value of these keys is replaced by [redacted], at the top of a line and
one level below (headers.authorization, body.password):
password, authorization, cookie, set-cookie, token, secret, apiKey, api_key,
access_token, refresh_token, accessToken, refreshToken, client_secret
redact: ['iban', 'ssn'] adds to the list. Names are matched exactly, case included, and
nothing is looked for deeper than one level: log the part you mean, not a whole request.
An error passed as a field (logger.error('payment failed', { error }): the LogValue of
the port admits an Error) is written as describeError of the kernel describes it, the same
from every logger of the port: its class as type, its code when
it is a DomainError, its message, its own stack, then its cause the same way, up to
eight deep. Each error of a chain is written once: pino's standard serializer of the err key
would fold every cause into the message and the stack of the first, so the adapter turns it off
for the lines that go through the port. Errors are looked for among the fields of the line, not
inside nested objects.
Messages of unexpected errors can be dropped. The message of an error is the first place
where personal data shows up: a driver quotes the row it refused. The default keeps it, because
a log line that says [message removed] costs every investigation. With one option only the
messages the project wrote itself survive, those of its DomainErrors; class, code, stack and
cause remain for the others, and the stack loses its first line, which repeats the message:
createPinoLogger({ scrubMessages: true }); // or new PinoLogger(instance, { scrubMessages: true })This is the scrubMessages every logger of the port takes (StdoutLogger, pino, winston,
InMemoryLogger) and the one of @ddd-ts-kit/sentry, with the same rule, the same
SCRUBBED_MESSAGE and the same trade-off: turn it on when the logs leave your hands or when no
operator should read that data there. What the message of a log line itself says stays yours:
write order shipped and put the identifiers in fields.
The kit itself never hands an error to a logger: the logged aspect, loggingMiddleware and
the job scheduler write errorType and errorCode only (identifyError of the kernel), never
a message, whatever scrubMessages says, and the error goes to the ErrorReporter. The
description above is for the error your own code chooses to log:
logger.error('payment failed', { error }).
Levels
| Port | pino | |
|---|---|---|
| debug | debug (20) | |
| info | info (30) | the default threshold |
| warn | warn (40) | |
| error | error (50) | |
The port has no trace and no fatal: nothing written through it uses them. A line below the
threshold costs one comparison: its fields are not read, and fields is not called. The
threshold of an instance changed while running (instance.level = 'debug') is followed by the
adapter and by its children. isLevelEnabled(level) answers that threshold: ask it before
building fields that cost.
child(fields) is a pino child: the fields are serialized once, when the child is created,
and cost nothing per line. A key bound twice (by a child and by its parent, by a child and by
fields, or by any of them and by the line) is written twice on the line, as pino does; a
JSON parser reads the last one, in this order: service, environment and base, the
children from the oldest to the closest, fields, the line. level and time are the
exception: a field of that name is dropped,
so that no field forges the header of a line.
Flush
flush(): Promise<void> resolves once what pino buffered was handed to its destination: the
worker of a transport, or the buffer of an asynchronous destination. It never rejects.
app.stop() calls it, last, after the modules stopped and the error reporter was flushed:
stopping logs too. Without the application of the di package, call it yourself at that place.
The port calls a flush once, at shutdown, and leaves what is logged afterwards unspecified.
Here the logger stays usable: a line logged after the flush is written like the others, and
with asynchronous: true it waits in the buffer for pino's exit hook.
Performance
By default every line is written to the standard output before the call returns. Nothing is ever lost, and a slow reader of the standard output slows the application down.
asynchronous: true buffers 4 KiB and writes off the hot path (pino.destination({ sync:
false })), which is what makes pino fast under load. The price is what a dead process had not
written yet. flush() writes the buffer, and so does pino's own exit hook on process.exit
and on an uncaught exception. A signal that ends the process with no handler (SIGKILL, the
out-of-memory killer, a SIGTERM nobody listens to) loses up to 4 KiB of the most recent
lines, the ones that would have explained it; so does an exit in the first instants, before
the destination is open. Keep the default unless logging shows up in a profile.
A line costs one object copy of its fields (errors described, header keys dropped), then pino:
about 3 microseconds in all where @ddd-ts-kit/winston takes 7 (Node 24, a child, four
correlation fields, three fields, a sink that discards).
Redaction is compiled by pino: a lookup per credential key at the top of the line, and one
wildcard pass for the level below, whose censor looks at the name of each key. A wildcard path
per key would be the obvious way to write it and costs ten times more: measured on pino 10,
thirteen of them take a line from about one microsecond to about nine. Log calls never throw: fields that cannot be read or serialized
(a getter that throws) give the line without them, marked logError: "unserializable fields".
Which one
Take StdoutLogger of the aspects package when JSON lines on the standard output are all you
need: no dependency, the same line shape. Take pino when logging volume matters, when the
framework already speaks pino (Fastify), or when you want its transports. Take
@ddd-ts-kit/winston when the team already runs winston transports and formats. The three
implement one port and are held by one contract suite: swapping is one line of the composition
root.
NestJS
Nest has its own LoggerService, used by the framework for its own messages and by
new Logger(context) in Nest classes. Application code of the kit never needs it: handlers and
adapters receive the kernel Logger. To send what Nest itself logs through the same instance,
hand it a bridge of a few lines; the kit ships none, since it would bind this package to Nest:
const nest = logger.child({ context: 'nest' });
const bridge: LoggerService = {
  log: (message: unknown) => nest.info(String(message)),
  warn: (message: unknown) => nest.warn(String(message)),
  error: (message: unknown) => nest.error(String(message)),
  debug: (message: unknown) => nest.debug(String(message)),
};

const app = await NestFactory.create(AppModule, { logger: bridge });
nestjs-pino is the alternative when Nest classes log a lot: give it the pino instance you
built, and wrap the same instance in new PinoLogger(instance) for the kit.
In a test
Nothing of this package: the test application binds InMemoryLogger of the kernel, and its
entries are data. To hold another adapter of the port to the same behaviour, run the contract:
import { beforeEach, describe, expect, it } from 'vitest';
import { LOG_LEVELS } from '@ddd-ts-kit/kernel';
import { createPinoLogger } from '@ddd-ts-kit/pino';
import { loggerContract, type LoggedLine } from '@ddd-ts-kit/testing/contracts';

loggerContract({ describe, it, expect, beforeEach }, {
  name: 'PinoLogger',
  createLogger: (setup) => { // { level, fields, scrubMessages }
    const written: string[] = [];
    const logger = createPinoLogger({ ...setup, destination: { write: (line) => written.push(line) } });

    return { logger, lines: () => written.map((line) => lineOf(JSON.parse(line))) };
  },
});

/** A written line as the contract reads it: the level by its name, the message, the other fields. */
function lineOf({ level, message, time: _time, ...fields }: Record<string, unknown>): LoggedLine {
  const known = LOG_LEVELS.find((one) => one === level);

  if (known === undefined) {
    throw new Error(`Not a level of the port: ${String(level)}`);
  }

  return { level: known, message: String(message), fields };
}