
@ddd-ts-kit/tracing
v0.19.0
Published
Non-invasive OpenTelemetry tracing: adapters are wrapped at the composition root, the domain never knows.

Maintainers
 gbourgeat
Readme
English · Français
@ddd-ts-kit/tracing
OpenTelemetry tracing that the domain never sees. Nothing in domain/ or application/ imports
this package: use cases, adapters, events and jobs are wrapped where they are wired, in the
composition root, and one user action reads as one trace.
npm i @ddd-ts-kit/tracing @opentelemetry/api
# for the Node bootstrap (@ddd-ts-kit/tracing/node)
npm i @opentelemetry/sdk-node @opentelemetry/auto-instrumentations-node @opentelemetry/exporter-trace-otlp-http
# for the test harness (@ddd-ts-kit/tracing/testing)
npm i -D @opentelemetry/sdk-trace-base @opentelemetry/context-async-hooks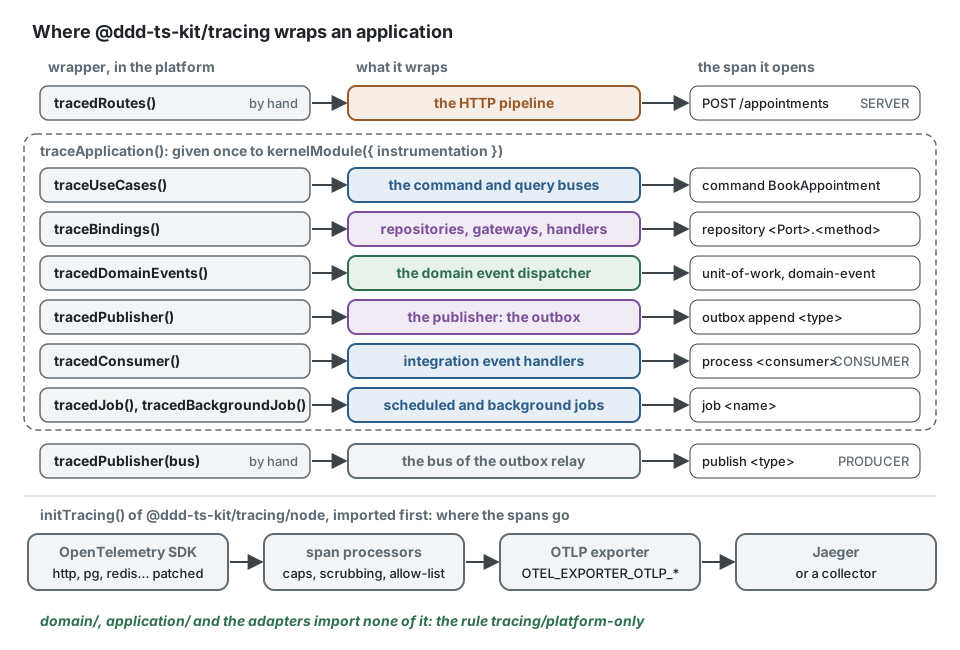
Every span of a trace is opened by one of these few places, all of them in the platform. The
domain, the application and the adapters of a context stay plain classes, which the rule
tracing/platform-only holds: an import of @ddd-ts-kit/tracing or of @opentelemetry/*
anywhere else under the source root is reported. Instead of opening a span in an adapter:
// src/contexts/billing/infrastructure/external/stripe-payment.gateway.ts
import { trace } from '@opentelemetry/api'; // reported by tracing/platform-only

export class StripePaymentGateway implements PaymentGateway {
  async charge(invoiceId: string): Promise<void> {
    await trace.getTracer('billing').startActiveSpan('charge', () => this.client.charge(invoiceId));
  }
}
write the adapter alone, and bind it with its kind: the instrumentation of the kernel module
wraps it, and every call is an external PaymentGateway.charge span with the same attributes
as every other adapter.
export class StripePaymentGateway implements PaymentGateway {
  async charge(invoiceId: string): Promise<void> {
    await this.client.charge(invoiceId);
  }
}

// the module of the context, explicit style; the declared style writes
// @Adapter(PaymentGateway, { kind: 'external' }) on the class instead
builder.bind(PaymentGateway).toClass(StripePaymentGateway, [StripeClient]).as('external');
Setup
// platform/tracing.ts: imported before everything else
import { initTracing } from '@ddd-ts-kit/tracing/node';

export const tracing = initTracing({ serviceName: 'clinic-api' });
// main.ts
import { tracing } from '@/platform/tracing'; // first import, see "Load order"
import { createApplication, kernelModule } from '@ddd-ts-kit/di';
import { traceApplication, tracedPublisher, tracedRoutes } from '@ddd-ts-kit/tracing';
const app = createApplication({
modules: [kernelModule({ instrumentation: traceApplication(), eventPublisher: outbox }), schedulingModule, notificationModule],
});
mountExpress(server, routes, { executionScope: app.resolve(ExecutionScope), around: tracedRoutes() });
new OutboxRelay({ store, publisher: tracedPublisher(bus), clock }).start({ intervalMs: 1_000 });
await app.start();
process.on('SIGTERM', () => void app.stop().then(() => tracing.shutdown()));That is all: traceApplication() is the value kernelModule wraps the application with, and
no class knows about it. Three places stay outside of the kernel module and take one wrapper
each: the HTTP pipeline (around: tracedRoutes()), the publisher an outbox relay sends with
(tracedPublisher(bus)), and a project that builds its own tracer provider (see "Span
processors").
Jaeger, in five lines
Jaeger v2 receives OTLP natively, so there is nothing between the application and Jaeger:
services:
  jaeger:
    image: jaegertracing/jaeger:2.22.0
    profiles: [observability]
    ports: ['127.0.0.1:16686:16686', '127.0.0.1:4318:4318']
docker compose --profile observability up -d jaeger
OTEL_EXPORTER_OTLP_ENDPOINT=http://127.0.0.1:4318 node dist/main.jsinitTracing({ serviceName }) needs nothing else: the endpoint comes from the standard
OTEL_EXPORTER_OTLP_ENDPOINT (or OTEL_EXPORTER_OTLP_TRACES_ENDPOINT) variable, and without
either nothing is exported. Open http://127.0.0.1:16686 and search the service.
Load order
Auto-instrumentation patches http and the database drivers when they are loaded, so
initTracing must have run before. In an ES module the static imports are evaluated before the
first statement of the file: keep the call in its own module and import that module first (as
above), or preload it with node --import ./dist/platform/tracing.js. Packages published as ES
modules also need the @opentelemetry/instrumentation loader hook.
What a trace looks like
One request that books an appointment, announces it to two other bounded contexts through the outbox, and is published by the relay a moment later, from a timer and outside of any request:
POST /appointments                                        SERVER    scheduling
  command BookAppointment                                 INTERNAL
    repository AppointmentRepository.findOverlapping      INTERNAL
    repository AppointmentRepository.save                 INTERNAL
    unit-of-work before-commit                            INTERNAL  after every save, before the commit
      domain-event scheduling.appointment.booked          INTERNAL
        handler AppointmentBookedPublisher                INTERNAL
          outbox append scheduling.appointment.booked     INTERNAL  (the response is sent once this is committed)
            publish scheduling.appointment.booked         PRODUCER  by the relay, later, same trace
              process notification.appointment-booked     CONSUMER  notification
                command SendBookingConfirmation           INTERNAL
                  external MailGateway.send               INTERNAL
              process analytics.appointment-booked        CONSUMER  analytics
                command RecordBooking                     INTERNAL
                  repository BookingRepository.save       INTERNAL
This is the tree as produced, asserted span for span by
test/scenarios/one-action-one-trace.spec.ts and, against a real Jaeger, by
test/jaeger/real-jaeger.spec.ts. A scheduled job is a trace of its own:
job scheduling.send-reminders                             INTERNAL  (root)
  command SendReminders                                   INTERNAL
    repository AppointmentRepository.findOverlapping      INTERNAL
The phases of a unit of work
The handlers of domain events are not under the save that recorded the event: the unit of work dispatches them once the command handler has returned. Under the span of the command, in order:
command SendParcels                                       INTERNAL
  repository ParcelRepository.save                        INTERNAL
  repository ParcelRepository.save                        INTERNAL
  unit-of-work before-commit                              INTERNAL  the events of both saves
    domain-event shipping.parcel.sent                     INTERNAL
      repository ParcelRepository.save                    INTERNAL  a handler saves another aggregate
    domain-event shipping.parcel.sent                     INTERNAL
  unit-of-work before-commit                              INTERNAL  what the handlers recorded in turn
    domain-event shipping.parcel.tracked                  INTERNAL
  unit-of-work after-commit                               INTERNAL  once committed, same trace
    domain-event shipping.parcel.sent                     INTERNAL
    domain-event shipping.parcel.sent                     INTERNAL
unit-of-work before-commitfollows the save spans. What the handlers recorded in turn is under a second span of the same name.unit-of-work after-commitis there when an event has a handler of that phase, and holds only those events. It is a child of the command span, and stays in the trace when its handler fails: the command span still sayssucceeded.- A handler declared with a kind (
@DomainEventHandler) is ahandler <ClassName>span under itsdomain-eventspan; a callback attached withdispatcher.onhas none. - Outside any unit of work (a repository called alone) the
domain-eventspans stay under the save span that dispatched them, without a phase span.
This tree is asserted by test/unit-of-work-phases.spec.ts.
Span names, kinds and attributes
| Span | Kind | Made by | Attributes |
|---|---|---|---|
| <METHOD> <route template> | SERVER | tracedRoutes() (renames the span an HTTP instrumentation opened, or starts one) | http.route, http.request.method, http.response.status_code, app.operation, app.correlation_id, app.origin, app.outcome, app.error.code |
| command <Name>, query <Name> | INTERNAL | traceUseCases(), a bus middleware | app.use_case.kind, app.use_case.name, app.context, app.outcome, app.error.code, error.type |
| <kind> <Port>.<method>: repository, gateway, external, publisher | INTERNAL | traceBindings() | code.namespace (the adapter class), code.function, app.dependency.kind, app.context |
| unit-of-work before-commit | INTERNAL | tracedDomainEvents(), around each round of events dispatched at the end of a unit of work, before the commit | none |
| unit-of-work after-commit | INTERNAL | tracedDomainEvents(), around the events that have an after-commit handler, once the unit of work has committed | none |
| domain-event <name> | INTERNAL | tracedDomainEvents() | app.domain_event.name |
| handler <ClassName> | INTERNAL | traceBindings(), kind domain-event-handler | code.namespace, code.function, app.dependency.kind, app.context |
| outbox append <type> | INTERNAL | tracedPublisher() around a publisher that stores | messaging.system (outbox), messaging.operation.name (append), messaging.operation.type (create), messaging.destination.name, messaging.message.id |
| publish <type> | PRODUCER | tracedPublisher() around a bus | messaging.system, messaging.operation.name (publish), messaging.operation.type (send), messaging.destination.name, messaging.message.id |
| process <consumer> | CONSUMER | tracedConsumer(), one per delivery | messaging.system, messaging.operation.* (process), messaging.destination.name, messaging.message.id, messaging.consumer.group.name, app.messaging.source, app.messaging.attempt, app.messaging.redelivered, app.context, app.correlation_id, app.origin, app.outcome |
| job <name> | INTERNAL, always a root | tracedJob() | app.job.name, app.job.scheduled_at, app.job.attempt, app.context, app.correlation_id, app.origin, app.outcome |
| job <name> of a background job | CONSUMER, child of the span that enqueued it | tracedBackgroundJob(), one per attempt; traceparent() (captureTraceparent) is stored with the job when it is enqueued | app.job.name, app.job.id, app.job.attempt, app.context, app.correlation_id, app.origin (queue), app.outcome |
- Names are stable and of low cardinality: a route template, never a URL; a class, a port, an event type or a consumer name, never an identifier.
app.outcomeissucceeded,refused(a business answer),failed, and for a deliverydead-lettered. ADomainErroris an answer, not an incident: the use case span saysrefusedandapp.error.code, and is not an error. Anything else sets the status ERROR witherror.type(the class name) andapp.error.code(thecode, when it is shaped like one).- A request refused by authorization has no use case span: the middleware sits after the use
case guard, so the trace is the SERVER span alone, with the status answered and the code
(
FORBIDDEN). A use case refused by its own rules has its span,refused. - One mechanism per span. A use case is traced by the bus middleware, a consumer by
process <consumer>, a job byjob <name>:traceBindings()leaves the bindings of kinduse-case,consumerandjobalone. - Privacy: class, method, port, context, codes and the identifiers of the kit (event id, correlation id, job name). Never arguments, results, payloads, SQL parameter values, error messages, aggregate ids, nor anything about the actor or the tenant.
Across the asynchronous boundary
The trace context is captured when the integration event is created, inside the request:
outbox append <type> stamps its own traceparent on the event, and the outbox stores it with
the record (every outbox store of the kit persists and restores it exactly: the contract suite
of @ddd-ts-kit/testing says so for the in-memory, Drizzle, Knex, Prisma and TypeORM stores).
The relay publishes later, from another call chain or another process: tracedPublisher(bus)
makes publish <type> a child of what the record names, never of the loop of the relay, and
stamps its own span on what goes out, so the consumers are its children. A tick that finds
nothing to publish makes no span, and there is no span per tick.
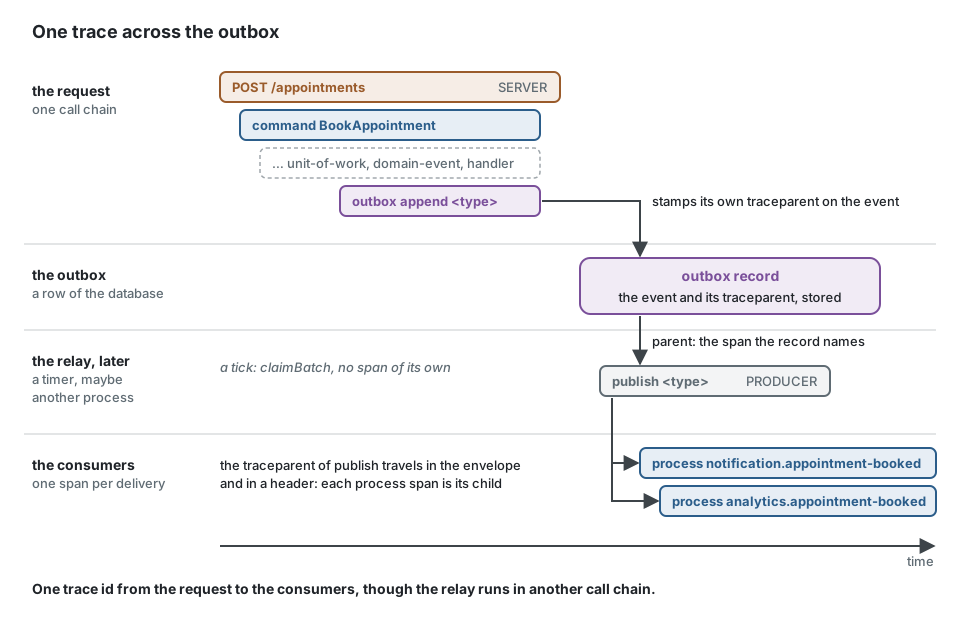
An event without traceparent (stored before tracing was configured) continues the active
span instead.
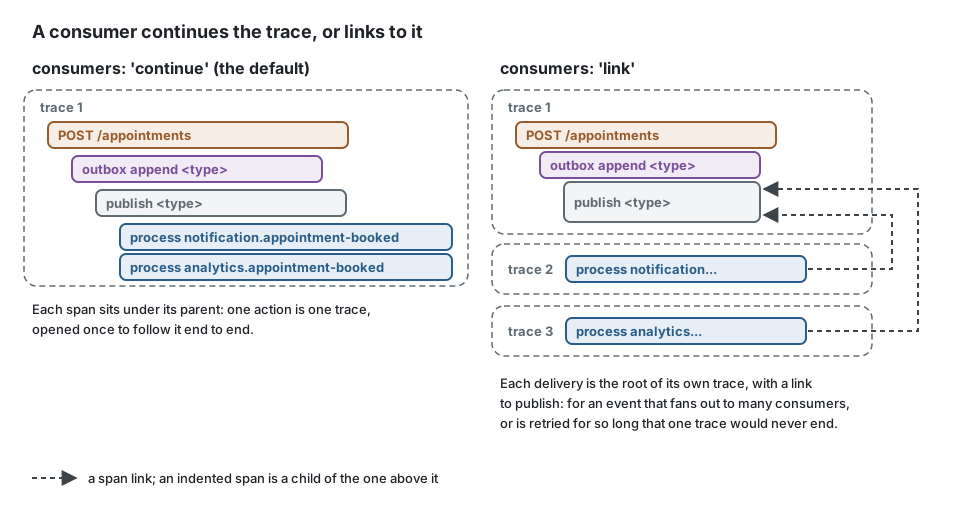
Continue or link. The messaging conventions of OpenTelemetry allow a consumer to continue
the trace of the producer or to start a new one that links to it. The default is to continue,
traceApplication({ consumers: 'continue' }): following one action end to end is then opening
one trace, and Jaeger shows a link only as a reference to click through, one consumer at a
time. Choose consumers: 'link' for a system where one event fans out to so many consumers,
or is retried for so long, that a trace would never end: each delivery is then the root of its
own trace, linked to the publication.
Deliveries. A provider tells each handler which delivery this is (EventDelivery of the
kernel: attempt, last attempt, transport, source, consumer), and each attempt is a span of its
own: app.messaging.attempt counts from 1, app.messaging.redelivered marks the ones after
the first, a failed attempt is an error with the code of what was thrown, and the attempt
after which the provider gives the event up says app.outcome: dead-lettered. RabbitMQ, Kafka,
NATS, Redis Streams and the in-memory bus all say it; their traceparent travels in the
envelope and in a real header (traceparent).
The pieces, without kernelModule
traceApplication() is these, one per member, for a composition written by hand:
bus.use(traceUseCases());                                              // after authorization, outside the unit of work
traceDependency(new KnexOrderRepository(db), { kind: 'repository', context: 'ordering', port: 'OrderRepository' });
tracedDomainEvents(dispatcher);
tracedPublisher(new OutboxPublisher(store));                           // outbox append <type>
tracedPublisher(bus);                                                  // publish <type>
tracedSubscriber(bus, { trace: 'continue' });                          // process <type>
tracedConsumer(handler, { consumer: 'billing.invoice-on-order-placed', context: 'billing' });
tracedJob(run, { name: 'billing.send-reminders', context: 'billing' });
tracedErrorReporter(reporter);
createApplication({ modules, decorate: traceBindings() });             // bindings only
configureTracing({ executionScope });                                  // correlation id on spans and log fields
The last two lines are for an application whose kernel module is given no instrumentation.
With it, traceBindings() is already the binding member the kernel module puts around every
binding and the execution scope is handed over by the module, so the decorate hook adds
nothing (wrapping an instance twice is a no-op). A project generated by the CLI has neither line: it calls
traceApplication() once in src/platform/lay-foundations.ts, tracedRoutes() in
src/platform/auth/http-boundary.ts, tracedPublisher(...) in
src/platform/compose-application.ts, and initTracing in src/platform/tracing.ts. The
rule tracing/platform-only keeps these imports in the platform directory, main.ts and
apps/.
A publisher names its transport itself (messagingSystem: rabbitmq, kafka, nats,
redis, in-memory, and outbox for the outbox publisher); scopedPublisher and
validatingPublisher pass it on, and tracedPublisher(publisher, { system }) says it for a
publisher of your own.
For a custom transport: captureTraceparent() when storing a message,
runWithTraceparent(traceparent, fn) when handling it. This is all the outbox does, and it
runs as it is:
import { captureTraceparent, runWithTraceparent, withSpan } from '@ddd-ts-kit/tracing';
import { expectSpanTree, installTestTracing } from '@ddd-ts-kit/tracing/testing';

interface QueuedMessage {
  readonly body: string;
  readonly traceparent: string | undefined;
}

const queue: QueuedMessage[] = [];
const tracing = installTestTracing();

const trace = await tracing.traceOf(async () => {
  // Inside the request: store the message with the trace it belongs to.
  await withSpan('POST /messages', async () => {
    queue.push({ body: 'hello', traceparent: captureTraceparent() });
  });

  // Later, from a timer, outside of any span: continue the stored trace.
  for (const message of queue.splice(0)) {
    await runWithTraceparent(message.traceparent, () => withSpan('handle message', async () => undefined));
  }
});

// One trace: the handling is a child of the request, though the request was over.
expectSpanTree(trace, [{ name: 'POST /messages', children: [{ name: 'handle message' }] }]);
tracing.uninstall();
With a missing or malformed traceparent, runWithTraceparent runs the function in the
current context. spanContextFromTraceparent accepts version 00 only and rejects all-zero
ids. withSpan(name, fn, attributes?) exists for
platform code (a migration, a startup step); domain and application code never call it.
What a dependency span contains
traceDependency opens one span per call of an async method, named <kind> <Port>.<method>
after the port when it is given and after the class otherwise. traceBindings() calls it for
every binding declared with a kind; by hand, and asserted with the test harness:
import { traceDependency, withSpan } from '@ddd-ts-kit/tracing';
import { expectSpanTree, installTestTracing } from '@ddd-ts-kit/tracing/testing';

// An adapter as a context writes it: no import of the tracing package.
class InMemoryOrderRepository {
  private readonly rows = new Map<string, number>();

  async save(orderId: string, total: number): Promise<void> {
    this.rows.set(orderId, total);
  }

  async totalOf(orderId: string): Promise<number | undefined> {
    return this.rows.get(orderId);
  }
}

const tracing = installTestTracing();

// The composition root wraps it, under the name of its port.
const orders = traceDependency(new InMemoryOrderRepository(), {
  kind: 'repository',
  context: 'ordering',
  port: 'OrderRepository',
});

const trace = await tracing.traceOf(() =>
  withSpan('place order', async () => {
    await orders.save('order-1', 3000);
    await orders.totalOf('order-1');
  }),
);

expectSpanTree(trace, [
  {
    name: 'place order',
    children: [
      {
        name: 'repository OrderRepository.save',
        attributes: { 'code.namespace': 'InMemoryOrderRepository', 'code.function': 'save', 'app.context': 'ordering' },
      },
      { name: 'repository OrderRepository.totalOf' },
    ],
  },
]);

console.log(orders instanceof InMemoryOrderRepository); // true: the same object, wrapped in place
tracing.uninstall();
What the wrapping keeps and leaves out:
- Never arguments, return values or error messages; the error is rethrown untouched.
- Synchronous methods are not traced. A method declared
asyncis traced from its first call; a method that merely returns a promise is traced from its second call. A traced call returns a promise, so do not wrap an object whose methods return a chainable query builder. - Getters, symbols, generators and lifecycle hooks (
onModuleInit,onModuleDestroy,onApplicationBootstrap,onApplicationShutdown,dispose) are left alone. - The instance is wrapped in place: same object,
instanceofandthisintact, wrapping twice is a no-op. Nothing enumerable is added, so the instance spreads and compares as before. privateis a compile-time keyword: at run time a private method is a method and a function held in a private field is a method too. Both are traced when async, and a method that calls another throughthisproduces a child span. The aspects of@ddd-ts-kit/aspectsdiffer on purpose: they advise the call made from outside only.- A frozen or sealed instance is fronted by a proxy instead. Its methods and getters run with
the real instance as
this; the calls it makes on itself are then not traced. - Order of the wrappers of a repository under
kernelModule({ instrumentation }), outermost first: thedecoratehook of the application when there is one, the span, the hand-over of domain events (dispatchingOnSaveof the kernel), then the aspects of the binding (retry,timeout). Sorepository X.savecovers the retries, and a retried save announces its events once. Inside a unit of workrepository X.savecontains nodomain-eventspan: the save only queues the events, and they are dispatched underunit-of-work before-commit, a sibling that follows the saves. Outside any unit of work the save dispatches before it resolves, and thedomain-eventspans are its children.
Noise
A trace tells the story of an action and nothing else. The defaults, and the option for each:
| What | Default | Option |
|---|---|---|
| Probes, metrics, documentation | no span for /health, /healthz, /live, /livez, /ready, /readyz, /startup, /metrics, /docs, /openapi.json, /openapi (the documents of a split contract), /favicon.ico and what is below them; no span for the documentation routes of @ddd-ts-kit/http wherever they are mounted | initTracing({ ignoredPaths }), tracedRoutes({ ignore }) |
| Outbox relay | no span per tick, none when nothing is published; the queries of its polling make no span (see the drivers) | |
| Instrumentations on | http and undici and grpc (the two sides of a request), pg, mysql2, mysql, mongodb, ioredis, redis | initTracing({ autoInstrumentations }), or instrumentations to replace them all |
| Database drivers | the statement as written, with its placeholders, never the values bound to them; only inside a trace (requireParentSpan), so a poller or a pool makes no trace of its own; no connection or pool checkout span (ignoreConnectSpans) | autoInstrumentations |
| Instrumentations off | fs, dns, net (how a call was made, not what was done); express, connect, router, koa, hapi, restify, nestjs-core (a span per middleware, where the kit names the request by its route); amqplib, kafkajs (they would double publish and process); knex, generic-pool, dataloader, lru-memoizer, mongoose (they repeat the driver); logging bridges, runtime and host metrics | autoInstrumentations: { '@opentelemetry/instrumentation-fs': { enabled: true } } |
| Attributes | an allow-list (DEFAULT_ALLOWED_ATTRIBUTES): what the kit writes and what the instrumentations kept on say of a request, a query, a peer. Headers, bodies, parameter values, user and client identifiers are dropped before export | initTracing({ allowedAttributes }), new AttributeAllowList({ allowed, alsoAllowed }) |
| Volume | under one local root (a request, a delivery, a job run), at most 25 dependency, domain event or publication spans share a name and 200 exist in total; beyond, the call runs untraced (an event published past the cap still carries the trace on) and app.dependency_spans.dropped counts on the root | configureTracing({ maxSpansPerName, maxSpansPerRoot }) |
| Secrets | query string values and userinfo of recorded URLs become REDACTED; exception messages and stack traces are dropped | |
Use case, consumer, job and request spans are never capped: there is one per unit of work.
Sampling
initTracing({ sampleRatio: 0.2 }) samples a share of the traces where they start, and a
sampled parent is always followed: a trace is kept or dropped whole, across the outbox and the
contexts, since the decision travels in the traceparent stored with the event. Without the
option the standard OTEL_TRACES_SAMPLER variables apply, and by default every trace is kept.
Keeping every trace that ends in error, whatever the ratio, cannot be decided when a trace starts. That is tail sampling, and it belongs to a collector, which sees whole traces. Sample everything in the application and decide there:
# OpenTelemetry Collector (contrib): between the applications and Jaeger
receivers:
  otlp: { protocols: { http: { endpoint: 0.0.0.0:4318 } } }
processors:
  tail_sampling:
    decision_wait: 30s
    policies:
      - { name: errors, type: status_code, status_code: { status_codes: [ERROR] } }
      - { name: dead-letters, type: string_attribute, string_attribute: { key: app.outcome, values: [dead-lettered] } }
      - { name: the-rest, type: probabilistic, probabilistic: { sampling_percentage: 10 } }
exporters:
  otlp_http/jaeger: { endpoint: http://jaeger:4318 }
service:
  pipelines:
    traces: { receivers: [otlp], processors: [tail_sampling], exporters: [otlp_http/jaeger] }
decision_wait must cover the delay of the outbox relay and of the retries, or the late spans
of a trace are decided apart.
Span processors
For a provider you build yourself, add them before the exporting processor:
| Processor | Effect |
|---|---|
| LocalRootTracker | enables the per-root caps, names the correlation on the local root, and lets tracedRoutes() recognise the span of an HTTP instrumentation |
| UrlSecretSpanProcessor | url.full, http.url, url.query: query values and userinfo become REDACTED, parameter names stay |
| ErrorMessageScrubber | drops exception.message, exception.stacktrace and the status message recorded by instrumentations; keeps exception.type |
| AttributeAllowList | keeps the allowed attributes only |
initTracing installs the four, then extraSpanProcessors, then the exporter.
Pivoting: trace, logs, audit trail, error tracker
Every span that starts a unit of work (the SERVER span, process <consumer>, job <name>)
carries app.correlation_id and app.origin: the correlation id of the kit, the same in every
bounded context an action reaches. From there:
const logger = pino({ mixin: () => traceLogFields() });
// inside a unit of work: { correlationId, origin, actorId, tenantId?, causationId?, trace_id, span_id }
| From | To | By |
|---|---|---|
| a trace | its log lines | trace_id of the log fields, or correlationId |
| a trace | the audit entries of the action | app.correlation_id is the correlationId of the AuditEntry |
| an error report | its trace | traceId of the ErrorReport, filled by tracedErrorReporter (also for a failed job or a buried event, reported once their spans are over) |
| a log line, an audit entry | the trace | search the tag app.correlation_id in Jaeger |
traceApplication() gives the execution scope of the application to configureTracing; a
composition by hand calls configureTracing({ executionScope }) itself, and
traceLogFields(scope) takes the scope as an argument for a logger built earlier.
correlationIdFromActiveSpan() answers the trace id, usable as a support reference when the
project has no execution scope. Nothing personal becomes a span attribute: the actor and
the tenant stay in the log fields, where retention is yours.
Asserting traces in a project
import { expectSpanTree, installTestTracing } from '@ddd-ts-kit/tracing/testing';

const tracing = installTestTracing();          // a real provider that keeps the ended spans; uninstall() when done

it('books an appointment in one trace', async () => {
  const trace = await tracing.traceOf(() => app.resolve(CommandBus).execute(new BookAppointment('09:00')));

  expectSpanTree(trace, [
    {
      name: 'command BookAppointment',
      attributes: { 'app.context': 'scheduling', 'app.outcome': 'succeeded' },
      children: [
        { name: 'repository AppointmentRepository.findOverlapping' },
        { name: 'repository AppointmentRepository.save' },
        { name: 'unit-of-work before-commit', children: [{ name: 'domain-event scheduling.appointment.booked' }] },
      ],
    },
  ]);
});traceOf(action)answers the spans that ended during the action as plain data (SpanNode: name, kind, status, attributes, trace and span ids, links, children in the order they started): one tree per root, so two traces are two trees.expectSpanTree(actual, expected)is exact on names and structure: a span that is not listed fails, and so does a listed one that is missing. Kinds, statuses and attributes are checked when given (undefinedexpects an attribute to be absent), and a span is expected not to be an error unlessstatus: 'ERROR'says so. On a mismatch the error lists what differs, then shows both trees as indented text. It depends on no test runner.installTestTracing({ processors, sampler })takes the processors of the project and a sampler, to assert scrubbing or sampling.
Tests
npx vitest run packages/tracing
DDD_TS_KIT_TEST_JAEGER_IMAGE=jaegertracing/jaeger:2.22.0 npx vitest run packages/tracing/test/jaeger
The second command needs Docker: it starts a Jaeger of its own (a container named
ddd-ts-kit-test-trace-jaeger-<pid>, on two free loopback ports), runs the scenario above with
initTracing({ serviceName }) and the standard endpoint variable, reads the trace back through
the HTTP API of Jaeger and asserts the same tree, then removes the container.