
@dhtmlx/chart
v9.3.5
Published
DHTMLX Chart - JavaScript chart library. GPL v2 edition for GPL-compatible open-source projects; commercial licenses are available for proprietary and production use.


Readme
DHTMLX Chart — JavaScript Chart Library (GPL Edition)
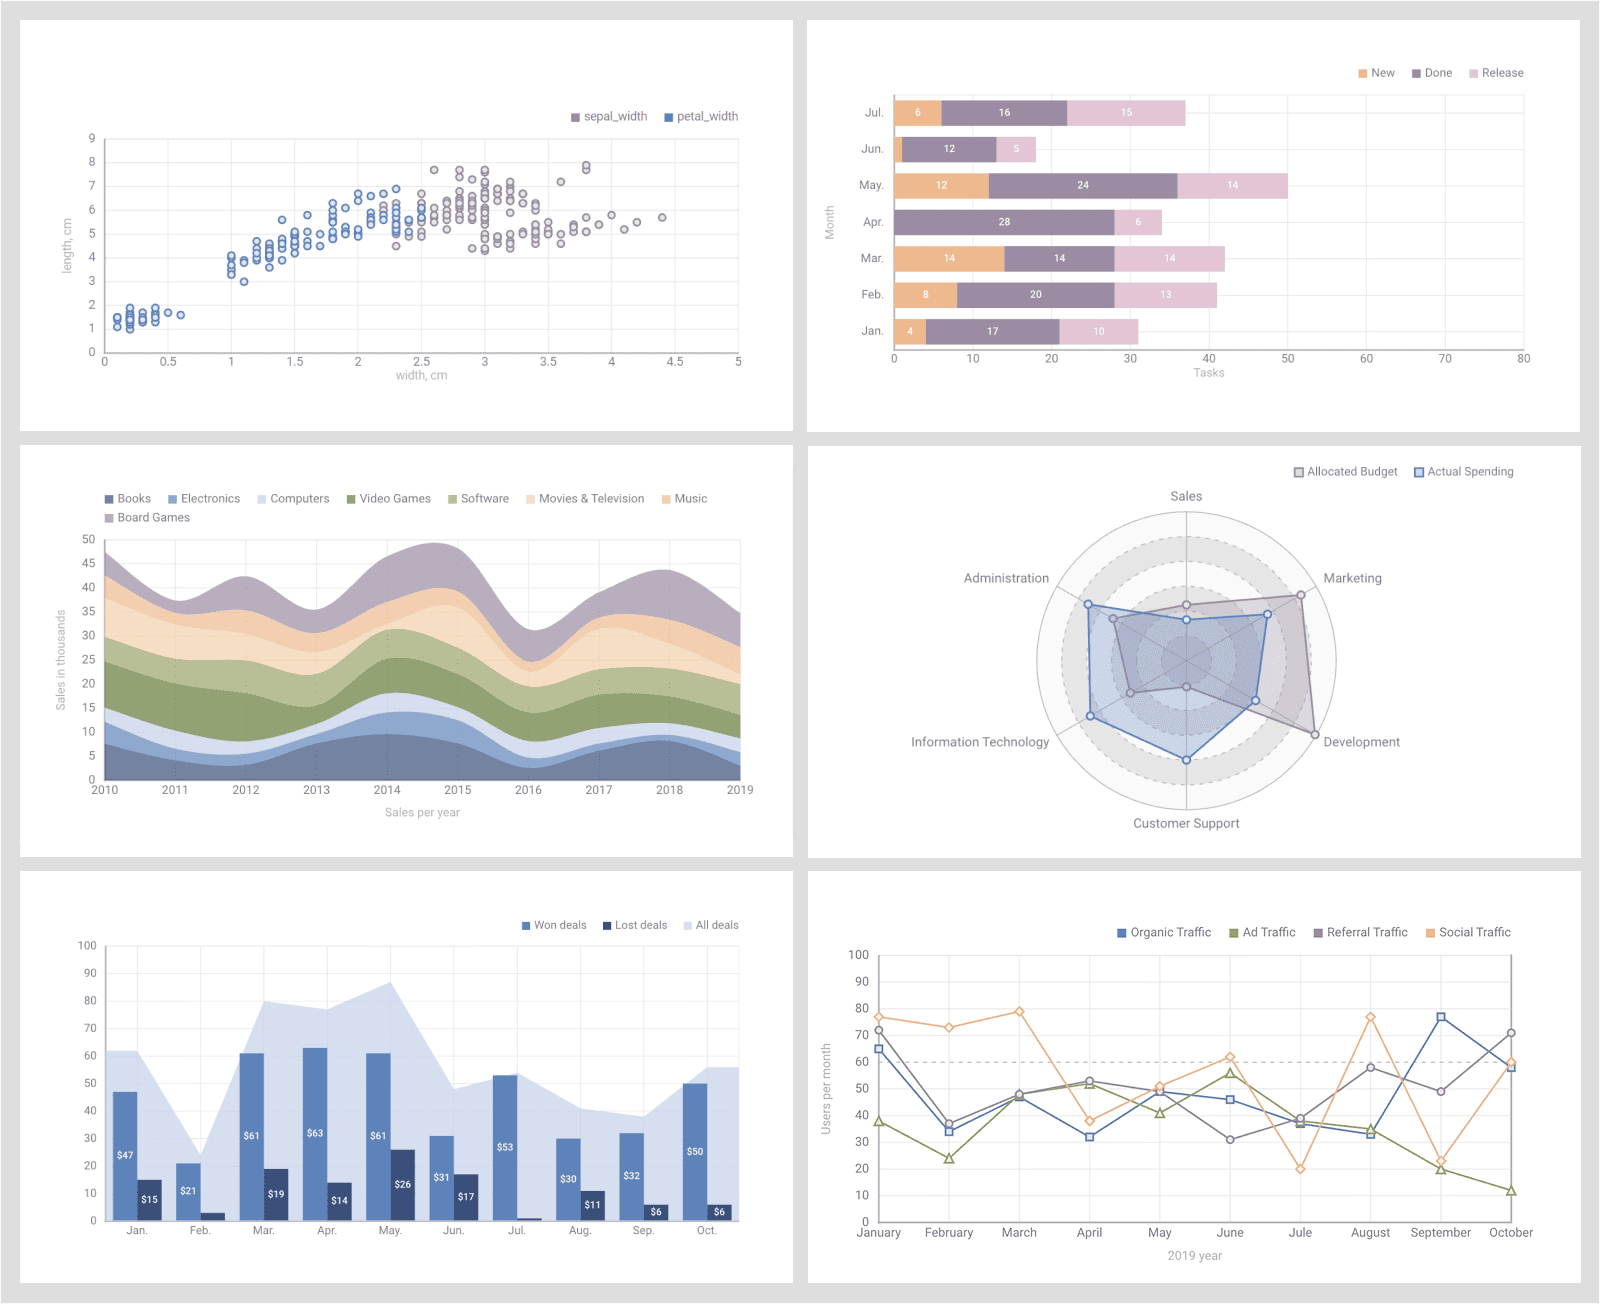
![]()
![]()
![]()
@dhtmlx/chart is a JavaScript chart library for visualizing data in web applications with 12 chart types including line, bar, area, pie, donut, scatter, radar, treemap, and heatmap charts, with full support for mixed chart types, real-time data updates, and deep customization.
It is a framework-agnostic charting component that works with plain JavaScript and integrates with React, Angular, Vue, and Svelte.
It is ideal for prototyping data visualizations, embedding charts in open-source projects, and evaluating DHTMLX Chart's core features under the GPL v2 license.
License
This edition of DHTMLX Chart is licensed under the GNU General Public License v2.0 (GPL v2).
You can redistribute this package and/or modify it under the terms of the GPL v2.
GPL v2 requires that any project using this package also be open source under a GPL-compatible license.
You may NOT use this package in closed-source, proprietary, or commercial applications without a separate commercial license. For commercial use, please obtain a commercial license of DHTMLX Chart (PRO edition).
This package is distributed in the hope that it will be useful, but WITHOUT ANY WARRANTY; without even the implied warranty of MERCHANTABILITY or FITNESS FOR A PARTICULAR PURPOSE. See the GPL v2 for more details.
Using DHTMLX Chart in a commercial or closed-source project?
You need a commercial license. DHTMLX offers Individual, Commercial, Enterprise, and Ultimate license tiers.
- Compare licenses and pricing
- Download a free 30-day trial of DHTMLX Chart
- Download 30-day trial versions of all DHTMLX components
- Contact us regarding licensing: [email protected]
Copyright © 2026 XB Software Ltd.
What is DHTMLX Chart
DHTMLX Chart is a JavaScript data visualization component for rendering interactive charts in web applications. It supports 11 chart types – line, spline, area, bar, pie, donut, scatter, radar, treemap, and their combinations – and allows multiple series to be plotted on a single chart. Developers can configure scales, legends, tooltips, and series individually, apply CSS-based theming, and update chart data or configuration at runtime without re-initializing.
This is the GPL (open source) edition of DHTMLX Chart, distributed as the @dhtmlx/chart npm package. It is part of the DHTMLX Suite family of UI components and can be used standalone or alongside other Suite widgets such as DHTMLX Grid, which can share and synchronize data with Chart directly.
Use this GPL edition when you want to prototype data visualizations, integrate charts into an open-source project, or evaluate DHTMLX Chart's core features before obtaining a commercial license.
Quick Start
Install the package, import the styles, and initialize a chart in a container element.
Install
npm install @dhtmlx/chartInclude in your project
import { Chart } from "@dhtmlx/chart";
import "@dhtmlx/chart/chart.css";
Or via CDN as part of DHTMLX Suite:
<link rel="stylesheet" href="https://cdn.dhtmlx.com/suite/edge/suite.css" />
<script type="text/javascript" src="https://cdn.dhtmlx.com/suite/edge/suite.js"></script>
Or with script tags pointing to local files:
<script src="path/to/chart.js"></script>
<link rel="stylesheet" href="path/to/chart.css">
The CSS import is required for default chart styling and layout.
Initialize
import { Chart } from "@dhtmlx/chart";
import "@dhtmlx/chart/chart.css";

const chart = new Chart("chart_container", {
    type: "bar",
    scales: {
        bottom: { text: "month" },
        left:   { maxTicks: 10, max: 100, min: 0 }
    },
    series: [
        { id: "revenue", value: "revenue", color: "#5E83BA", fill: "#5E83BA" }
    ],
    data: [
        { month: "Jan", revenue: 60 },
        { month: "Feb", revenue: 75 },
        { month: "Mar", revenue: 55 }
    ]
});
Add a container element to your HTML:
<div id="chart_container" style="width: 100%; height: 400px;"></div>Basic Usage — DHTMLX Chart
Initialize a mixed line and bar chart with tooltips and a legend:
import { Chart } from "@dhtmlx/chart";
import "@dhtmlx/chart/chart.css";

const chart = new Chart("chart_container", {
    type: "bar",
    scales: {
        bottom: { text: "month" },
        left:   { maxTicks: 10, max: 100, min: 0 }
    },
    legend: {
        series: ["revenue", "expenses"],
        halign: "right",
        valign: "top"
    },
    series: [
        {
            id: "revenue",
            value: "revenue",
            type: "line",           // overlay a line on the bar chart
            color: "#5E83BA",
            strokeWidth: 2,
            tooltip: { template: d => `Revenue: $${d.revenue}k` }
        },
        {
            id: "expenses",
            value: "expenses",
            type: "bar",
            color: "#E9C934",
            fill: "#E9C934",
            tooltip: { template: d => `Expenses: $${d.expenses}k` }
        }
    ],
    data: [
        { month: "Jan", revenue: 60, expenses: 40 },
        { month: "Feb", revenue: 75, expenses: 50 },
        { month: "Mar", revenue: 55, expenses: 35 }
    ]
});
The type field can be set globally on the chart and overridden per series – this is how DHTMLX Chart supports mixed chart types on a single figure. The tooltip.template function receives the data item and returns an HTML string for the tooltip content.
DHTMLX Chart Features
DHTMLX Chart includes the following main features in the GPL edition, with additional PRO-only capabilities marked accordingly.
| Feature | Details |
| :---- | :---- |
| 11 chart types | Line and spline, area and spline area, bar and x-bar, pie (2D/3D), donut, scatter, radar, treemap |
| Mixed chart types | Combine multiple chart types on a single figure (e.g. line overlaid on bar) |
| Multiple data series | Render several data properties on the same chart with independent configuration |
| Configurable scales | Set min/max values, tick count, logarithmic scale, label rotation, gridline style |
| Configurable legend | Set position, alignment, marker shape, and padding between legend items |
| Tooltips | Custom HTML tooltip templates per series via tooltip.template function |
| Threshold and baseline lines | Add reference lines at any value on the scale |
| Real-time data updates | Add, remove, or update data items at runtime without re-initializing the chart |
| Runtime config changes | Swap chart type, scales, or series at runtime via setConfig() |
| Data export | Export charts to PDF and PNG via the DHTMLX export service or a local module |
| Full CSS customization | Control padding, margin, colors, gradients, and point types via CSS and API |
| Themes | Multiple built-in themes; switch theme at runtime |
| Accessibility | Keyboard navigation support |
| Event system | Rich API events for series interaction, data changes, and more |
| DHTMLX Grid integration | Synchronize chart data directly with a DHTMLX Grid instance |
| DataCollection API | Use the shared DHTMLX DataCollection API to load, filter, and manipulate data |
| Heatmap | PRO only |
This table highlights key features. For the complete and up-to-date feature list, see the DHTMLX Chart documentation.
Framework Integration
DHTMLX Chart works with popular front-end frameworks including React, Angular, Vue, and Svelte. These integration guides apply to both the GPL edition and the commercial editions of DHTMLX Chart.
Documentation and Resources
- Product page – overview, screenshots, and key features.
- Documentation – getting started, guides, and configuration options.
- API reference – full JavaScript API.
- Live demos and samples – interactive examples of DHTMLX Chart features.
- Support forum – community Q&A and discussions for DHTMLX Suite.