
@dhtmlx/diagram
v6.1.5
Published
DHTMLX Diagram – JavaScript diagramming library with flowcharts, org charts, mind maps, swimlanes, drag-and-drop editor, auto-layout, and PDF/PNG export
Downloads
288


Readme
DHTMLX Diagram — JavaScript Diagram Library (GPL Edition)
![]()
![]()
![]()
@dhtmlx/diagram is a JavaScript diagramming library for building interactive flowcharts, org charts, mind maps, UML diagrams, swimlanes, network diagrams, PERT charts, and more – with a built-in drag-and-drop editor, auto-layout algorithms, custom shapes, and export to PDF and PNG.
It is a standalone widget that works with plain JavaScript and integrates with React, Angular, and Vue.
It is ideal for prototyping diagram-based interfaces, embedding visual data modeling in open-source applications, and evaluating DHTMLX Diagram's core features under the GPL v2 license.
License
This edition of DHTMLX Diagram is licensed under the GNU General Public License v2.0 (GPL v2).
You can redistribute this package and/or modify it under the terms of the GPL v2.
GPL v2 requires that any project using this package also be open source under a GPL-compatible license.
You may NOT use this package in closed-source, proprietary, or commercial applications without a separate commercial license. For commercial use, please obtain a commercial license of DHTMLX Diagram.
This package is distributed in the hope that it will be useful, but WITHOUT ANY WARRANTY; without even the implied warranty of MERCHANTABILITY or FITNESS FOR A PARTICULAR PURPOSE. See the GPL v2 for more details.
Using DHTMLX Diagram in a commercial or closed-source project?
You need a commercial license. DHTMLX offers Individual, Commercial, Enterprise, and Ultimate license tiers.
- Compare licenses and pricing
- Download a free 30-day trial of DHTMLX Diagram
- Download 30-day trial versions of all DHTMLX components
- Contact us regarding licensing: [email protected]
Copyright © 2026 XB Software Ltd.
What is DHTMLX Diagram
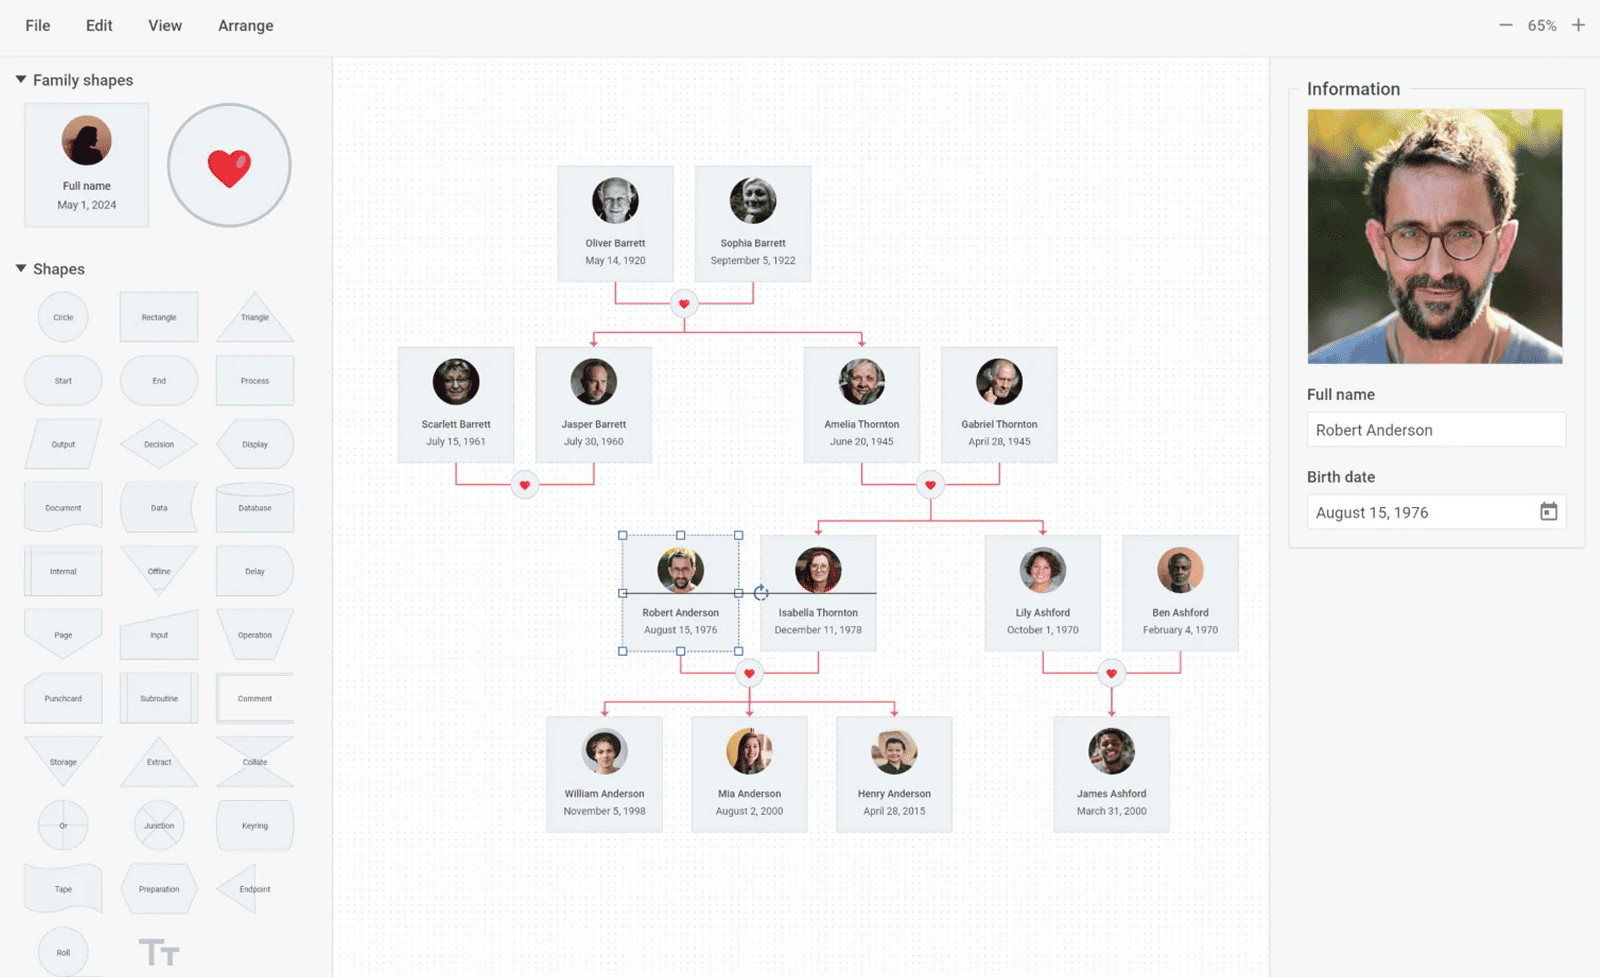
DHTMLX Diagram is a JavaScript library for building and displaying interactive diagrams in web applications. It provides two components in a single package: a read-only Diagram viewer for rendering diagrams from data, and a full Diagram Editor for creating and editing diagrams visually via drag-and-drop. Both components operate in three modes – default (flowcharts, UML, network diagrams, swimlanes), org (org charts, hierarchy trees, family trees), and mindmap (mind maps with radial branching) – as well as a PERT mode for project planning visualizations. Developers define diagram data as JSON, load it via diagram.parse(), and respond to user interactions via a rich event API. Custom shapes built from plain HTML templates allow any visual structure to be represented.
DHTMLX Diagram is a standalone component. It is not part of the DHTMLX Suite library, is distributed and licensed separately, and does not require Suite as a dependency. It can be combined with DHTMLX Gantt for PERT-based project timeline diagrams, or with Suite widgets such as Layout to embed diagrams in larger application interfaces.
Use this GPL edition when you want to prototype a diagram-based interface, integrate visual data modeling into an open-source project, or evaluate DHTMLX Diagram's core features before obtaining a commercial license.
Quick Start
Install the package, import the styles, and initialize a diagram in a container element.
Install
npm install @dhtmlx/diagramInclude in your project
import { Diagram, DiagramEditor } from "@dhtmlx/diagram";
import "@dhtmlx/diagram/diagram.css";
// or import styles that include editor styles
import "@dhtmlx/diagram/diagramWithEditor.css"
Or with script tags pointing to local codebase files:
<script type="text/javascript" src="./codebase/diagram.js"></script>
<link rel="stylesheet" href="./codebase/diagram.min.css">
The CSS import is required for default Diagram styling and layout.
Initialize a Diagram viewer
import { Diagram } from "@dhtmlx/diagram";
import "@dhtmlx/diagram/diagram.css";

const diagram = new Diagram("diagram_container", {
    type: "default"   // "default" | "org" | "mindmap"
});

diagram.data.parse([
    { id: "1", x: 100, y: 40,  text: "Start",    type: "start" },
    { id: "2", x: 100, y: 160, text: "Process",  type: "process" },
    { id: "3", x: 100, y: 280, text: "Decision", type: "decision" },
    { id: "4", x: 100, y: 400, text: "End",      type: "end" },
    { type: "line", from: "1", to: "2" },
    { type: "line", from: "2", to: "3" },
    { type: "line", from: "3", to: "4" }
]);
Initialize a Diagram Editor
import { DiagramEditor } from "@dhtmlx/diagram";
import "@dhtmlx/diagram/diagramWithEditor.css"

const editor = new DiagramEditor("editor_container", {
    type: "default"   // "default" | "org" | "mindmap"
});

editor.parse(data);Basic Usage — DHTMLX Diagram
Org chart mode
Initialize an org chart and load hierarchical data:
import { Diagram } from "@dhtmlx/diagram";
import "@dhtmlx/diagram/diagram.css";

const diagram = new Diagram("diagram_container", {
    type: "org"
});

diagram.data.parse([
    { id: "1", text: "CEO",          img: "/img/ceo.jpg" },
    { id: "2", text: "CTO",          img: "/img/cto.jpg",  parent: "1" },
    { id: "3", text: "CFO",          img: "/img/cfo.jpg",  parent: "1" },
    { id: "4", text: "Lead Dev",     img: "/img/dev.jpg",  parent: "2" },
    { id: "5", text: "Finance Lead", img: "/img/fin.jpg",  parent: "3" }
]);
Mind map mode
Initialize a mind map with a central topic and branching subtopics:
import { Diagram } from "@dhtmlx/diagram";
import "@dhtmlx/diagram/diagram.css";

const diagram = new Diagram("diagram_container", {
    type: "mindmap",
    typeConfig: {
        direction: "both"   // arrange child shapes on both sides of the root
    }
});

diagram.data.parse([
    { id: "1", text: "Project Goals" },
    { id: "2", text: "Performance",  parent: "1" },
    { id: "3", text: "Scalability",  parent: "1" },
    { id: "4", text: "Security",     parent: "1" },
    { id: "5", text: "Load testing", parent: "2" },
    { id: "6", text: "Caching",      parent: "2" }
]);
DHTMLX Diagram Features
DHTMLX Diagram includes the following features in the GPL edition.
| Feature | Details |
|:---|:---|
| Three diagram modes | Default (flowcharts, UML, network diagrams, swimlanes), Org (org charts, family trees), Mindmap |
| PERT mode | Visualize task sequences, dependencies, and critical paths for project planning |
| Built-in Diagram Editor | Drag-and-drop editor with shapebar, editbar, and configurable toolbar — no coding needed |
| Shapebar | Panel with predefined and custom shape previews for dragging into the diagram |
| Editbar | Right panel for adjusting the visual properties of selected shapes and connectors |
| Custom shapes | Define any shape using plain HTML templates; attach event handlers to template elements |
| Groups | Group multiple shapes into a named container and manipulate them as a unit |
| Swimlanes | Represent workflows in parallel horizontal or vertical lanes |
| Auto-layout | Arrange shapes automatically using orthogonal (default) or radial layout algorithms |
| Snap lines | Visual alignment aids for precisely placing shapes on the grid |
| Alignment and distribution | Align and evenly space multiple selected shapes in one click |
| Multi-item selection | Select, move, align, distribute, copy, or delete multiple shapes at once |
| Inline editing | Edit shape text directly in the diagram grid area |
| Style copying | Copy a shape's visual style and apply it to other shapes via keyboard shortcuts |
| Line titles | Add and edit text labels on connectors by double-clicking |
| Zoom | Zoom in and out of large diagrams via toolbar controls or API |
| Search | Search shapes by content in large diagrams via API |
| Undo/Redo | Full undo/redo support in the editor |
| JSON data format | Load and serialize diagram data as JSON via parse() and serialize() |
| Remote data loading | Load diagram data from a server endpoint via diagram.data.load(url) |
| Export to PDF | Export the full diagram to PDF |
| Export to PNG | Export the full diagram to PNG |
| Touch support | Full touch event support for tablet and mobile devices |
| TypeScript support | Bundled TypeScript type definitions for type-safe development |
| Localization | Translate editor UI labels via the locale configuration |
| CSS variable theming | Customize colors, fonts, and shape styles via CSS variables |
| AI integration | Generate org charts and diagrams from natural language input via AI services |
| Event system | Rich API events for shape interactions, drag, selection, and editor changes |
This table highlights key features. For the complete and up-to-date feature list, see the DHTMLX Diagram documentation.
Framework Integration
DHTMLX Diagram works with popular front-end frameworks including React, Angular, and Vue. These integration guides apply to both the GPL edition and the commercial editions of DHTMLX Diagram.
Documentation and Resources
- Product page – overview, diagram templates, and key features.
- Documentation – getting started, guides, and configuration options.
- API reference – full JavaScript API for Diagram and DiagramEditor.
- Live demos and samples – interactive examples of DHTMLX Diagram features.
- Support forum – community Q&A and discussions for DHTMLX Diagram.