
@dhtmlx/pivot
v2.1.1
Published
DHTMLX Pivot – JavaScript pivot table with drag-and-drop configuration, 15+ aggregation methods, tree mode, filtering, and Excel/CSV export – GPL v2 open source edition.


Readme
DHTMLX Pivot — JavaScript Pivot Table (GPL Edition)
![]()
![]()
![]()
@dhtmlx/pivot is a JavaScript pivot table component for summarizing and analyzing large datasets with a drag-and-drop configuration panel, 15+ aggregation methods, interactive filtering and sorting, tree mode, frozen columns, and export to Excel and CSV.
It is a standalone widget that works with plain JavaScript and integrates with React, Angular, Vue, and Svelte.
It is ideal for prototyping data analysis dashboards, embedding pivot reporting in open-source applications, and evaluating DHTMLX Pivot's core features under the GPL v2 license.
License
This edition of DHTMLX Pivot is licensed under the GNU General Public License v2.0 (GPL v2).
You can redistribute this package and/or modify it under the terms of the GPL v2.
GPL v2 requires that any project using this package also be open source under a GPL-compatible license.
You may NOT use this package in closed-source, proprietary, or commercial applications without a separate commercial license. For commercial use, please obtain a commercial license of DHTMLX Pivot.
This package is distributed in the hope that it will be useful, but WITHOUT ANY WARRANTY; without even the implied warranty of MERCHANTABILITY or FITNESS FOR A PARTICULAR PURPOSE. See the GPL v2 for more details.
Using DHTMLX Pivot in a commercial or closed-source project?
You need a commercial license. DHTMLX offers Individual, Commercial, Enterprise, and Ultimate license tiers.
- Compare licenses and pricing
- Download a free 30-day trial of DHTMLX Pivot
- Download 30-day trial versions of all DHTMLX components
- Contact us regarding licensing: [email protected]
Copyright © 2026 XB Software Ltd.
What is DHTMLX Pivot
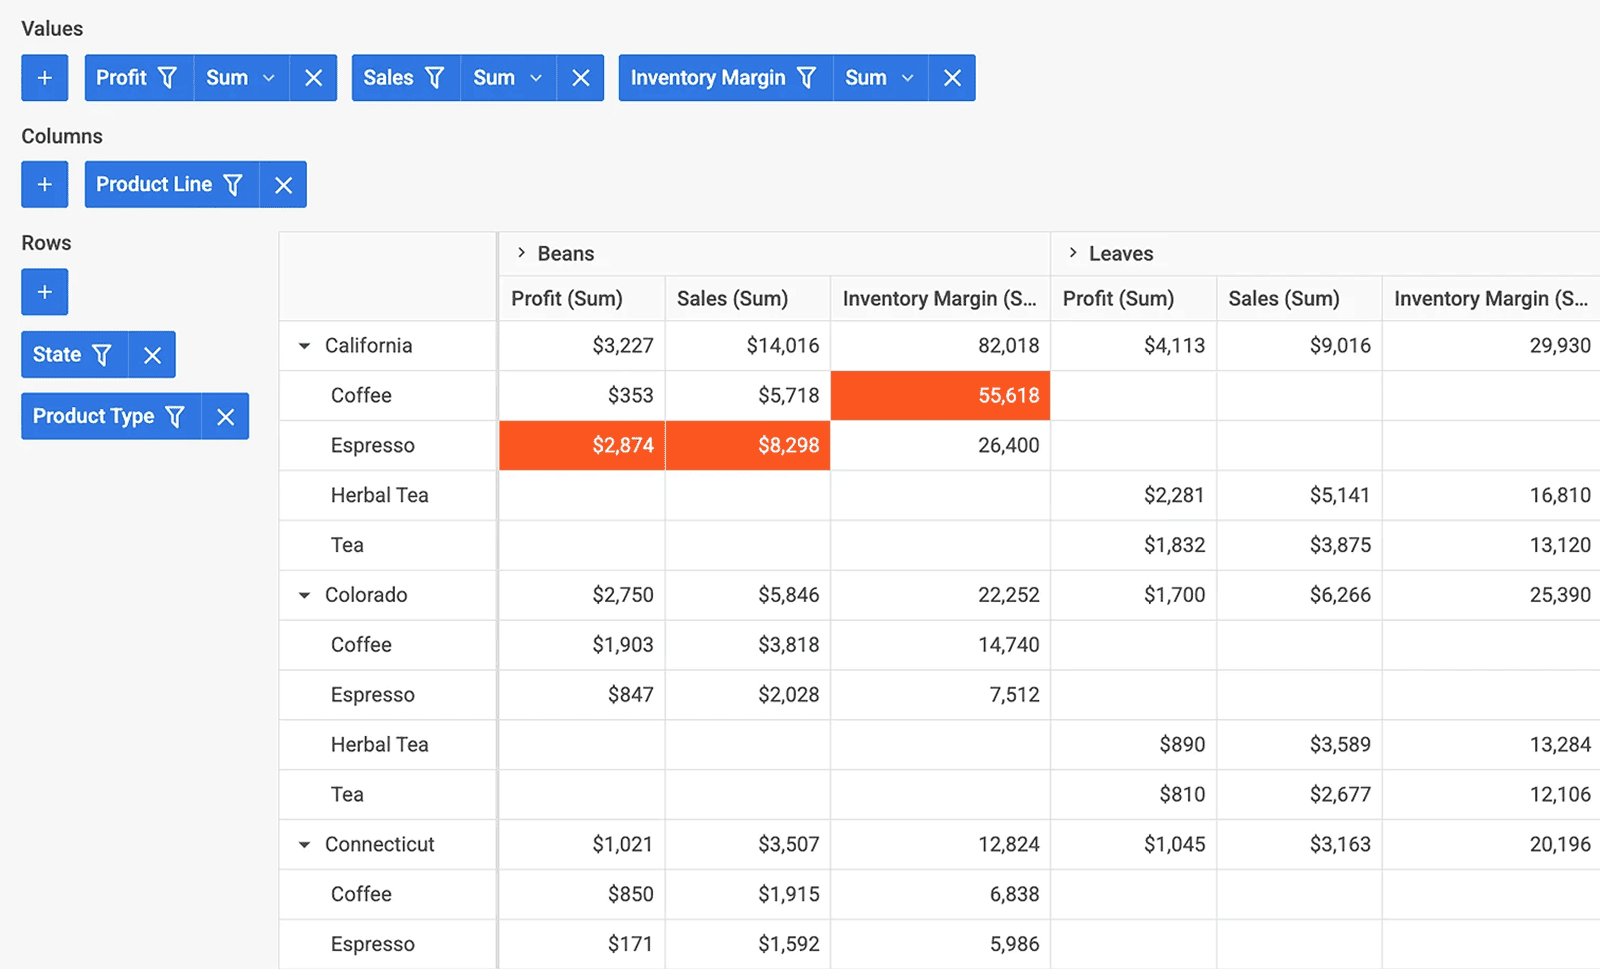
DHTMLX Pivot is a JavaScript pivot table component for summarizing and analyzing large datasets directly in the browser. It renders a two-panel UI: a drag-and-drop configuration panel where users define rows, columns, values, and filters, and a high-performance data table that updates instantly as the configuration changes. Developers can define the initial pivot structure via API, apply aggregation methods (sum, count, min, max, avg, median, and more), freeze row columns, enable tree mode for hierarchical row grouping, and export results to Excel or CSV.
DHTMLX Pivot is a standalone component. It is distributed and licensed separately, and does not require Suite as a dependency. It can be integrated alongside Suite widgets such as DHTMLX Grid for combined tabular and pivot views.
Use this GPL edition when you want to prototype pivot reporting, integrate data analysis into an open-source project, or evaluate DHTMLX Pivot's features before obtaining a commercial license.
Quick Start
Install the package, import the styles, and initialize Pivot in a container element.
Install
npm install @dhtmlx/pivotInclude in your project
import { Pivot } from "@dhtmlx/pivot";
import "@dhtmlx/pivot/dist/pivot.css";
Or with script tags pointing to local dist files:
<script type="text/javascript" src="./dist/pivot.js"></script>
<link rel="stylesheet" href="./dist/pivot.css" />
The CSS import is required for default Pivot styling and layout.
Initialize
import { Pivot } from "@dhtmlx/pivot";
import "@dhtmlx/pivot/dist/pivot.css";

const fields = [
	{ id: "continent", label: "Continent", type: "text" },
	{ id: "year", label: "Year", type: "number" },
	{ id: "oil", label: "Oil", type: "number" },
	{ id: "gdp", label: "GDP", type: "number" },
];

const data = [
	{ continent: "South America", year: 2015, oil: 1.545, gdp: 181.357 },
	{ continent: "Europe", year: 2015, oil: 3.21, gdp: 412.5 },
	// more rows...
];

const table = new Pivot("#pivot_container", {
	fields,
	data,
	config: {
		rows: ["continent"],
		columns: ["year"],
		values: [
			{ field: "oil", method: "sum" },
			{ field: "gdp", method: "max" },
		],
	},
});
Add a container element to your HTML:
<div id="pivot_container" style="width: 100%; height: 600px;"></div>Basic Usage — DHTMLX Pivot
Initialize DHTMLX Pivot with tree mode, frozen row columns, and programmatic filters:
import { Pivot } from "@dhtmlx/pivot";
import "@dhtmlx/pivot/dist/pivot.css";

const table = new Pivot("#pivot_container", {
	fields,
	data,
	tableShape: {
		tree: true, // enable hierarchical collapsible rows
		split: { left: true }, // freeze row-label columns on the left
	},
	columnShape: {
		sort: true, // enable click-to-sort on column headers
	},
	config: {
		rows: ["continent", "form"],
		columns: ["year"],
		values: [
			{ field: "oil", method: "sum" },
			{ field: "gdp", method: "max" },
		],
		filters: {
			continent: { includes: ["Europe", "Asia"] },
		},
	},
});
In tree mode, the first field in the rows array becomes the parent level and subsequent fields become nested children – rows are collapsible in the UI. The split: { left: true } option freezes all row-label columns so they remain visible while scrolling the data columns horizontally. Filters defined in the config.filters object are applied on initialization and can be changed programmatically via setConfig().
DHTMLX Pivot Features
DHTMLX Pivot includes the following features in the GPL edition.
| Feature | Details |
| :-------------------------------- | :------------------------------------------------------------------------------------------------------ |
| Drag-and-drop configuration panel | Users drag fields between rows, columns, values, and filters areas without writing code |
| 15+ aggregation methods | sum, count, min, max, avg, countunique, counta, median, product, standard deviation, variance, and more |
| Custom aggregation methods | Define custom math functions for domain-specific calculations |
| Interactive filtering | Filter data by field values via UI controls or the filters config property |
| Column sorting | Click column headers to sort; configurable via columnShape.sort |
| Tree mode | Display row data hierarchically with collapsible parent rows via tableShape.tree |
| Frozen (fixed) columns | Freeze row-label columns on the left or right via tableShape.split |
| Total columns and rows | Display grand totals alongside data columns and rows |
| Vertical headers | Configure vertical text in column headers via headerShape |
| Header templates | Apply custom HTML templates to header cells via headerShape.template |
| Cell templates | Render custom HTML in data cells via pivot.template and the render-table event |
| Dataset limits | Cap the number of rows or columns processed to control memory on large datasets |
| Column auto-width | Automatically size column widths to content via columnShape.autoWidth |
| Configurable row and column sizes | Set rowHeight, headerHeight, footerHeight, and columnWidth via tableShape.sizes |
| Export to Excel | Export the full pivot table to .xlsx via the Export.xlsx() method |
| Export to CSV | Export pivot data to .csv via the Export.csv() method |
| Date format configuration | Configure date display format via the locale.formats.dateFormat option |
| Localization | Built-in support for multiple languages via setLocale() |
| Runtime reconfiguration | Update rows, columns, values, and filters at runtime via setConfig() |
| CSS variable theming | Customize colors, borders, and cell highlights via CSS variables |
| Event system | Rich API events including render-table, update-config, add-field, open-filter, and more |
This table highlights key features. For the complete and up-to-date feature list, see the DHTMLX Pivot documentation.
Framework Integration
DHTMLX Pivot works with popular front-end frameworks including React, Angular, Vue, and Svelte. These integration guides apply to both the GPL edition and the commercial editions of DHTMLX Pivot.
Documentation and Resources
- Product page – overview, screenshots, and key features.
- Documentation – getting started, guides, and configuration options.
- API reference – full JavaScript API.
- Live demos and samples – interactive examples of DHTMLX Pivot features.
- Support forum – community Q&A and discussions for DHTMLX Pivot.