
@eleven-labs/nest-profiler-commander
v1.0.0-alpha.3
Published
CLI command collector for @eleven-labs/nest-profiler (via nest-commander)
Downloads
234
Maintainers
 fpasquet
Readme
@eleven-labs/nest-profiler-commander
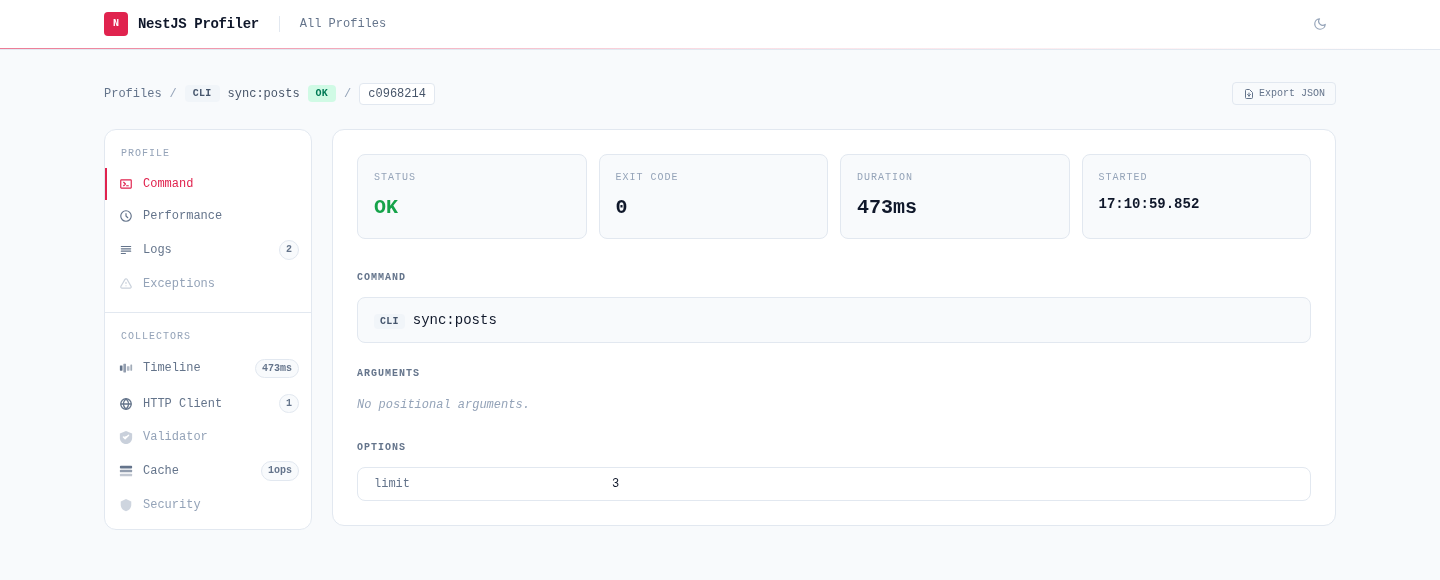
@eleven-labs/nest-profiler-commander profiles CLI commands built with nest-commander — the console equivalent of Symfony's command profiling. Every command run produces a profile that shows up in the web profiler at /_profiler, in a dedicated Commands table and with a built-in Command tab, plus any HTTP, cache, or database activity the command triggered.
Installation
pnpm add @eleven-labs/nest-profiler-commander nest-commanderPeer dependencies: nest-commander ^3.20.0
Setup
The collector wraps every discovered command automatically — you do not change your command classes. Register it in the module you bootstrap with CommandFactory:
import { Module } from '@nestjs/common';
import { ProfilerModule } from '@eleven-labs/nest-profiler';
import { CommanderCollectorModule } from '@eleven-labs/nest-profiler-commander';
import { AppCommand } from './app.command';

@Module({
  imports: [
    // File storage lets the CLI process and the HTTP server share profiles.
    ProfilerModule.forRoot({ isGlobal: true, storageType: 'file', storagePath: '.profiler' }),
    CommanderCollectorModule.forRoot(),
  ],
  providers: [AppCommand],
})
export class CliModule {}
import { CommandFactory } from 'nest-commander';
import { CliModule } from './cli.module';
async function bootstrap(): Promise<void> {
await CommandFactory.run(CliModule, { logger: ['error', 'warn'] });
}
void bootstrap();Run a command, then open /_profiler on your HTTP app (pointed at the same storagePath) to inspect it.
Cross-process storage required. The CLI and the web server are separate processes, so command profiles are only visible in the server when both share the backing store — use
storageType: 'file'(or a Redis/DB adapter). In-memory storage is per-process; the profiler logs a warning if you profile a command against it.
What it collects
Each command run sets request.command on the profile:
| Field | Description |
| ----------- | ---------------------------------------------- |
| name | Command name from @Command({ name }) |
| arguments | Positional parameters (passedParams) |
| options | Parsed flag options |
| exitCode | 0 on success, 1 when the command threw |
| success | Whether the command completed without throwing |
Duration and timing come from the profile's standard performance data, and a thrown error appears in the Exceptions tab. Because the command body runs inside the profiler's CLS context, other collectors (e.g. @eleven-labs/nest-profiler-axios, @eleven-labs/nest-profiler-cache) capture the work a command performs and contribute their own panels.
How it works
At application bootstrap the module discovers every provider that is an instance of nest-commander's CommandRunner and wraps its run() method. The wrapper synthesises a profile (request.method = 'CLI', request.url = '<command> <args>', and request.command), opens a CLS context, runs the original command, then runs all collectors and saves the profile through the profiler's shared storage. The profiler UI renders command profiles in a dedicated Commands table and a built-in Command tab — no extra setup in your HTTP app. nest-commander is an optional peer dependency: when it is not installed the module is a no-op.
Part of the nest-profiler toolkit · Powered & maintained by Eleven Labs