
@eleven-labs/nest-profiler-mikro-orm
v1.0.0-alpha.3
Published
MikroORM query collector for @eleven-labs/nest-profiler
Maintainers
 fpasquet
Readme
@eleven-labs/nest-profiler-mikro-orm
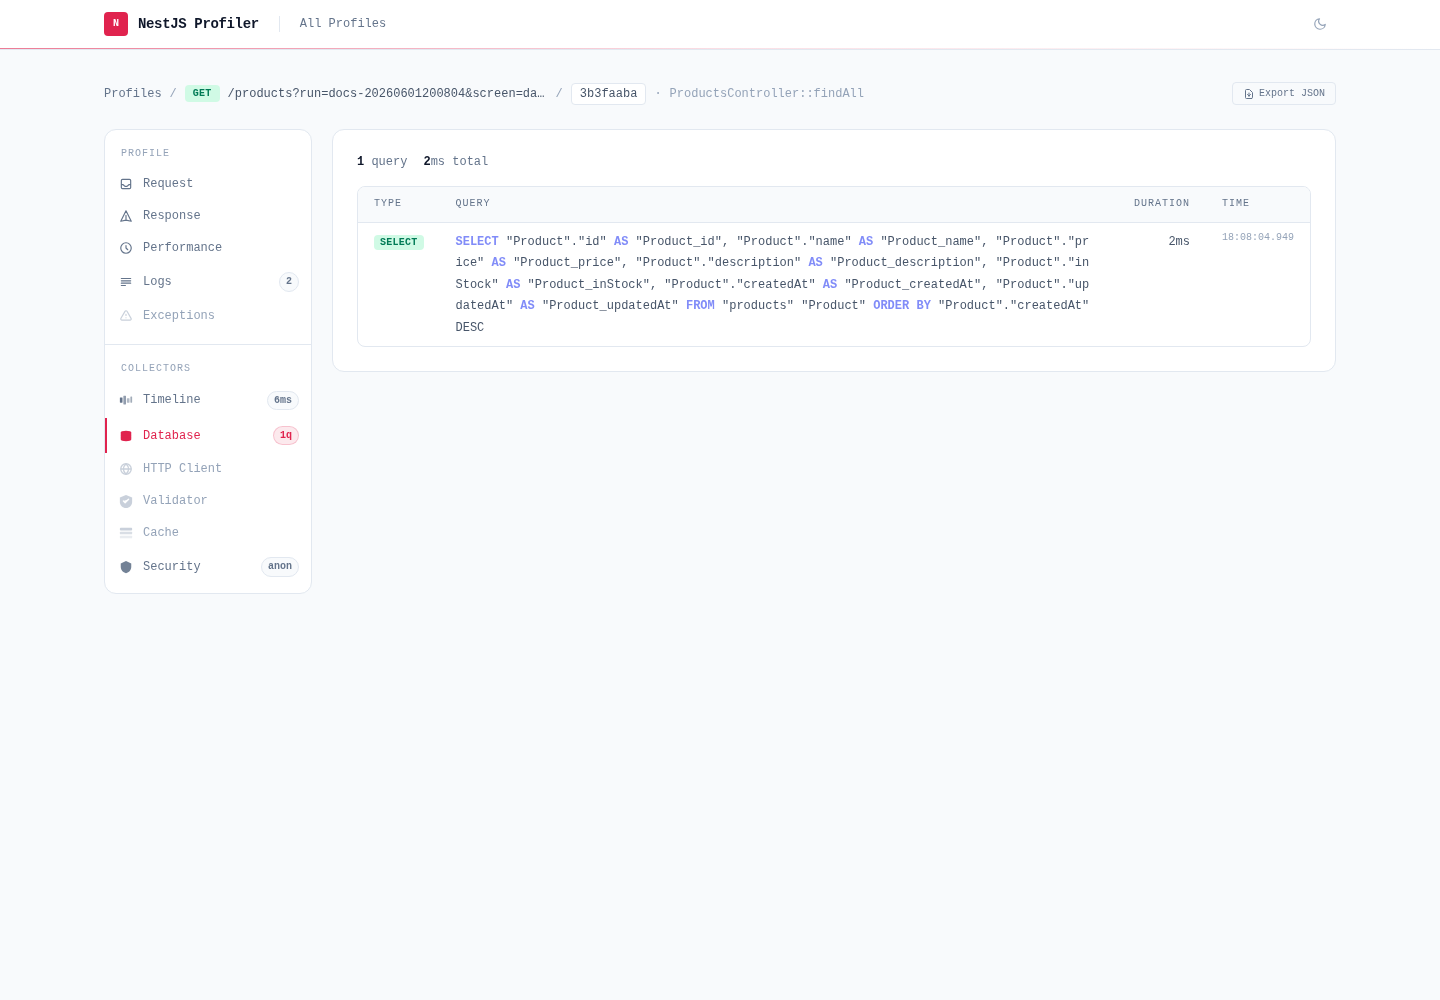
@eleven-labs/nest-profiler-mikro-orm captures every SQL query executed by MikroORM during a profiled execution and displays them in a dedicated Database panel.
Installation
pnpm add @eleven-labs/nest-profiler-mikro-ormPeer dependencies: @mikro-orm/core ^7.0.0, @mikro-orm/nestjs ^7.0.0
Setup
Register MikroOrmCollectorModule after MikroOrmModule in your root module. No extra MikroORM
configuration is required — the collector wraps the ORM logger automatically:
import { Module } from '@nestjs/common';
import { MikroOrmModule } from '@mikro-orm/nestjs';
import { PostgreSqlDriver } from '@mikro-orm/postgresql';
import { MikroOrmCollectorModule } from '@eleven-labs/nest-profiler-mikro-orm';

@Module({
  imports: [
    MikroOrmModule.forRoot({
      driver: PostgreSqlDriver,
      // ...your connection options
    }),
    MikroOrmCollectorModule.forRoot({
      slowQueryThreshold: 100, // ms — queries above this are highlighted (default: 100)
    }),
  ],
})
export class AppModule {}
What it collects
For each SQL query executed during a request:
| Field | Description |
| ------------ | -------------------------------------------------- |
| sql | The SQL query string (with keyword highlighting) |
| parameters | Bound parameters |
| duration | Execution time in ms (from MikroORM's took) |
| type | SELECT, INSERT, UPDATE, DELETE, OTHER |
| isSlow | true if duration ≥ slowQueryThreshold |
| startedAt | Unix timestamp |
| error | Set when MikroORM reports the query at error level |
Slow queries are highlighted in red in the panel.
Toolbar badge
The toolbar badge shows: {n}q (e.g., 5q). When slow queries are present: 5q (2 slow).
How it works
The collector wraps MikroORM's Logger.logQuery at module initialization (OnModuleInit).
MikroORM's SQL connection always measures execution time and calls logQuery with the query, its
parameters and the elapsed took; the collector pushes a query entry into the active request
profile (resolved via nestjs-cls) and lets the original
logger handle console output only if you had query logging enabled. Queries executed outside a
request context (startup, background jobs) are silently ignored.
This captures all queries issued through the EntityManager, repositories and the QueryBuilder.
Part of the nest-profiler toolkit · Powered & maintained by Eleven Labs