
@eleven-labs/nest-profiler-typeorm
v1.0.0-alpha.3
Published
TypeORM query collector for @eleven-labs/nest-profiler
Maintainers
 fpasquet
Readme
@eleven-labs/nest-profiler-typeorm
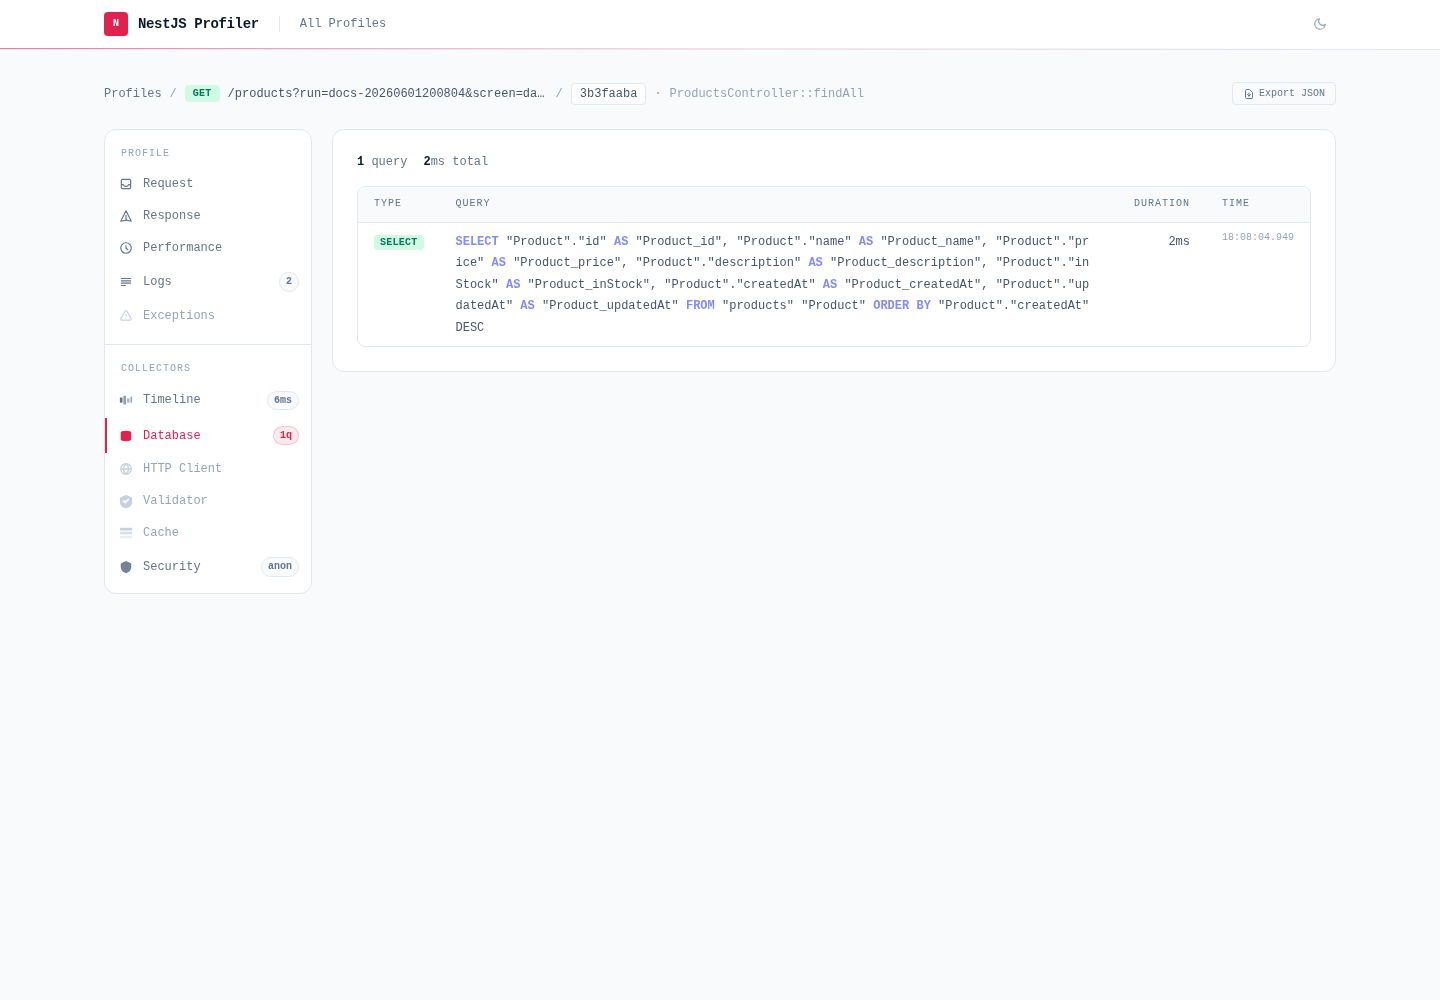
@eleven-labs/nest-profiler-typeorm captures every SQL query executed by TypeORM during a profiled execution and displays them in a dedicated Database panel.
Installation
pnpm add @eleven-labs/nest-profiler-typeormPeer dependencies: typeorm ^0.3.0, @nestjs/typeorm ^11.0.0
Setup
import { TypeOrmModule } from '@nestjs/typeorm';
import { TypeOrmCollectorModule } from '@eleven-labs/nest-profiler-typeorm';
import { DataSource } from 'typeorm';

@Module({
  imports: [
    TypeOrmModule.forRoot({ ... }),
    TypeOrmCollectorModule.forRoot({
      dataSource,            // your DataSource instance
      slowQueryThreshold: 100, // ms — queries above this are highlighted (default: 100)
    }),
  ],
})
export class AppModule {}
Since DataSource is not available at module declaration time, use forRootAsync:
TypeOrmCollectorModule.forRootAsync({
  inject: [DataSource],
  useFactory: (dataSource: DataSource) => ({ dataSource, slowQueryThreshold: 50 }),
}),
What it collects
For each SQL query executed during a request:
| Field | Description |
| ------------ | ------------------------------------------------ |
| sql | The SQL query string (with keyword highlighting) |
| parameters | Bound parameters |
| duration | Execution time in ms |
| type | SELECT, INSERT, UPDATE, DELETE, OTHER |
| isSlow | true if duration ≥ slowQueryThreshold |
| startedAt | Unix timestamp |
| error | Error message if the query failed |
Slow queries are highlighted in red in the panel.
Toolbar badge
The toolbar badge shows: {n}q (e.g., 5q). When slow queries are present: 5q (2 slow).
How it works
The collector patches dataSource.driver.query at module initialization to wrap every query execution with timing. The patch is transparent — TypeORM behavior is unchanged.
Part of the nest-profiler toolkit · Powered & maintained by Eleven Labs