
@feedzai/repo-analyzer
v0.1.46
Published
Analises a frontend repo to get consistency metrics


Keywords
Readme
Frontend Repo Analyzer
This small tool can analyze Git repositories and report metrics about them, these will then be sent to Elastic/Kibana or optionally to file or the console. This tool was designed to be plugable, can work with an unlimited number of repositories and metrics.
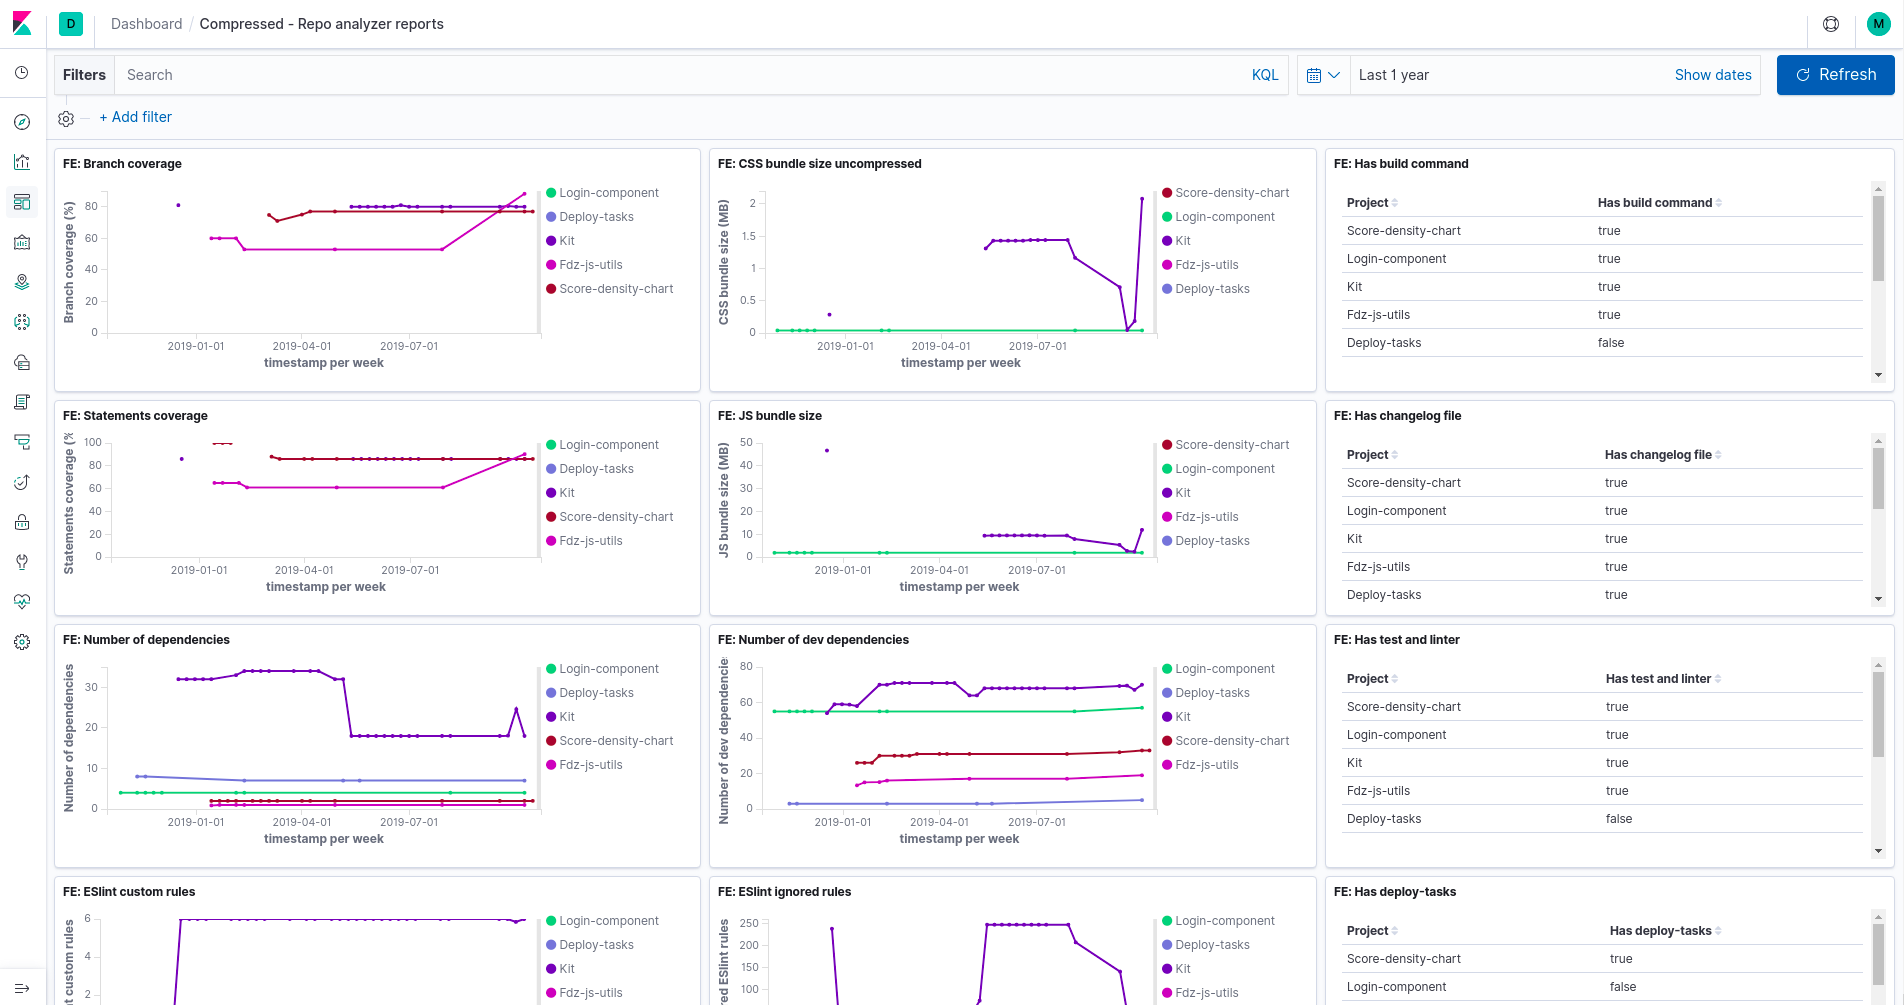
Table of Contents
- Installation and usage
- Configuration
- Add custom metrics
- Custom config file
- Reporters
- Arguments
- FAQ
- License
Installation and Usage
Prerequisites: Node.js (+8.x), npm version +6.X.
To install run:
$ npm i @feedzai/repo-analyzer --save-dev
After installing the tool, we recommend that you add it to the npm scripts:
"analyze": "repo-analyzer --username=john.doe --password=password"
The username and password parameters will be used to connect to Elasticsearch.
More detail on this configuration can be found in the next section.
The first time you run the tool it will create a .repo-analyzer file. We recommend the configuration to be on a separate repository and be linked to in .repo-analyzer. The default file will point to the feedzai configuration. If you want to use it you need to run:
$ npm i @feedzai/feedzai-config --save-dev
For details on what metrics are available here, plese consult the documentation in the repo.
We recommend configuring the tool to run in CI at each commit.
It is also recommend to run the tool in the "history" mode to calculate historical data and have better dashboards (more details on that below).
Configure Elasticsearch/Kibana
In order to use the whole potencial provided by the tool, we recommend you to use elasticsearch and kibana. They will provide a pretty good way to store and visualize your data.
You can find the complete configuration guide here
One important detail: the Feedzai configuration assumes that your Kibana instance is on your local machine.
History mode
The tool is capable of collecting data about the project‘s history based on the commit history. This feature may be useful if you want to know how your project has varied over time, and what impact some dependency made in your bundesize for example.
In order to analyze the project’s history you just need to pass the “--history” flag into the tool:
$ npm run analyze -- --history
This will calculate the metrics in each commit. For large repos it's possible to pass a parameter that will do an exponential sampling as time goes back:
$ npm run analyze -- --history --factor=1
Creating a custom configuration
In some cases you might want to implement custom metrics or have a custom configuration.
Currently the tool gets its configuration from an npm package, similarly to eslint.
The only requirements for this configuration project is that it returns an array with the metrics you want to use and some extra configuration. See this repo for an example.
In order to use this custom configuration you must add the name of the package to the .repo-analyzer file and add your configuration as a dependency to your local project.
Creating new metrics
When you create a new metric, you must implement the base metric and his main 3 methods ( info, verify, execute ). Both verify and execute are async.
- info(): returns an object containing the metric name and group. This group can be modified in . Grouping metrics can be useful when you have a lot of metrics.
- verify(): returns a boolean and specifies whether its possible to run this metric for a given repository or not. For example, when calculation the coverage, if the repo does not have jest, it's impossible to calculate the metric therefore verify() should return false.
- execute(): returns and object with the result for the metric being calculated. In this method occurs the calculation for the metric.
- schema(): returns the schema configuration sent to Kibana/Elastic. If you don't to send the metrics to Kibana it is not necessary to implement this method.
Examples here.
Reporters
Besides sending the data to Kibana it is also possible to output to a json file or to console.
See examples of how to do that here.
Arguments
- username=elastic Elastic's username required to send elasticsearch reports to protected instances.
- password=password Elastic's password needed to send elasticsearch reports. Only valid when using the username flag.
- factor=1 Factor used to jump commits when calculating project's history. The bigger the factor the bigger the jumps.
- history when used will calculate the history for the repos with "calculate-history": true in the config file.
- elastic creates elasticsearch's indexes automatically based on the metrics loaded and its schema.
- commits=1,2,3 analyzes a group of commits, this flag is only valid when analyzing the history
- from=1 the commit to start analyze, only valid when used with to when running on history mode.
- to=10 the commit where it stop calculating, only valid when used with from and in history mode.
License
MIT