
@fernir10/leaflet.heatmap
v1.0.7
Published
GL-based heatmap plugin for Leaflet
Downloads
85

Readme
leaflet.heatmap
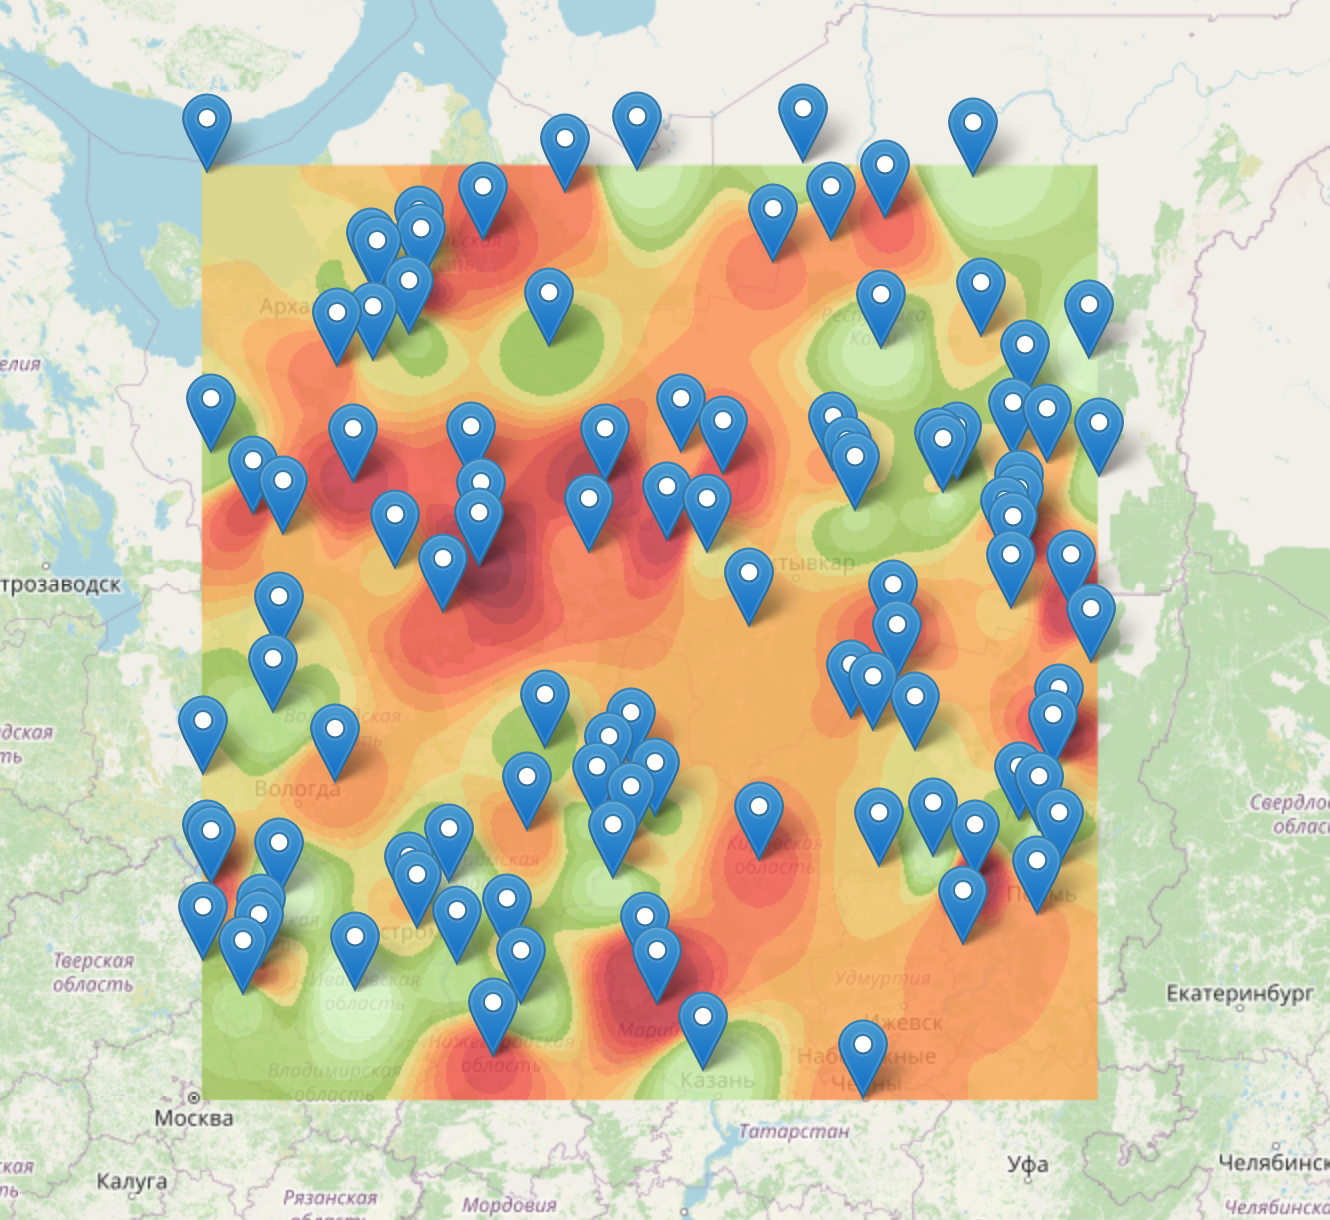
GL-based heatmap plugin for Leaflet. Allows you to visualize a heat map of huge arrays of points with WebGL.
Features
- Visualize large datasets with WebGL
- Supports IDW (Inverse Distance Weighting) interpolation
- Smooth transitions and animations
- Easy integration with Leaflet maps
[## Demo
Check out the live demo: https://fernir.github.io/leaflet.heatmap ](https://github.com/Fernir/chartjs-sync-plugin/raw/master/pscr.png)
Installation
npm install @fernir10/leaflet.heatmapUsage
import L from 'leaflet';
import 'leaflet/dist/leaflet.css';
import heatmap from '@fernir10/leaflet.heatmap';

const map = L.map('map').setView([55.75, 37.61], 10);

L.tileLayer('https://{s}.tile.openstreetmap.org/{z}/{x}/{y}.png', {
  attribution: '© OpenStreetMap'
}).addTo(map);

const points = Array.from({ length: 100 }, () => [55.7 + Math.random() * 0.1, 37.55 + Math.random() * 0.1, Math.floor(Math.random() * 30)]);

const lats = points.map(p => p[0]);
const lngs = points.map(p => p[1]);
const minLat = Math.min(...lats);
const maxLat = Math.max(...lats);
const minLng = Math.min(...lngs);
const maxLng = Math.max(...lngs);
const polygon = [[minLat, minLng], [minLat, maxLng], [maxLat, maxLng], [maxLat, minLng], [minLat, minLng]];

heatmap(points, { polygon: [polygon] }).addTo(map);

map.fitBounds(L.polygon(polygon).getBounds());

points.forEach(([lat, lng, value]) => L.marker([lat, lng]).bindPopup(`Value: ${value}`).addTo(map));
License
MIT © Nikolay Alekseev