
@firstpick/pi-extension-stats
v0.2.7
Published
Token and cost usage analytics command for Pi session history.
Maintainers
 firstpick
Readme
pi-extension-stats
Token and cost analytics for Pi session history.
What it does
- Parses local Pi session
.jsonlfiles for the current workspace. - Aggregates usage by UTC day.
- Displays compact daily token bars and cost bars with totals.
- Shows input/output/cache breakdown, estimated initial prompt input (
PI: X tok) with source split-up, cache hit rate, estimated cache savings, cost burn rate, and top model usage. - Highlights highest-cost day, projected 30-day cost, most expensive sessions, and model cost efficiency.
Install
pi install npm:@firstpick/pi-extension-statsConfiguration
No required configuration.
Commands
/stats [days|all]— show token usage dashboard (default: last 14 days)./stats tokens— show current context token breakdown by source/type./stats-pi— show export-backed estimated initial prompt input token breakdown. It creates a temporary Pi HTML export, decodes its embedded session data, then counts Pi's system prompt text, active provider-level tool schemas, framing overhead, and optional historical calibration (falling back to live context data if export is unavailable)./stats-pi detailed— add a concise detail view of the exported initial prompt snapshot: active tool schemas, available-tool prompt entries, skills, context files, metadata, and estimate components./calibrate— start an isolated calibration session with a fixed probe prompt, then update/stats-piand the footerPI: X tokestimate from the first assistant response usage./calibrate currentreuses the current branch if it already has a suitable first-turn usage sample./stats-last [days|all]— show non-zero daily usage graph./stats-most-expense [days|all]— show most expensive sessions./stats-model-compare [days|all]— show model token/cost comparison./stats-cost-trend [days|all]— show cost trend and projections./stats-cache [days|all]— show cache efficiency and token mix.
Prompt input estimate
/stats-pi and the PI: ~X tok value in /stats estimate the full initial model input, not just raw prompt text. /stats-pi prefers Pi's own HTML export data for the exact exported system prompt and active tool definitions; it falls back to live context data when a temporary export cannot be produced, so it can still be run before any LLM prompt in a fresh session.
The token calculation is intentionally provider-agnostic:
promptTextTokens = weighted text estimate of the system prompt (from exported session data when available)
toolSchemaTokens = weighted text estimate of active tool definitions JSON (from exported session data when available)
framingTokens = conservative message/request framing allowance
baseEstimate = promptTextTokens + toolSchemaTokens + framingTokens
estimatedInitialInput = baseEstimate × historicalCalibrationMultiplier
The historical multiplier is learned opportunistically from future sessions by comparing the pre-call estimate with the provider-reported first assistant usage.input + usage.cacheRead + usage.cacheWrite after subtracting the first user prompt estimate. /calibrate performs the same calculation on demand by opening an isolated session and sending a fixed probe prompt; /calibrate current can reuse the current branch once its first assistant response has usage data. Without samples, /stats-pi reports an uncalibrated estimate and a conservative range. Provider-reported usage in Pi session JSONL remains the authoritative post-call value.
Tools
None.
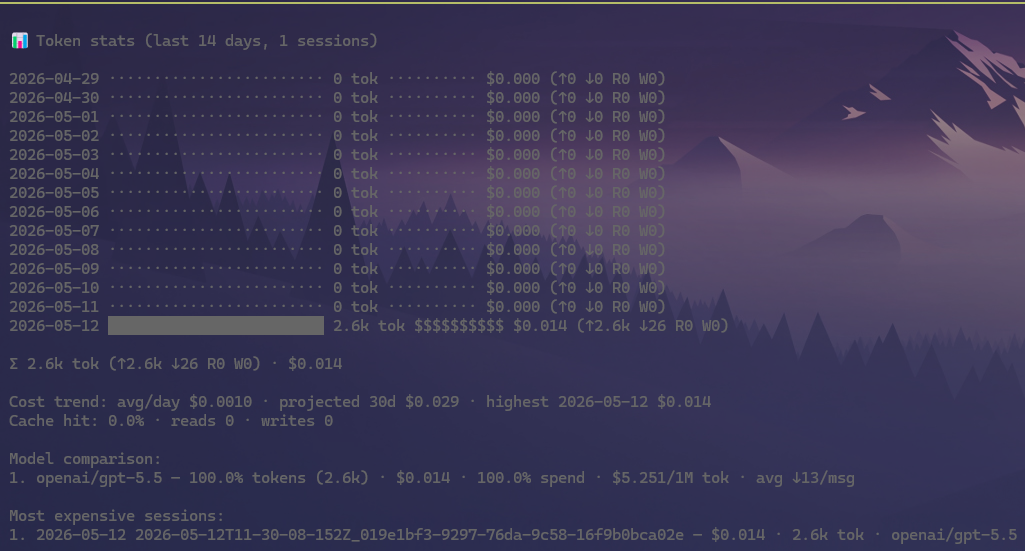
Example view
/stats 7
Token usage — last 7 days

May 06  in 18k  out 4k   $0.11  ████
May 07  in 42k  out 9k   $0.29  █████████
May 08  in 12k  out 2k   $0.06  ██

Total: 72k input, 15k output, $0.46
Cache hit rate: 38%
Use it to understand which days, sessions, and models are driving token volume and cost.