
@getdashfy/ext-github
v0.2.1
Published
GitHub extension for Dashfy - Display GitHub data with beautiful widgets and charts

Maintainers
 breno.polanski
Readme
@getdashfy/ext-github


GitHub extension for Dashfy - Display GitHub data with beautiful widgets and charts.
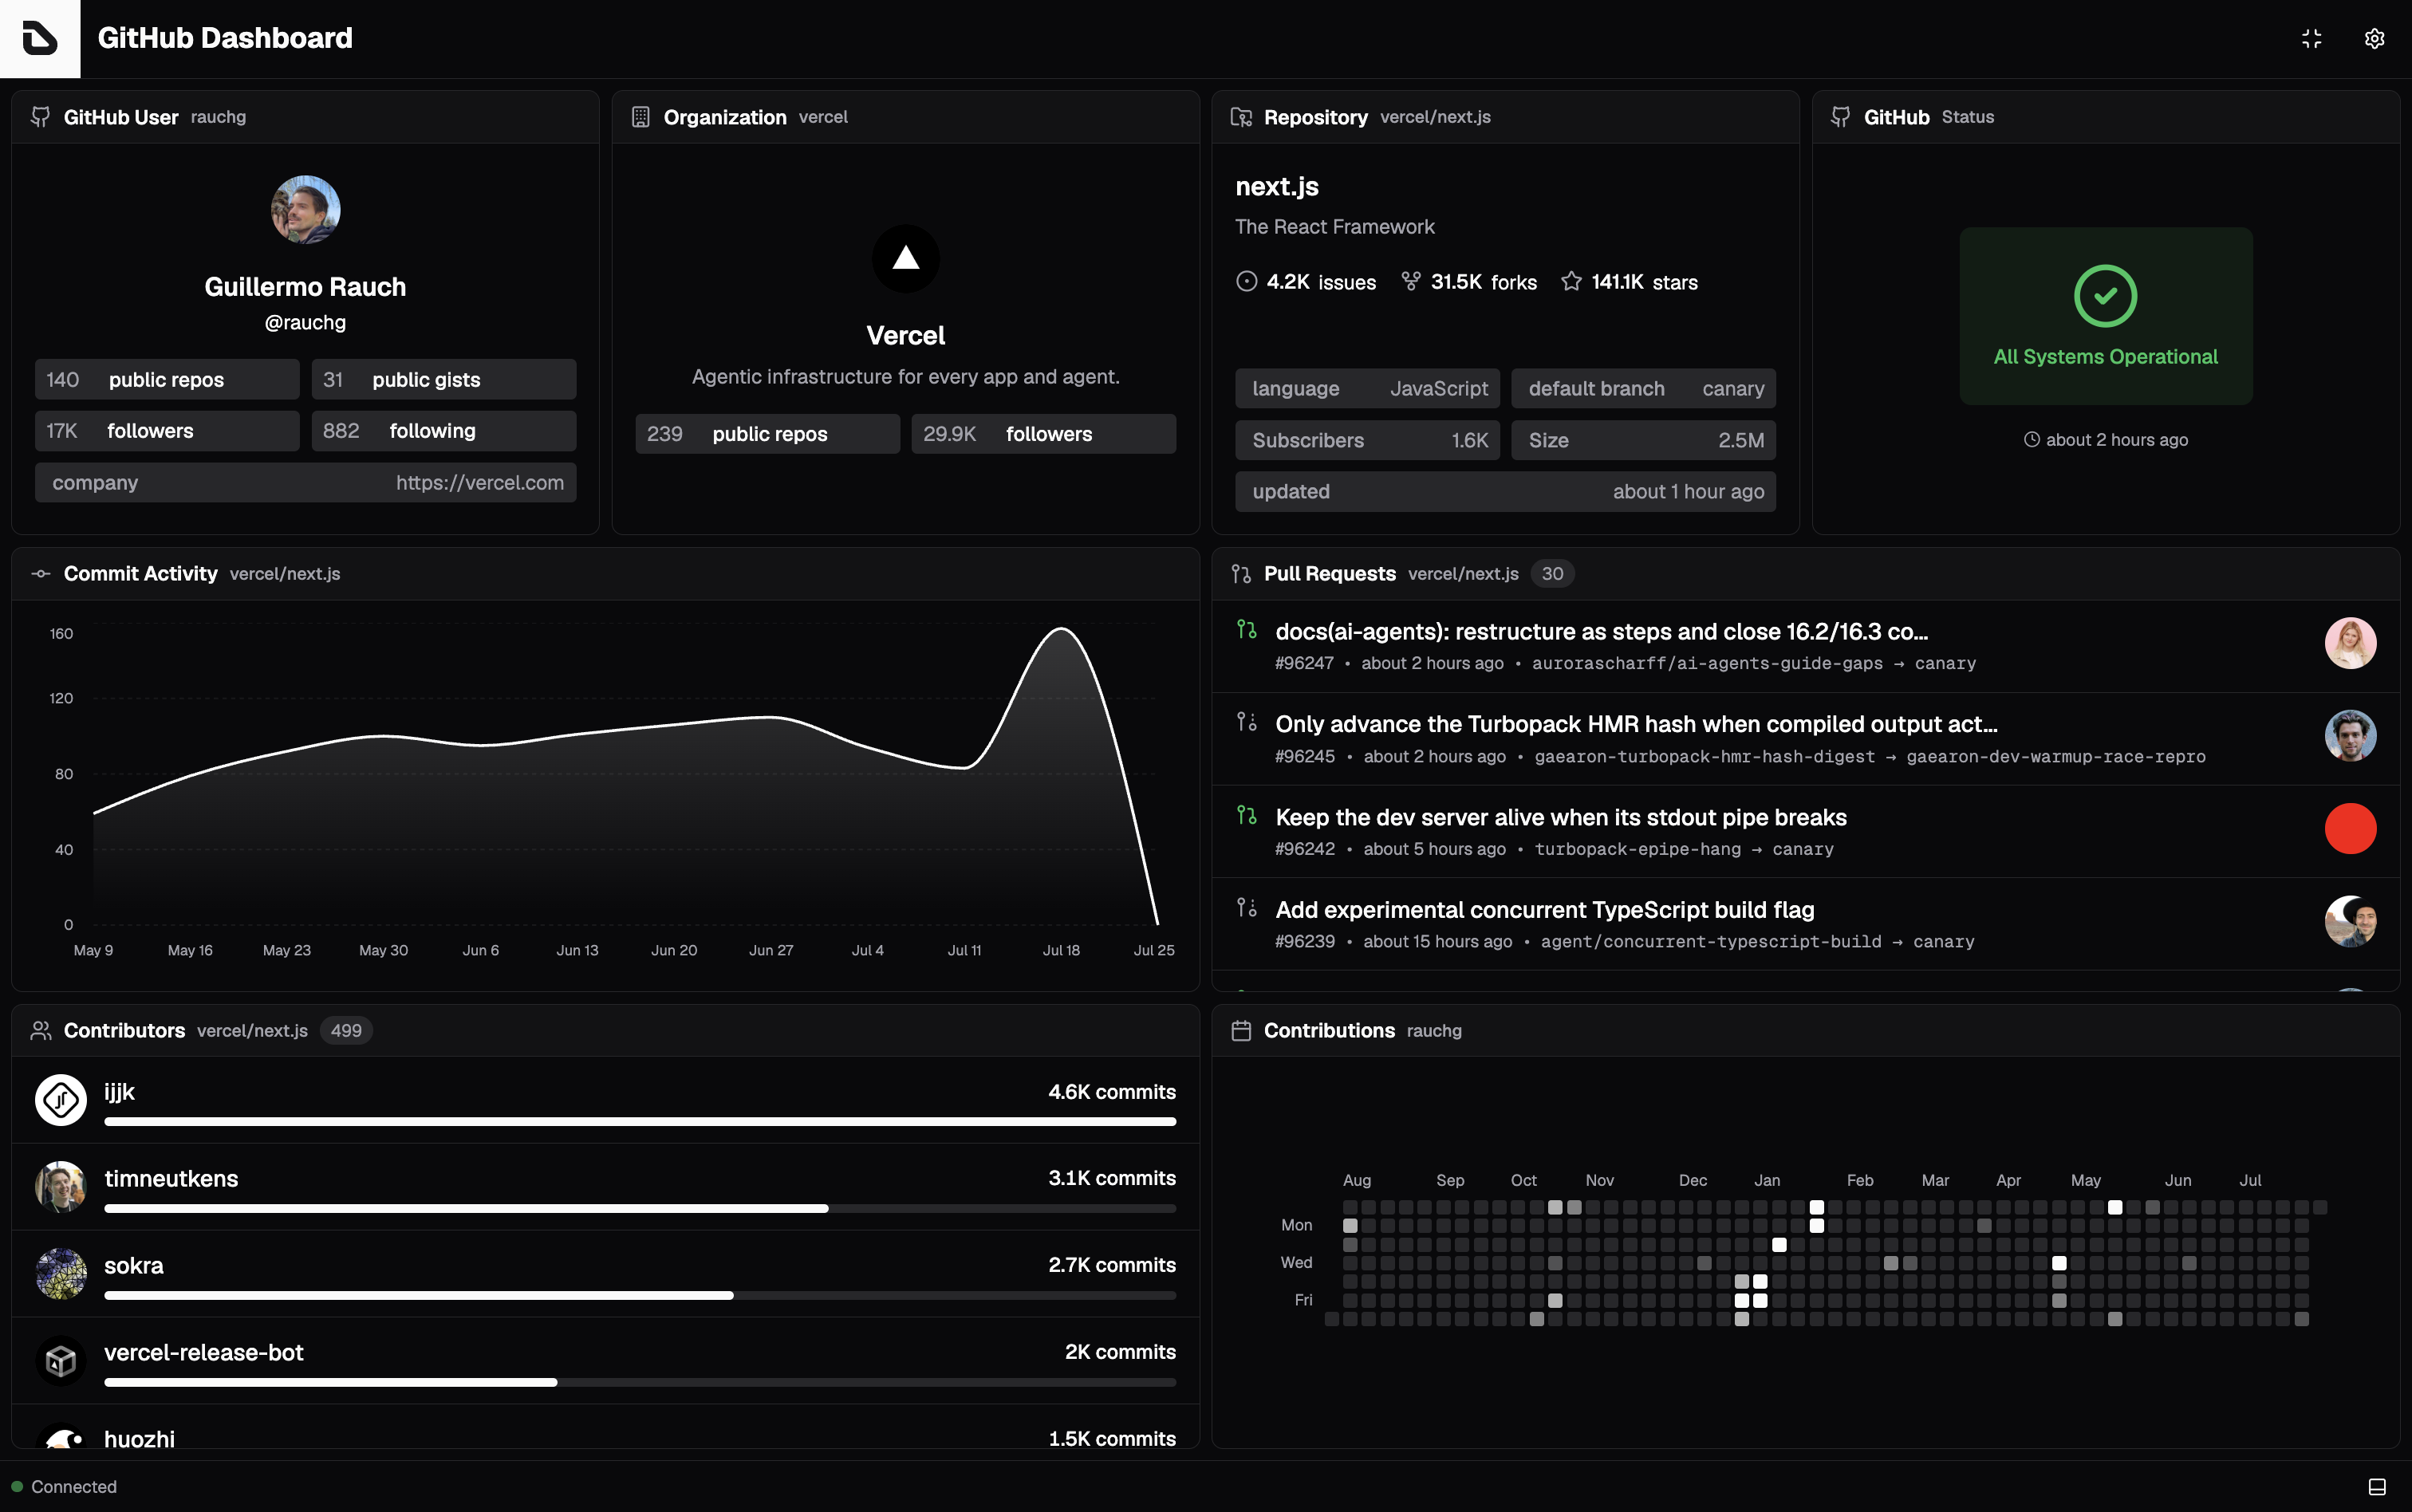
This extension provides widgets to visualize GitHub repositories, users, organizations, pull requests, branches, contributions, and more.
Features
- 📊 Repository stats: Display repository information, stars, forks, issues, and activity
- 👥 User & organization badges: Show user and organization profiles
- 🔀 Pull requests & branches: Monitor open PRs and active branches
- 📈 Charts & analytics: Visualize commit activity, traffic views, and clones
- 👨💻 Contributors: Display top contributors with statistics
- 🗓️ Contribution heatmap: GitHub-style contribution calendar (Gitmap)
- 🟢 GitHub status: Monitor GitHub's system status
- ⚡ Real-time updates: Automatic data refresh via WebSocket subscriptions
- 🎨 Theme support: Works with all Dashfy themes (light/dark mode)
Installation
Install with your favorite package manager:
npm
npm install @getdashfy/ext-githubpnpm
pnpm add @getdashfy/ext-githubyarn
yarn add @getdashfy/ext-githubbun
bun add @getdashfy/ext-githubQuick start
1. Server setup
Register the GitHub API client in your Dashfy server (dashfy.server.ts):
import { Dashfy } from '@getdashfy/server'
import { createGitHubClient } from '@getdashfy/ext-github/client'

// Create a new Dashfy server instance
const dashfy = new Dashfy()

// Load dashboard configuration
await dashfy.configureFromFile('./dashfy.config.yml')

// Register GitHub API
// Get your token at: https://github.com/settings/tokens
// Set it with: export GITHUB_TOKEN=ghp_xxxxxxxxxxxxxxxxxxxxxxxxxxxxx in .env file
dashfy.registerApi(
  'github',
  createGitHubClient({
    token: process.env.GITHUB_TOKEN, // Optional but recommended
  }),
)

// Start server
await dashfy.start()
2. Client setup
Register GitHub widgets in your React application (App.tsx):
import { WidgetRegistry } from '@getdashfy/ui'
import {
  Branches,
  CommitActivityLine,
  ContributorsStats,
  Gitmap,
  OrgBadge,
  PullRequests,
  RepoBadge,
  Status,
  TrafficClonesHistogram,
  TrafficViewsHistogram,
  UserBadge,
} from '@getdashfy/ext-github'

// Register GitHub extension
WidgetRegistry.addExtension('github', {
  Branches,
  CommitActivityLine,
  ContributorsStats,
  Gitmap,
  OrgBadge,
  PullRequests,
  RepoBadge,
  Status,
  TrafficClonesHistogram,
  TrafficViewsHistogram,
  UserBadge,
})
3. Dashboard configuration
Add GitHub widgets to your dashboard configuration (dashfy.config.yml):
dashboards:
  - title: GitHub Dashboard
    columns: 3
    rows: 2
    widgets:
      - extension: github
        widget: RepoBadge
        repository: react/react
        x: 0
        y: 0
        columns: 1
        rows: 1

      - extension: github
        widget: PullRequests
        repository: vercel/next.js
        state: open
        x: 1
        y: 0
        columns: 2
        rows: 1
GitHub API configuration
Authentication
While authentication is optional, it's highly recommended to provide a GitHub personal access token to:
- Access private repositories
- Increase API rate limits (5,000 requests/hour vs 60 requests/hour)
- Access traffic data (requires push access)
Creating a personal access token
- Go to GitHub Settings → Tokens
- Click "Generate new token (classic)"
- Select scopes based on your needs:
public_repo- Access public repositoriesrepo- Access private repositoriesread:org- Read organization data
- Copy the generated token
Configuration options
createGitHubClient({
  // GitHub API base URL (useful for GitHub Enterprise)
  baseUrl: 'https://api.github.com', // default

  // Personal access token for authentication
  token: process.env.GITHUB_TOKEN,

  // Request timeout in milliseconds
  timeout: 10_000, // default
})
Environment variables
You can use environment variables for configuration:
GITHUB_TOKEN=ghp_your_token_herecreateGitHubClient({
token: process.env.GITHUB_TOKEN,
})GitHub enterprise
To use with GitHub Enterprise, set the baseUrl:
createGitHubClient({
  baseUrl: 'https://github.company.com/api/v3',
  token: process.env.GITHUB_ENTERPRISE_TOKEN,
})
API endpoints
createGitHubClient registers the endpoints below. Widgets subscribe to them through the endpoint parameter, and you can call any of them from your own custom widgets.
| Endpoint | Parameters | Returns |
| ------------------- | ----------------------- | ----------------------------------------------- |
| user | user | User profile |
| organization | organization | Organization profile |
| repository | repository | Repository details and stats |
| branches | repository, perPage | Branches sorted by most recent commit |
| pullRequests | repository, state | Pull requests filtered by state |
| issues | repository, state | Issues filtered by state |
| contributorsStats | repository | Contributors with commit counts |
| commitActivity | repository | Weekly commit totals for the last 52 weeks |
| trafficViews | repository | Views for the last 14 days (needs push access) |
| trafficClones | repository | Clones for the last 14 days (needs push access) |
| status | - | GitHub platform status |
| contributions | user | Contribution calendar data |
issues has no built-in widget yet — it is available for custom widgets.
Available widgets
Badges
RepoBadge
Display repository information with stats (stars, forks, issues).
Parameters:
| Parameter | Type | Required | Default | Description |
| ------------ | ------ | -------- | ------------ | --------------------------------- |
| repository | string | yes | - | Repository in format "owner/repo" |
| title | string | no | "Repository" | Custom widget title |
| api | string | no | "github" | API subscription ID |
| endpoint | string | no | "repository" | API endpoint to call |
Example:
- extension: github
  widget: RepoBadge
  repository: react/react
  title: React Repository
  columns: 1
  rows: 1
UserBadge
Display GitHub user profile information.
Parameters:
| Parameter | Type | Required | Default | Description |
| ---------- | ------ | -------- | ------------- | -------------------- |
| user | string | yes | - | GitHub username |
| title | string | no | "GitHub User" | Custom widget title |
| api | string | no | "github" | API subscription ID |
| endpoint | string | no | "user" | API endpoint to call |
Example:
- extension: github
  widget: UserBadge
  user: torvalds
  columns: 1
  rows: 1
OrgBadge
Display GitHub organization information.
Parameters:
| Parameter | Type | Required | Default | Description |
| -------------- | ------ | -------- | -------------- | -------------------- |
| organization | string | yes | - | Organization name |
| title | string | no | "Organization" | Custom widget title |
| api | string | no | "github" | API subscription ID |
| endpoint | string | no | "organization" | API endpoint to call |
Example:
- extension: github
  widget: OrgBadge
  organization: facebook
  columns: 1
  rows: 1
Repository data
Branches
Display repository branches with commit authors and dates.
Parameters:
| Parameter | Type | Required | Default | Description |
| ------------ | ------ | -------- | ---------- | --------------------------------- |
| repository | string | yes | - | Repository in format "owner/repo" |
| perPage | number | no | 30 | Number of branches to fetch |
| title | string | no | "Branches" | Custom widget title |
| api | string | no | "github" | API subscription ID |
| endpoint | string | no | "branches" | API endpoint to call |
Example:
- extension: github
  widget: Branches
  repository: vercel/next.js
  columns: 2
  rows: 1
PullRequests
Display repository pull requests with authors and status.
Parameters:
| Parameter | Type | Required | Default | Description |
| ------------ | --------------------------- | -------- | --------------- | --------------------------------- |
| repository | string | yes | - | Repository in format "owner/repo" |
| state | "open" | "closed" | "all" | no | "open" | Pull request state filter |
| title | string | no | "Pull Requests" | Custom widget title |
| api | string | no | "github" | API subscription ID |
| endpoint | string | no | "pullRequests" | API endpoint to call |
Example:
- extension: github
  widget: PullRequests
  repository: react/react
  state: open
  columns: 2
  rows: 1
Charts & Analytics
Each chart ships in three flavours. The Line and Histogram widgets are thin wrappers that preset the chart style, while the base component accepts a type of "area" or "bar":
| Base component | Area variant | Bar variant |
| --------------------- | -------------------- | ------------------------- |
| CommitActivityChart | CommitActivityLine | CommitActivityHistogram |
| TrafficViewsChart | TrafficViewsLine | TrafficViewsHistogram |
| TrafficClonesChart | TrafficClonesLine | TrafficClonesHistogram |
All three accept the same parameters, so the tables below apply to every variant.
CommitActivityLine
Display commit activity over the last year as an area chart.
Parameters:
| Parameter | Type | Required | Default | Description |
| ------------ | ------ | -------- | ----------------- | --------------------------------- |
| repository | string | yes | - | Repository in format "owner/repo" |
| title | string | no | "Commit Activity" | Custom widget title |
| api | string | no | "github" | API subscription ID |
| endpoint | string | no | "commitActivity" | API endpoint to call |
Example:
- extension: github
  widget: CommitActivityLine
  repository: nodejs/node
  columns: 2
  rows: 1
ContributorsStats
Display top contributors with commit statistics.
Parameters:
| Parameter | Type | Required | Default | Description |
| ------------ | ------ | -------- | ------------------- | --------------------------------- |
| repository | string | yes | - | Repository in format "owner/repo" |
| title | string | no | "Contributors" | Custom widget title |
| api | string | no | "github" | API subscription ID |
| endpoint | string | no | "contributorsStats" | API endpoint to call |
Example:
- extension: github
  widget: ContributorsStats
  repository: vercel/next.js
  columns: 2
  rows: 1
TrafficViewsHistogram
Display repository traffic views over the last 14 days as a bar chart (requires push access).
Parameters:
| Parameter | Type | Required | Default | Description |
| ------------ | ------ | -------- | -------------- | --------------------------------- |
| repository | string | yes | - | Repository in format "owner/repo" |
| title | string | no | "Visitors" | Custom widget title |
| api | string | no | "github" | API subscription ID |
| endpoint | string | no | "trafficViews" | API endpoint to call |
Example:
- extension: github
  widget: TrafficViewsHistogram
  repository: myorg/myrepo
  columns: 2
  rows: 1
TrafficClonesHistogram
Display repository traffic clones over the last 14 days as a bar chart (requires push access).
Parameters:
| Parameter | Type | Required | Default | Description |
| ------------ | ------ | -------- | --------------- | --------------------------------- |
| repository | string | yes | - | Repository in format "owner/repo" |
| title | string | no | "Clones" | Custom widget title |
| api | string | no | "github" | API subscription ID |
| endpoint | string | no | "trafficClones" | API endpoint to call |
Example:
- extension: github
  widget: TrafficClonesHistogram
  repository: myorg/myrepo
  columns: 2
  rows: 1
User data
Gitmap
Display GitHub contribution heatmap (similar to GitHub's contribution graph).
Parameters:
| Parameter | Type | Required | Default | Description |
| ---------- | ------ | -------- | --------------- | -------------------- |
| user | string | yes | - | GitHub username |
| title | string | no | "Contributions" | Custom widget title |
| api | string | no | "github" | API subscription ID |
| endpoint | string | no | "contributions" | API endpoint to call |
Example:
- extension: github
  widget: Gitmap
  user: torvalds
  columns: 3
  rows: 1
System status
Status
Display GitHub's current system status.
Parameters:
| Parameter | Type | Required | Default | Description |
| ---------- | ------ | -------- | -------- | -------------------- |
| title | string | no | "GitHub" | Custom widget title |
| api | string | no | "github" | API subscription ID |
| endpoint | string | no | "status" | API endpoint to call |
Example:
- extension: github
  widget: Status
  columns: 1
  rows: 1
API rate limits
GitHub API has rate limits that vary based on authentication:
| Authentication | Rate Limit | | -------------- | ------------------- | | No token | 60 requests/hour | | With token | 5,000 requests/hour |
Recommendations:
- Always use a personal access token in production
- Monitor rate limit usage in the Dashfy console panel
- Consider caching strategies for high-frequency dashboards
Troubleshooting
"API rate limit exceeded"
Solution: Add a GitHub personal access token to your configuration.
"Resource not accessible by integration"
Solution: Ensure your token has the required scopes (e.g., repo for private repositories).
Traffic widgets showing errors
Solution: Traffic data requires push access to the repository. Ensure your token has the necessary permissions.
Contribution heatmap not loading
Solution: The Gitmap widget uses a third-party API (github-contributions-api) which may have its own rate limits.
Contributing
Contributions are welcome. For issues and pull requests related to the extension, use the dashfy/dashfy-ext-github repository. Framework contributions belong in dashfy/dashfy.
Community
Join the community on Dashfy's Discord server to discuss the project, ask questions, or get help.
Join the conversation on X (Twitter) and follow @dashfydev for updates and announcements.
License
This project is licensed under the AGPL-3.0 License - see the LICENSE file for details.