
@getdashfy/ext-system
v0.2.1
Published
System extension for Dashfy - Monitor CPU, memory, disk, network, and processes

Maintainers
 breno.polanski
Readme
@getdashfy/ext-system


System extension for Dashfy - Monitor CPU, memory, disk, network, and processes.
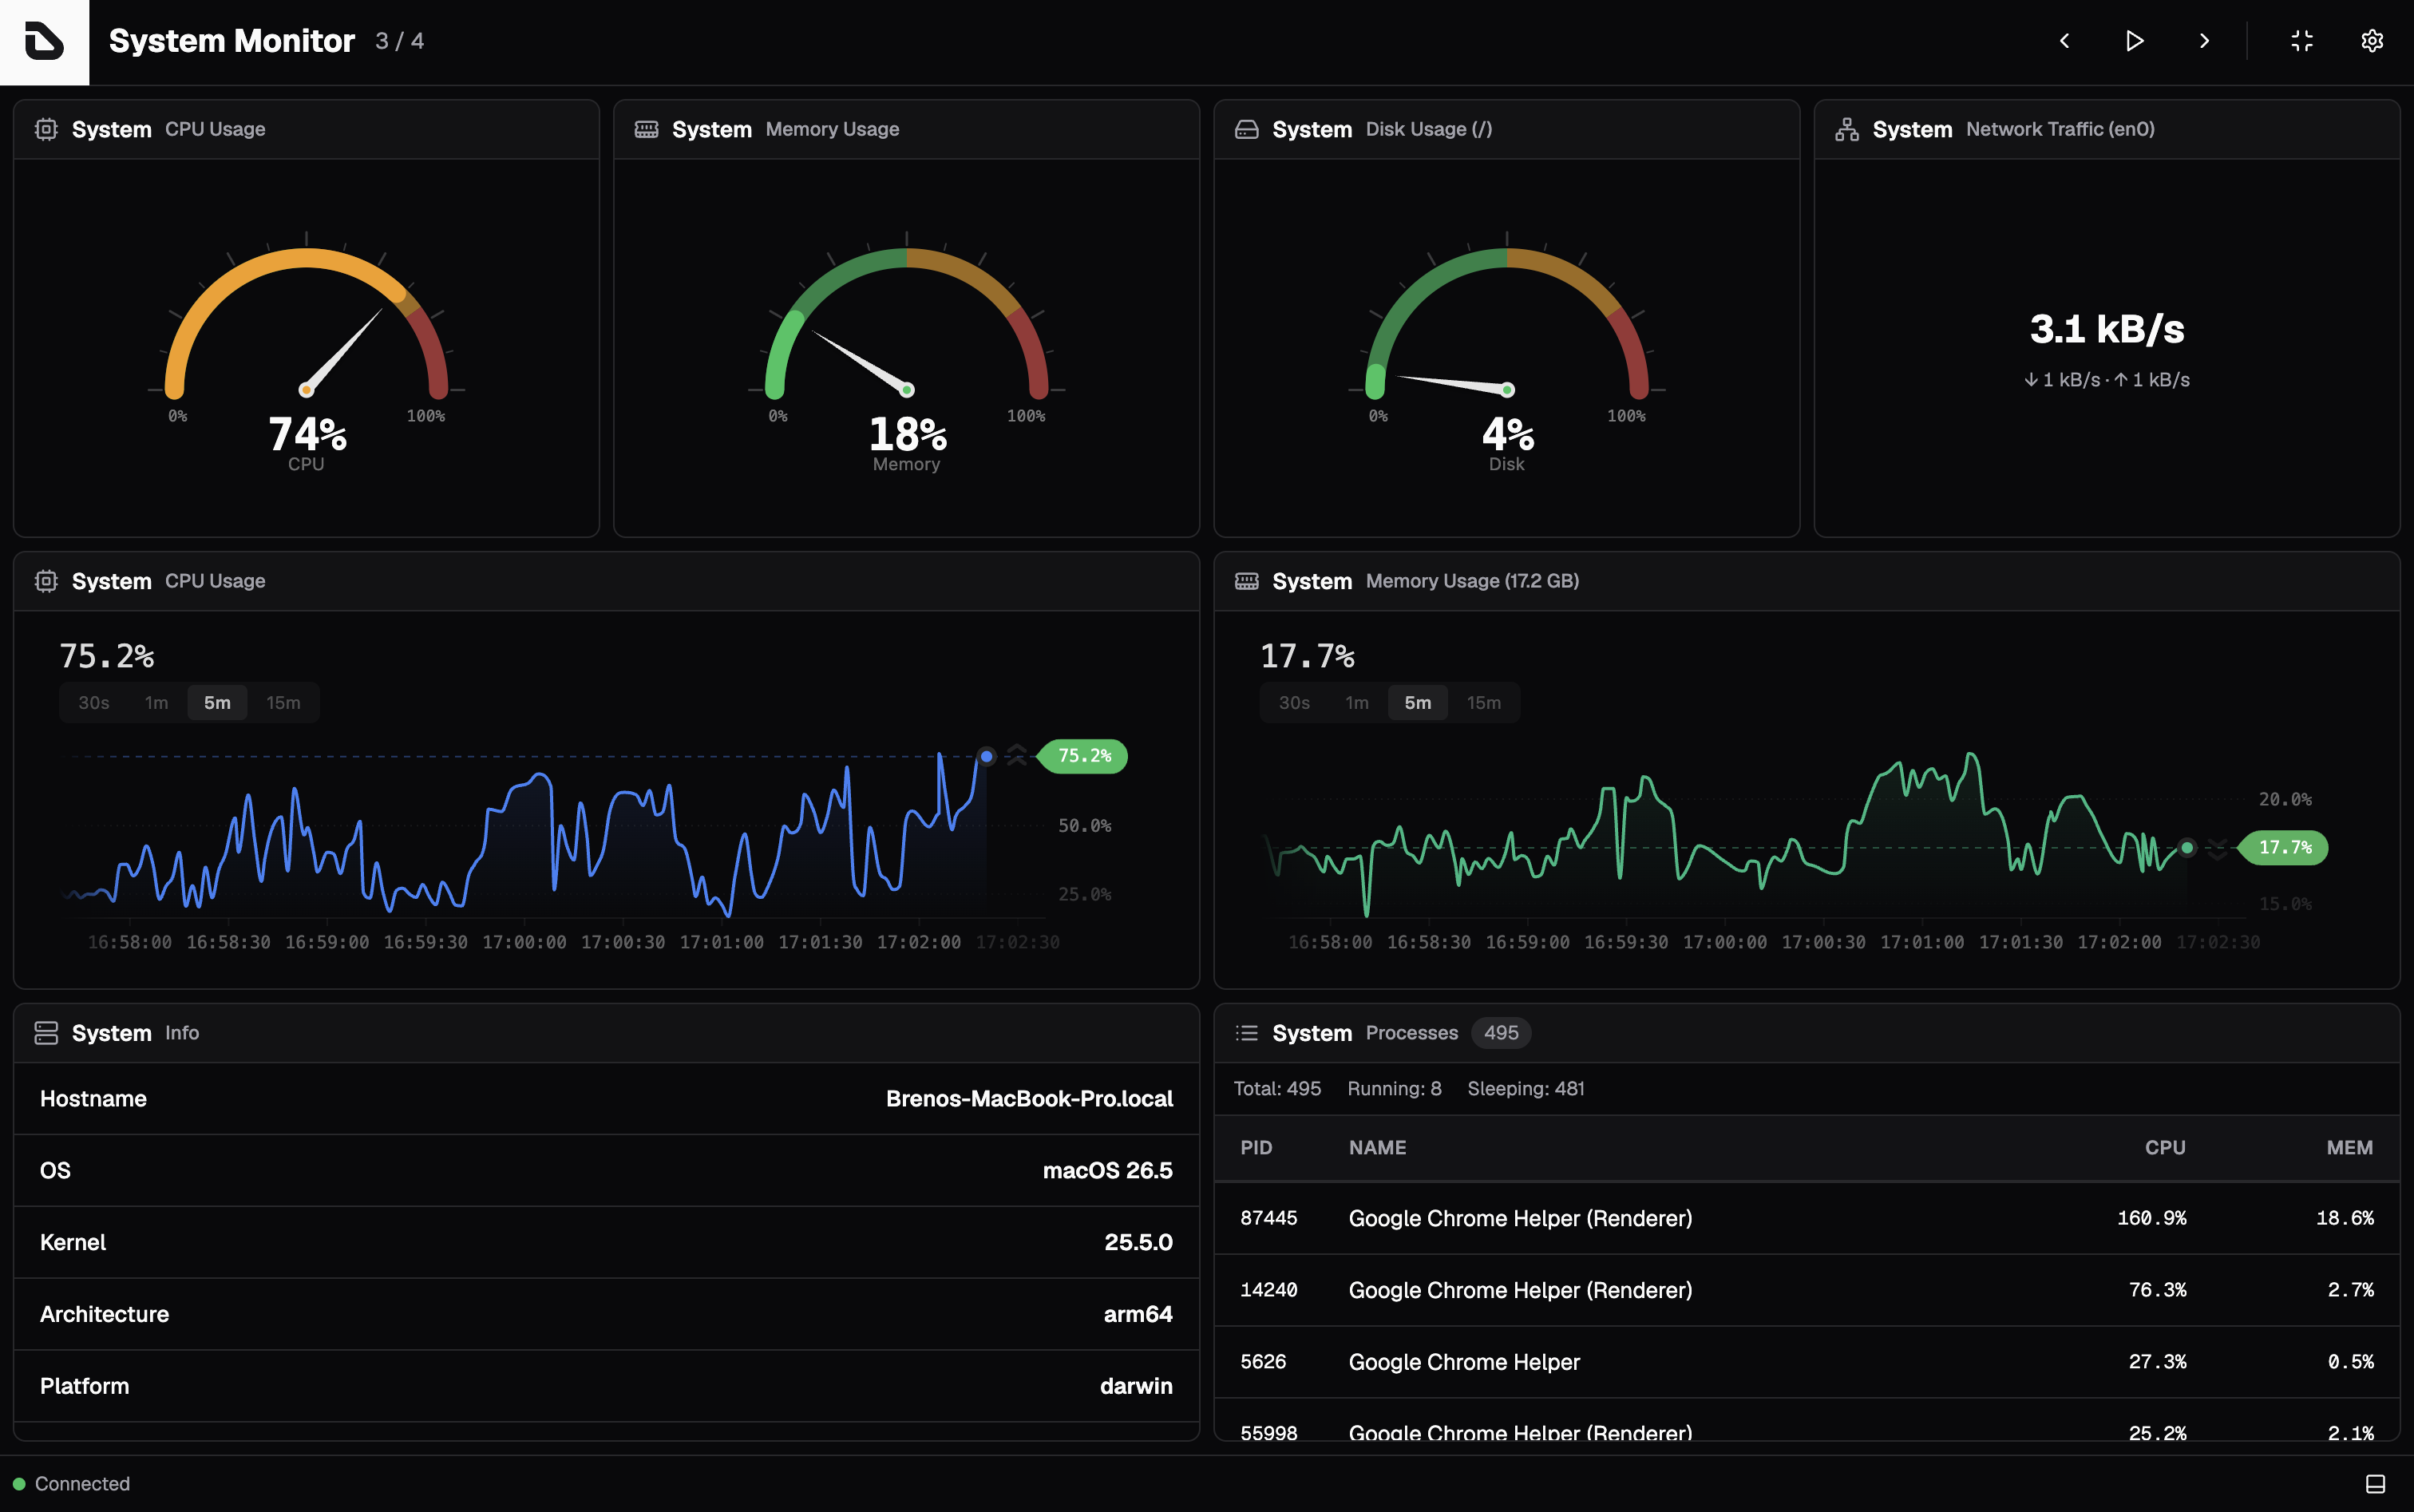
This extension provides widgets to display real-time resource metrics from the machine running the Dashfy server, collected with systeminformation.
Features
- 🖥️ CPU monitoring: Real-time CPU usage with per-core breakdown and temperature
- 🧠 Memory tracking: RAM and swap usage with detailed breakdown
- 💾 Disk usage: Filesystem usage per mount point with progress bars
- 🌐 Network stats: Interface status, bytes transferred, and current speed
- 📋 Process list: Top processes sorted by CPU or memory usage
- 🔧 System info: Hostname, OS, CPU model, uptime, and hardware details
- 📈 Gauges & live charts: Radial gauges and animated line charts for every metric
- ⚡ Real-time updates: Push-mode updates at a configurable interval
- 🎨 Theme support: Works with all Dashfy themes (light/dark mode)
Installation
Install with your favorite package manager:
npm
npm install @getdashfy/ext-systempnpm
pnpm add @getdashfy/ext-systemyarn
yarn add @getdashfy/ext-systembun
bun add @getdashfy/ext-systemQuick start
The package has two entry points. @getdashfy/ext-system holds the browser-safe React widgets, and @getdashfy/ext-system/client holds the server-only API client. Keeping them apart is what stops the Node-only systeminformation package from being bundled into your browser code, so always import the client from the /client subpath.
1. Server setup
Register the System API client in your Dashfy server (dashfy.server.ts) using push mode:
import { Dashfy } from '@getdashfy/server'
import { createSystemClient } from '@getdashfy/ext-system/client'

// Create a new Dashfy server instance
const dashfy = new Dashfy()

// Load dashboard configuration
await dashfy.configureFromFile('./dashfy.config.yml')

// Register System API with push mode for real-time updates
dashfy.registerApi(
  'system',
  createSystemClient({
    pushInterval: 2000, // Update every 2 seconds
  }),
  'push',
)

// Start server
await dashfy.start()
Important: the third argument must be
'push'. The client throws if it is registered in poll mode.
2. Client setup
Register System widgets in your React application (App.tsx):
import { WidgetRegistry } from '@getdashfy/ui'
import {
  CpuUsage,
  CpuUsageGauge,
  CpuUsageLine,
  DiskUsage,
  DiskUsageGauge,
  MemoryUsage,
  MemoryUsageGauge,
  MemoryUsageLine,
  NetworkStats,
  NetworkStatsCompact,
  NetworkStatsLine,
  Processes,
  SystemInfo,
} from '@getdashfy/ext-system'

// Register System extension
WidgetRegistry.addExtension('system', {
  CpuUsage,
  CpuUsageGauge,
  CpuUsageLine,
  DiskUsage,
  DiskUsageGauge,
  MemoryUsage,
  MemoryUsageGauge,
  MemoryUsageLine,
  NetworkStats,
  NetworkStatsCompact,
  NetworkStatsLine,
  Processes,
  SystemInfo,
})
3. Dashboard configuration
Add System widgets to your dashboard configuration (dashfy.config.yml):
dashboards:
  - title: System Monitor
    columns: 3
    rows: 2
    widgets:
      - extension: system
        widget: CpuUsage
        showCores: true
        x: 0
        y: 0
        columns: 1
        rows: 1

      - extension: system
        widget: MemoryUsage
        x: 1
        y: 0
        columns: 1
        rows: 1

      - extension: system
        widget: DiskUsage
        x: 2
        y: 0
        columns: 1
        rows: 1
System client configuration
Push mode
This extension uses push mode. In poll mode the Bus controls timing for every API at once, while in push mode each endpoint runs its own interval, which suits fast-changing metrics like CPU and memory. Intervals only run while a widget is subscribed.
Configuration options
createSystemClient({
  // Maximum number of processes to return, sorted by CPU usage
  processLimit: 10, // default

  // Push interval in milliseconds (how often to send updates)
  pushInterval: 2000, // default (2 seconds)
})
API endpoints
createSystemClient registers the endpoints below. Widgets subscribe to them through the endpoint parameter, and you can call any of them from your own custom widgets.
| Endpoint | Parameters | Returns |
| -------------- | ----------------- | --------------------------------------------- |
| systemInfo | - | CPU model, OS, hardware, hostname, and uptime |
| cpuUsage | - | Current load per core and CPU temperature |
| memoryUsage | - | RAM and swap usage |
| diskUsage | - | Filesystem usage per mount point |
| networkStats | - | Network interfaces and traffic counters |
| processes | limit, sortBy | Top processes by CPU or memory |
| battery | - | Battery level, charging state, and cycles |
battery has no built-in widget yet — it is available for custom widgets.
Available widgets
CPU
CpuUsage
Display current CPU usage with an overall load bar and optional per-core breakdown.
Parameters:
| Parameter | Type | Required | Default | Description |
| ----------------- | ------- | -------- | ----------- | ------------------------ |
| showCores | boolean | no | false | Show per-core usage bars |
| showTemperature | boolean | no | true | Show CPU temperature |
| title | string | no | "System" | Custom widget title |
| subject | string | no | "CPU Usage" | Custom widget subject |
| api | string | no | "system" | API subscription ID |
| endpoint | string | no | "cpuUsage" | API endpoint to call |
Example:
- extension: system
  widget: CpuUsage
  showCores: true
  showTemperature: true
  columns: 1
  rows: 1
CpuUsageGauge
Display CPU usage as a radial gauge chart with color-coded status.
Parameters:
| Parameter | Type | Required | Default | Description |
| ------------ | ------- | -------- | ----------- | ---------------------- |
| tickLabels | boolean | no | false | Show gauge tick labels |
| title | string | no | "System" | Custom widget title |
| subject | string | no | "CPU Usage" | Custom widget subject |
| api | string | no | "system" | API subscription ID |
| endpoint | string | no | "cpuUsage" | API endpoint to call |
Example:
- extension: system
  widget: CpuUsageGauge
  columns: 1
  rows: 1
CpuUsageLine
Display CPU usage as a real-time animated line chart.
Parameters:
| Parameter | Type | Required | Default | Description |
| ------------- | ------- | -------- | ----------- | ---------------------------------- |
| showWindows | boolean | no | true | Show time window buttons (30s-15m) |
| title | string | no | "System" | Custom widget title |
| subject | string | no | "CPU Usage" | Custom widget subject |
| api | string | no | "system" | API subscription ID |
| endpoint | string | no | "cpuUsage" | API endpoint to call |
Example:
- extension: system
  widget: CpuUsageLine
  showWindows: true
  columns: 2
  rows: 1
Memory
MemoryUsage
Display current memory (RAM) usage with a progress bar and detailed breakdown.
Parameters:
| Parameter | Type | Required | Default | Description |
| ---------- | ------- | -------- | -------------- | --------------------- |
| showSwap | boolean | no | true | Show swap memory info |
| title | string | no | "System" | Custom widget title |
| subject | string | no | "Memory Usage" | Custom widget subject |
| api | string | no | "system" | API subscription ID |
| endpoint | string | no | "memoryUsage" | API endpoint to call |
Example:
- extension: system
  widget: MemoryUsage
  showSwap: true
  columns: 1
  rows: 1
MemoryUsageGauge
Display memory usage as a radial gauge chart with color-coded status.
Parameters:
| Parameter | Type | Required | Default | Description |
| ------------ | ------- | -------- | -------------- | ---------------------- |
| tickLabels | boolean | no | false | Show gauge tick labels |
| title | string | no | "System" | Custom widget title |
| subject | string | no | "Memory Usage" | Custom widget subject |
| api | string | no | "system" | API subscription ID |
| endpoint | string | no | "memoryUsage" | API endpoint to call |
Example:
- extension: system
  widget: MemoryUsageGauge
  columns: 1
  rows: 1
MemoryUsageLine
Display memory usage as a real-time animated line chart.
Parameters:
| Parameter | Type | Required | Default | Description |
| ------------- | ------- | -------- | -------------- | ---------------------------------- |
| showWindows | boolean | no | true | Show time window buttons (30s-15m) |
| title | string | no | "System" | Custom widget title |
| subject | string | no | "Memory Usage" | Custom widget subject |
| api | string | no | "system" | API subscription ID |
| endpoint | string | no | "memoryUsage" | API endpoint to call |
Example:
- extension: system
  widget: MemoryUsageLine
  showWindows: true
  columns: 2
  rows: 1
Disk
DiskUsage
Display filesystem usage with progress bars per mount point.
Parameters:
| Parameter | Type | Required | Default | Description |
| ---------- | ------ | -------- | ------------ | --------------------- |
| title | string | no | "System" | Custom widget title |
| subject | string | no | "Disk Usage" | Custom widget subject |
| api | string | no | "system" | API subscription ID |
| endpoint | string | no | "diskUsage" | API endpoint to call |
Example:
- extension: system
  widget: DiskUsage
  columns: 1
  rows: 1
DiskUsageGauge
Display disk usage as a radial gauge chart with color-coded status.
Parameters:
| Parameter | Type | Required | Default | Description |
| ------------ | ------- | -------- | ------------ | ------------------------------- |
| mount | string | no | first mount | Mount point to display (e.g. /) |
| tickLabels | boolean | no | false | Show gauge tick labels |
| title | string | no | "System" | Custom widget title |
| subject | string | no | "Disk Usage" | Custom widget subject |
| api | string | no | "system" | API subscription ID |
| endpoint | string | no | "diskUsage" | API endpoint to call |
Example:
- extension: system
  widget: DiskUsageGauge
  mount: /
  columns: 1
  rows: 1
Network
NetworkStats
Display network interface stats including bytes transferred and current speed.
Parameters:
| Parameter | Type | Required | Default | Description |
| ---------- | ------ | -------- | -------------- | --------------------- |
| title | string | no | "System" | Custom widget title |
| subject | string | no | "Network" | Custom widget subject |
| api | string | no | "system" | API subscription ID |
| endpoint | string | no | "networkStats" | API endpoint to call |
Example:
- extension: system
  widget: NetworkStats
  columns: 1
  rows: 1
NetworkStatsCompact
Display combined network traffic (RX + TX) in a compact view.
Parameters:
| Parameter | Type | Required | Default | Description |
| ----------- | ------ | -------- | ----------------- | ---------------------------------- |
| interface | string | no | first active | Network interface (e.g. en0, eth0) |
| title | string | no | "System" | Custom widget title |
| subject | string | no | "Network Traffic" | Custom widget subject |
| api | string | no | "system" | API subscription ID |
| endpoint | string | no | "networkStats" | API endpoint to call |
Example:
- extension: system
  widget: NetworkStatsCompact
  interface: en0
  columns: 1
  rows: 1
NetworkStatsLine
Display network traffic (RX/TX) as a real-time multi-series animated line chart.
Parameters:
| Parameter | Type | Required | Default | Description |
| ------------- | ------- | -------- | ----------------- | ---------------------------------- |
| interface | string | no | first active | Network interface (e.g. en0, eth0) |
| showWindows | boolean | no | true | Show time window buttons (30s-15m) |
| title | string | no | "System" | Custom widget title |
| subject | string | no | "Network Traffic" | Custom widget subject |
| api | string | no | "system" | API subscription ID |
| endpoint | string | no | "networkStats" | API endpoint to call |
Example:
- extension: system
  widget: NetworkStatsLine
  interface: en0
  showWindows: true
  columns: 2
  rows: 1
Processes & info
Processes
Display top processes sorted by CPU or memory usage.
Parameters:
| Parameter | Type | Required | Default | Description |
| ---------- | -------------- | -------- | ----------- | --------------------------- |
| limit | number | no | 10 | Max processes to display |
| sortBy | "cpu" | "mem" | no | "cpu" | Sort by CPU or memory usage |
| title | string | no | "System" | Custom widget title |
| subject | string | no | "Processes" | Custom widget subject |
| api | string | no | "system" | API subscription ID |
| endpoint | string | no | "processes" | API endpoint to call |
Example:
- extension: system
  widget: Processes
  limit: 15
  sortBy: cpu
  columns: 2
  rows: 1
SystemInfo
Display static system information: hostname, OS, CPU model, uptime, and hardware details.
Parameters:
| Parameter | Type | Required | Default | Description |
| ---------- | ------ | -------- | ------------ | --------------------- |
| title | string | no | "System" | Custom widget title |
| subject | string | no | "Info" | Custom widget subject |
| api | string | no | "system" | API subscription ID |
| endpoint | string | no | "systemInfo" | API endpoint to call |
Example:
- extension: system
  widget: SystemInfo
  columns: 1
  rows: 1
Cross-platform support
systeminformation backs every endpoint, so platform coverage follows its own:
- macOS: Full support including CPU temperature (via powermetrics)
- Linux: Full support including CPU temperature
- Windows: Full support (some features may require admin privileges)
- FreeBSD/OpenBSD: Partial support
Note: CPU temperature is not available on all systems. When unavailable, the widget displays "N/A".
Troubleshooting
CPU temperature shows N/A
Solution: CPU temperature is not available on all hardware. On macOS it may require running the server with elevated privileges. On Linux, ensure lm-sensors is installed.
High CPU usage from the extension itself
Solution: Increase pushInterval (for example 3000ms or 5000ms) or reduce the number of system widgets on the dashboard.
No network interfaces shown
Solution: Only active ("up") interfaces are displayed. Ensure your interfaces are connected.
Processes list is empty
Solution: Some environments restrict process listing. Ensure the Dashfy server has permission to read process information.
"requires push mode" error on startup
Solution: Pass 'push' as the third argument to registerApi. This client has no poll-mode fallback.
Contributing
Contributions are welcome. For issues and pull requests related to the extension, use the dashfy/dashfy-ext-system repository. Framework contributions belong in dashfy/dashfy.
Community
Join the community on Dashfy's Discord server to discuss the project, ask questions, or get help.
Join the conversation on X (Twitter) and follow @dashfydev for updates and announcements.
License
This project is licensed under the AGPL-3.0 License - see the LICENSE file for details.