
@gtadi/k8s-node-debugger
v1.1.1
Published
Spin up a privileged debug pod on a target Kubernetes node and inspect its network stack (iptables, resolv.conf, conntrack, routes, sockets) from a browser UI.


Readme
k8s node debugger
Spin up a privileged debug pod on any Kubernetes node and inspect its full network stack from a browser — no SSH required.
One command creates the pod, opens the browser, and cleans up when you're done.
node bin/k8s-node-debugger.js <node-name>Screenshots
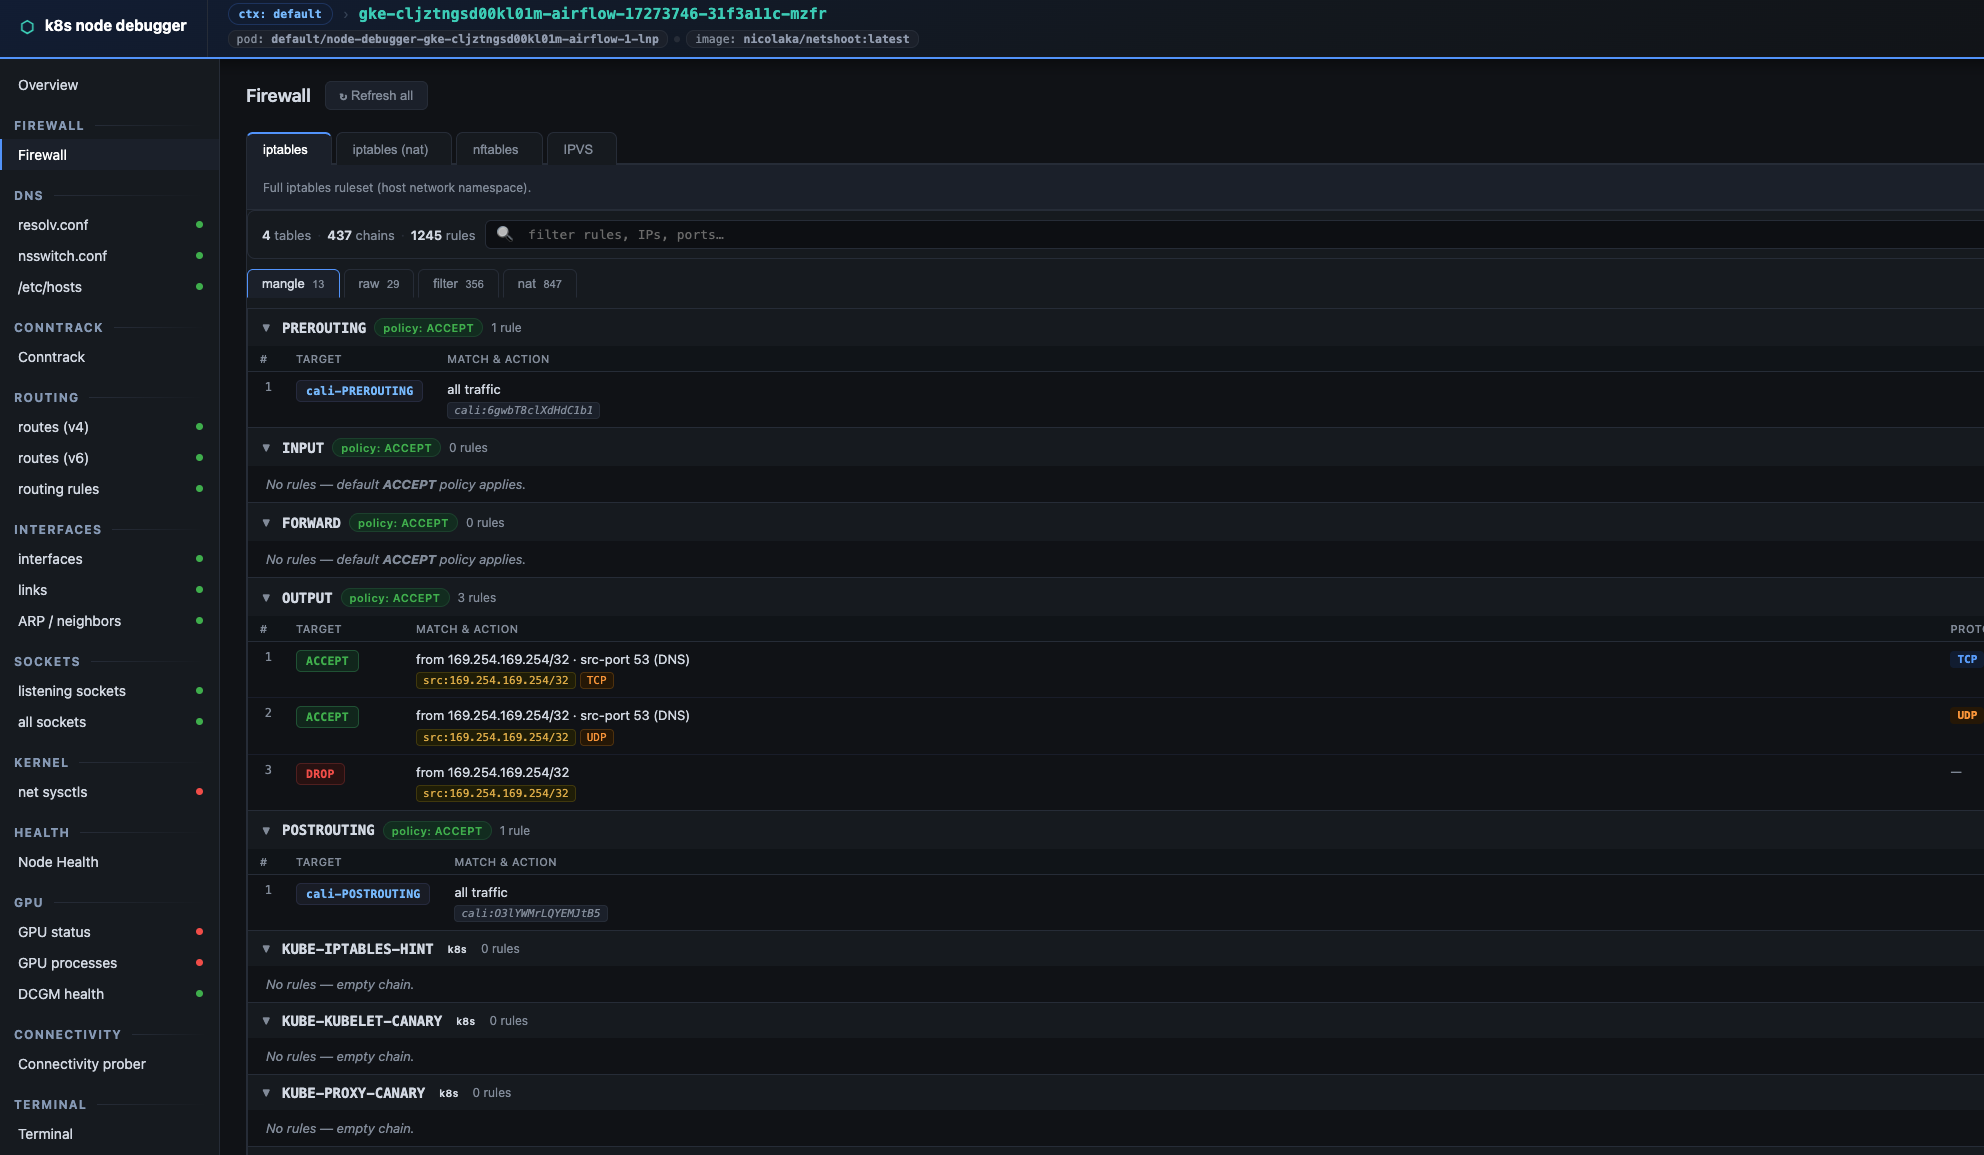
Firewall — iptables, nftables, and IPVS tabs
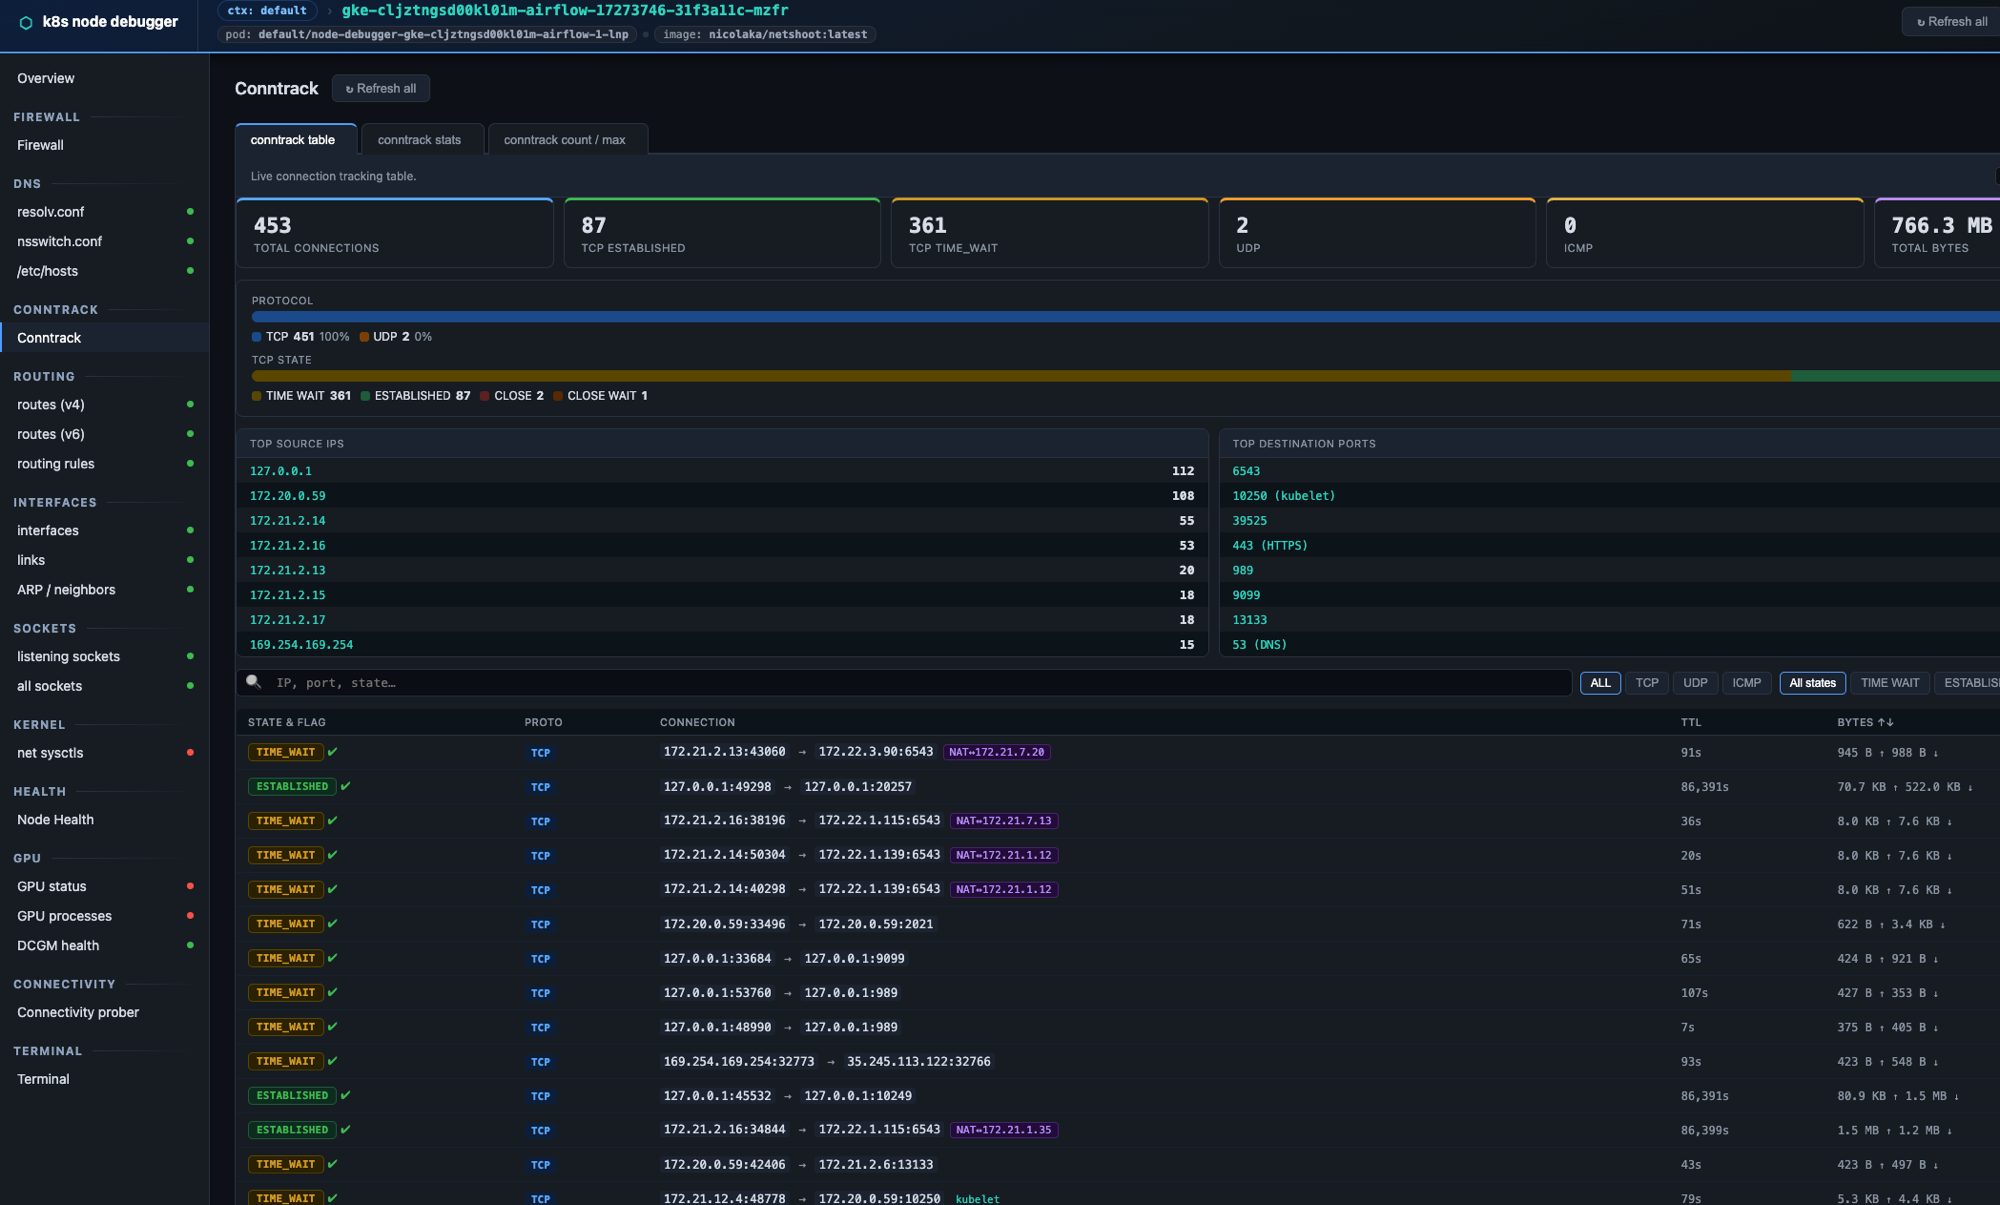
Conntrack — live connection tracking
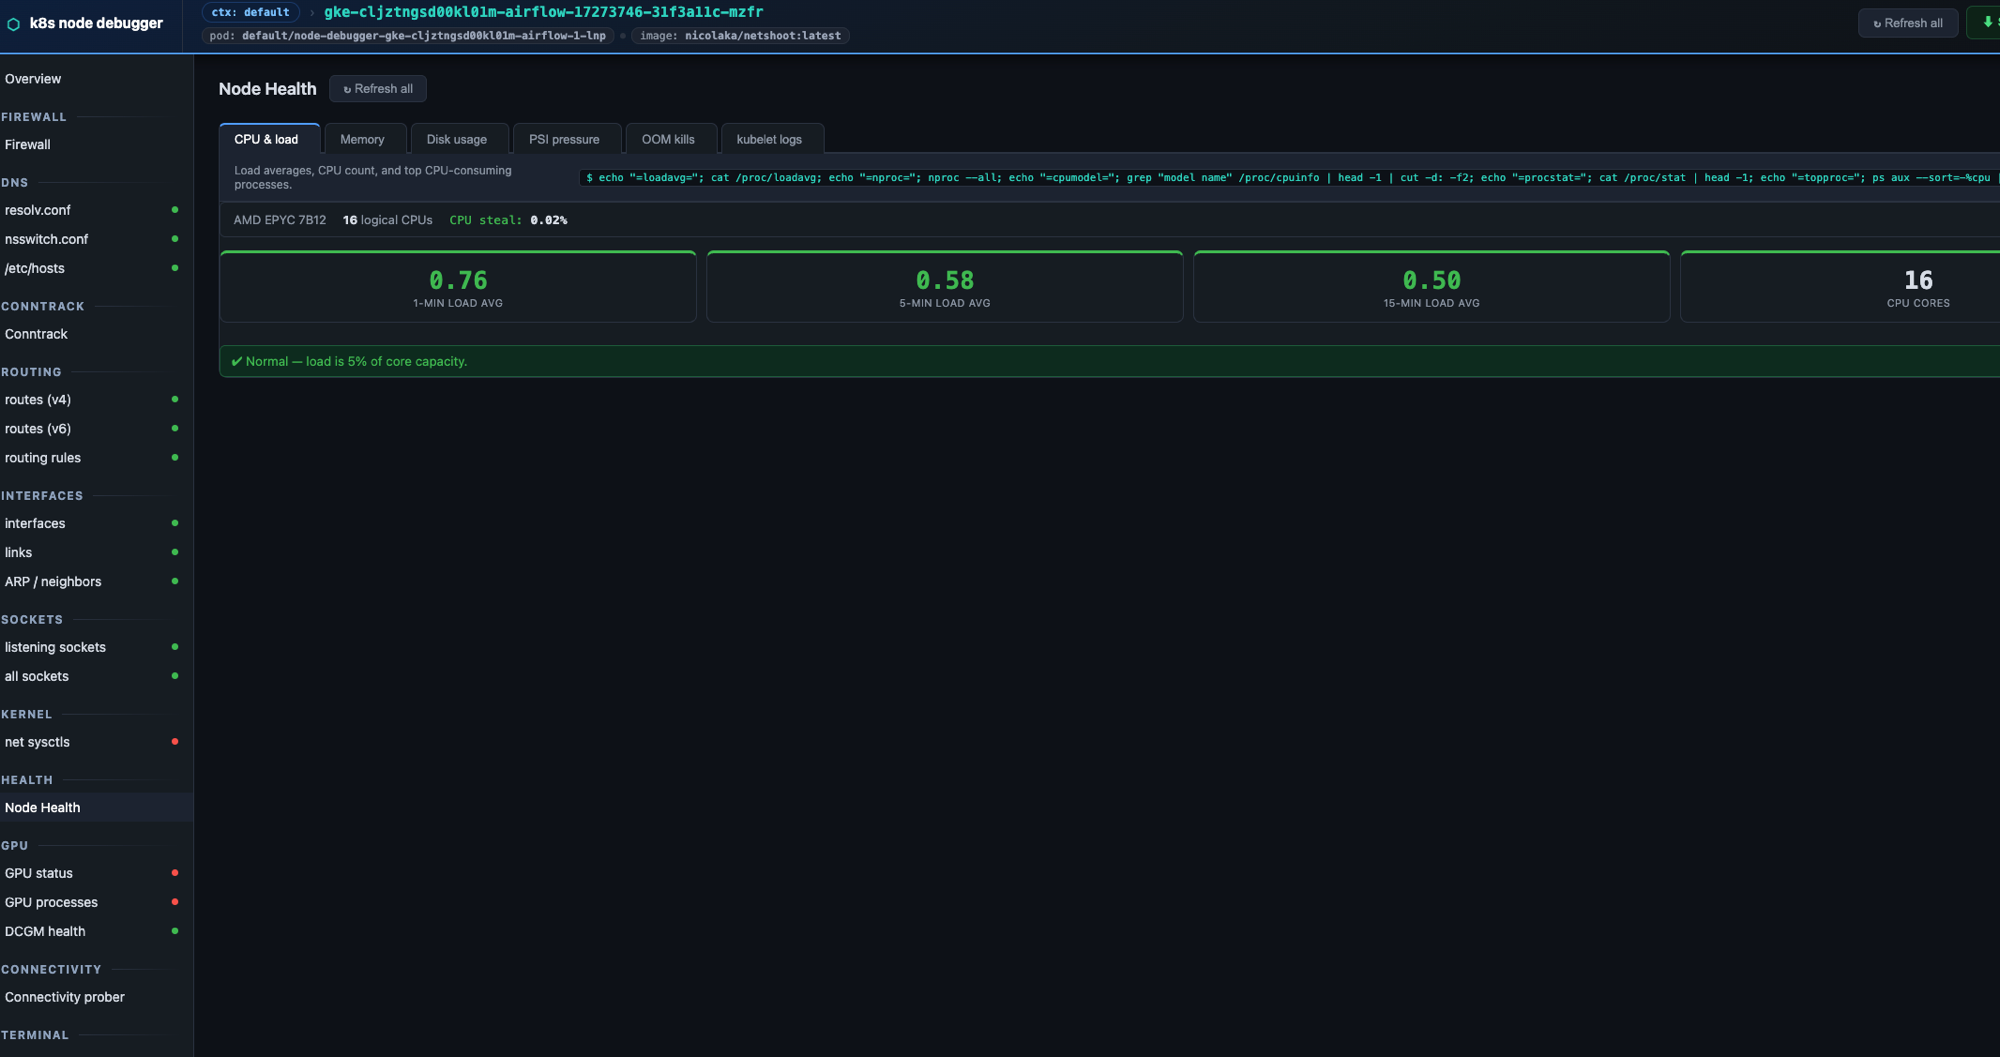
Node Health — CPU, memory, disk, PSI, OOM, kubelet logs
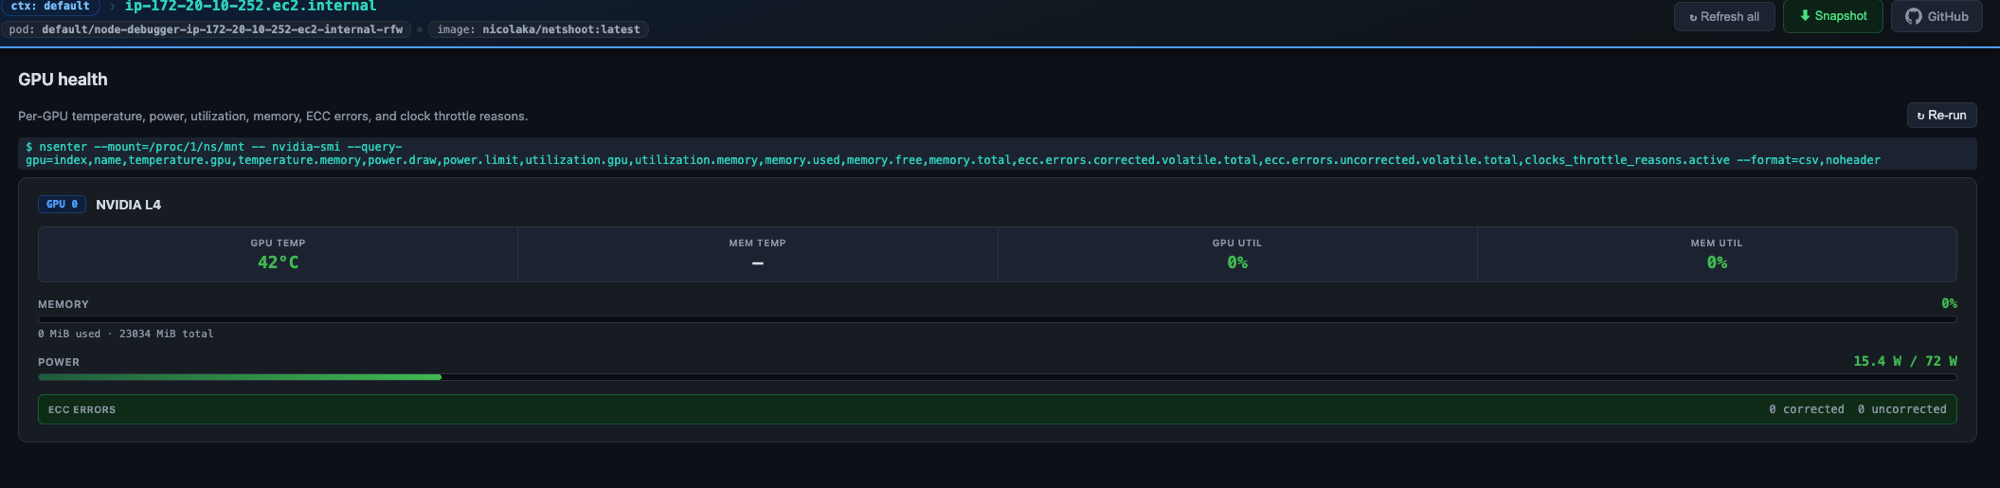
GPU Health — temperature, power, utilization, memory, ECC errors, clock throttle
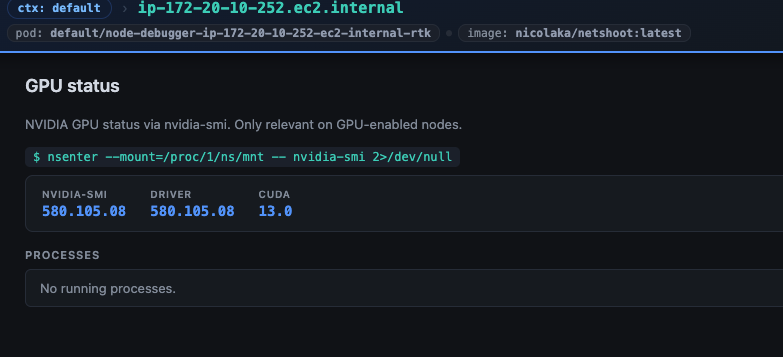
GPU Status — driver version, CUDA, per-GPU metrics, processes
Install
npm install -g @gtadi/k8s-node-debuggerOr run without installing:
npx @gtadi/k8s-node-debugger <node-name>Requires kubectl on your PATH with an active kubeconfig. The debug image (nicolaka/netshoot) is pulled from Docker Hub on first use.
From source
git clone [email protected]:goutamtadi1/k8s-node-debugger.git
cd k8s-node-debugger
npm install
node bin/k8s-node-debugger.js <node-name>
Usage
# list nodes in the current context
node bin/k8s-node-debugger.js --list

# debug a specific node (opens http://localhost:7878)
node bin/k8s-node-debugger.js <node-name>

# options
node bin/k8s-node-debugger.js <node-name> \
  --namespace kube-system \   # namespace for the debug pod (default: default)
  --context my-ctx \          # kubeconfig context (default: current)
  --port 9000 \               # UI port (default: 7878)
  --keep \                    # leave the pod running after exit
  --no-open                   # don't auto-open the browser
Press Ctrl-C to stop the server and delete the debug pod.
What it shows
| Section | Probes | |---|---| | Firewall | iptables (all tables), iptables nat, nftables, IPVS — each as a tab | | DNS | resolv.conf, nsswitch.conf, /etc/hosts | | Conntrack | connection table, per-CPU stats, count/max gauge — each as a tab | | Routing | IPv4 routes, IPv6 routes, policy rules | | Interfaces | ip addr, ip link stats, ARP/neighbors | | Sockets | listening sockets, all TCP/UDP with process names | | Kernel | key net.* sysctls | | Health | CPU & load, memory, disk usage, PSI pressure, OOM kills, kubelet logs — each as a tab | | GPU | nvidia-smi status, GPU processes, DCGM health check | | Terminal | streaming terminal — run any command inside the pod (tcpdump, dig, ping, conntrack -E …) |
Node Health view features
- CPU & load — load averages (1/5/15 min) vs core count, CPU model, steal %, top processes
- Memory — used/available/cached/swap gauges from
/proc/meminfo - Disk usage —
df -hper filesystem with usage bars - PSI pressure — CPU, memory, and I/O stall metrics from
/proc/pressure/*; colour-coded ok/warn/critical - OOM kills — parsed dmesg entries with process names and timestamps; empty means no OOM events since boot
- kubelet logs — last 100 lines from journalctl, errors and warnings highlighted
iptables view features
- Tabs per table (mangle · security · raw · filter · nat) with rule counts
- Collapsible chain cards with default-policy badge and packet/byte counters
- Colour-coded target badges: ACCEPT / DROP / REJECT / MASQUERADE / DNAT / LOG / MARK / k8s chain / …
- Human-readable rule summaries with port service names (SSH, HTTPS, etcd, kubelet, k8s-API, NodePort range …)
- Live search across all tables and chains
- KUBE-SVC-* / KUBE-SEP-* chains collapsed by default; toggle with K8s chains button
- Click any rule to reveal the raw
iptables-saveline - Raw toggle to fall back to plain text
conntrack view features
- Stat cards: Total · TCP ESTABLISHED · TCP TIME_WAIT · UDP · ICMP · total bytes
- Protocol distribution bar and TCP state breakdown bar
- Top 8 source IPs and top 8 destination ports (with service names)
- Filter by protocol and TCP state; full-text search by IP, port, or state
- Connection rows show state badge, ASSURED/UNREPLIED flag, src:port → dst:port, TTL, bytes, and a NAT tag when the reply source differs from the original destination
- Paginated 200 at a time
- Per-CPU stats table with drops/errors highlighted in red
- Count/max capacity gauge (green → amber → red at 50% / 80%)
How it works
The debug pod (nicolaka/netshoot) is created with:
hostNetwork: true— shares the node's network namespacehostPID: true— allowsnsenterto enter the host mount namespaceprivileged: true— required for iptables / conntrack / tcpdump- Host root mounted at
/host— for reading node files - Tolerations for all taints — schedules onto control-plane nodes too
The server shells out to your local kubectl, so your active kubeconfig, current context, and any exec auth plugins (EKS, GKE, AKS) are reused automatically.
Environment variables
| Variable | Default | Description |
|---|---|---|
| KUBECTL_BIN | kubectl | Path to the kubectl binary |
| DEBUGGER_IMAGE | nicolaka/netshoot:latest | Debug container image |