
@jasimvk/fetchlogger
v0.3.0
Published
Live in-page fetch/XHR logger panel — framework-agnostic core with an optional React wrapper.

Maintainers
 mooncoder2020
Readme
@jasimvk/fetchlogger



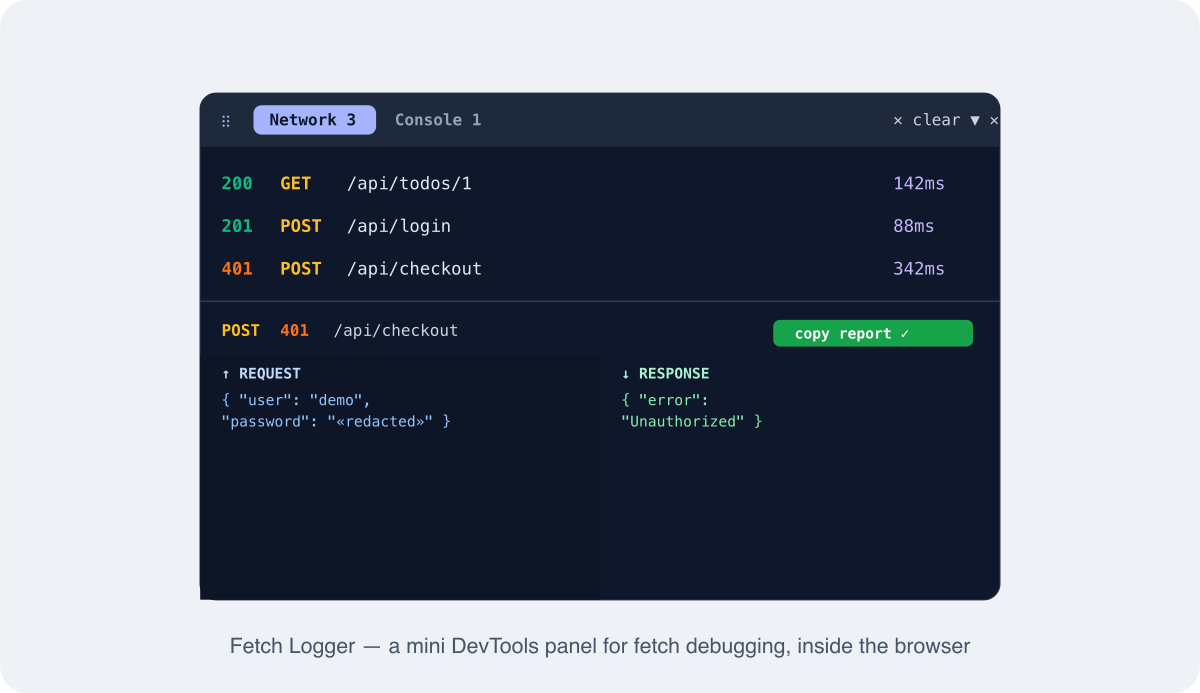
A mini DevTools panel for debugging
fetchrequests inside the browser — no DevTools required.
https://github.com/jasimvkarim/fetchlogger/raw/main/assets/fetchlogger-demo.webm
A live, in-page debug panel for the browser — see every fetch() request/response and your console output without opening DevTools. Framework-agnostic core with an optional React wrapper.
- 🛰 Floating panel — collapsible and draggable (grab the header)
- 🌐 Network tab — every fetch with status, timing, and request/response bodies
- 🖥️ Console tab — captures
console.log/info/warn/error/debug - 🎭 Mock tab — override any request: return a mock response (status + body) or rewrite the outgoing request body, matched by URL substring or API label
- 🐢 Throttle slider — add artificial latency to every fetch to reproduce slow networks, spinners and timeouts
- 🧹 Cache-clear button — wipe
localStorage,sessionStorage, Cache Storage & service workers in one click - 🔎 Filter each tab; click a request to inspect it
- 📋 One-click copy — request body, response body, URL, console lines, or a full Copy Debug Report (method, URL, status, timing, bodies, console errors) for bug tickets
- 🔒 Auto-redacts secrets; nothing leaves the browser
- ⚡ Zero dependencies in the core (React is an optional peer)
- 🧩 Works in React, Vue, Svelte, or plain JS
Install
npm i -D @jasimvk/fetchloggerReact
import FetchLogger from "@jasimvk/fetchlogger/react";

export default function App() {
  return (
    <>
      {/* render once near the root */}
      {process.env.NODE_ENV !== "production" && <FetchLogger />}
      {/* ...your app... */}
    </>
  );
}
Tip: gate it however you like —
NODE_ENV, an env flag, or a branch. The package itself never gates; you decide where it shows.
Any framework / plain JS
import { mountFetchLoggerPanel } from "@jasimvk/fetchlogger";

const unmount = mountFetchLoggerPanel({ position: "bottom-center" });
// later: unmount();
Just the data (no UI)
import { installFetchLogger, subscribe } from "@jasimvk/fetchlogger";

installFetchLogger({ getLabel: (body) => (body as any)?.API_Code });
const off = subscribe((log) => console.log(log.method, log.url, log.status));
Mock, throttle & cache
Three controls for shaping requests live — in the panel, or programmatically.
In the panel:
- Mock tab → add rule — match a request by URL substring or API label, then either return a mock response (status + body) or rewrite the outgoing request body. Toggle rules on/off; mocked rows get a
MOCKbadge. - 🐢 throttle slider — delay every fetch by 0–5000 ms (reproduce slow networks / timeouts).
- 🧹 cache button — clear
localStorage,sessionStorage, Cache Storage and service workers.
From code:
import {
  addOverride, setThrottle, clearBrowserCache,
} from "@jasimvk/fetchlogger";

// Mock a response without a backend (matched by URL substring or API label):
addOverride({ match: "saveTirePlan", mode: "response", status: 200, body: '{"success":true}' });

// Rewrite an outgoing request body, then let it hit the server:
addOverride({ match: "getModel", mode: "request", body: '{"API_Code":"getModel","inparams":{}}' });

setThrottle(2000);        // delay every fetch by 2s (0 disables)
await clearBrowserCache();
Options
| Option | Default | Description |
|--------|---------|-------------|
| maxLogs | 100 | Max logs kept in memory (FIFO). |
| getLabel | — | Derive a short label from the parsed JSON body (e.g. an API code). |
| captureResponseBody | true | Clone + read response bodies. |
| captureConsole | true | Also capture console output into a Console tab (panel only). |
| maxConsoleLogs | 200 | Max console entries kept in memory (FIFO). |
| levels | all 5 | Console levels to capture: log, info, warn, error, debug. |
| autoRedact | true | Auto-mask secrets in bodies and URLs: sensitive keys (token, password, authorization, apiKey, secret, cookie…), secret query params + user:pass@ userinfo, and JWT/Bearer tokens in string bodies. |
| redact | — | (log) => log hook to strip/mask sensitive data before it is stored or shown. Runs after autoRedact. |
| maxBodyChars | 20000 | Truncate captured request/response bodies longer than this. |
| allowInProduction | false | Run in a production build. Default off — in production the logger/panel disable themselves entirely. |
| silenceProductionWarning | false | Suppress the console warning shown when installed in a production build. |
| defaultOpen | false | Start expanded (panel only). |
| position | "bottom-center" | bottom-center | bottom-right | bottom-left (panel only). |
| container | document.body | Where to mount the panel. |
| autoInstall | true | Patch fetch on mount (panel only). |
API
mountFetchLoggerPanel(options?) => () => void— mount the floating panel, returns unmount.installFetchLogger(options?) => () => void— patchfetch, returns uninstall.uninstallFetchLogger()— restore originalfetch.subscribe(fn) => () => void— listen to fetch log events.getLogs()/clearLogs()/isInstalled()addOverride(rule?)/updateOverride(id, patch)/removeOverride(id)/clearOverrides()/getOverrides()/subscribeOverrides(fn)— manage request/response override rules.setThrottle(ms)/getThrottle()— global artificial fetch latency.clearBrowserCache()— clear localStorage, sessionStorage, Cache Storage & service workers.buildDebugReport(log, options?)— paste-ready text report for a request.installConsoleLogger(options?) => () => void— capture console output (no UI).subscribeConsole(fn)/getConsoleLogs()/clearConsoleLogs()/uninstallConsoleLogger()- Types:
FetchLog,OverrideRule,ConsoleLog,ConsoleLevel,InstallOptions,ConsoleOptions,MountOptions.
How it works
Patches window.fetch, recording method, URL, parsed JSON request/response
bodies, status, and timing into an in-memory store. The panel subscribes to the
store and renders live. It only touches the browser (typeof window guarded),
so it's safe to import in SSR — it no-ops on the server.
Built for mobile & QA debugging
Fetch Logger shines where DevTools are hard to open:
- mobile browsers and WebViews
- staging links and QA builds
- client demos and tester bug reports
Testers can hit Copy Debug Report and paste a complete, redacted summary straight into a ticket — method, URL, status, timing, request/response bodies, and any console errors — so developers get reproducible context without asking "what did the network tab say?".
import { buildDebugReport, getLogs } from "@jasimvk/fetchlogger";

const last = getLogs().at(-1);
if (last) navigator.clipboard.writeText(buildDebugReport(last));
Security
This tool displays request and response bodies, which can contain tokens, passwords, or personal data. A few things to know:
- Disabled in production. Don't ship it to end users — and it won't ship
itself. In a production build (
NODE_ENV === "production")installFetchLoggerandmountFetchLoggerPanelno-op entirely (no fetch patch, no panel, nothing captured) and log a one-timeconsole.warn. Force it on withallowInProduction: true; silence the warning withsilenceProductionWarning: true. Check the state yourself withisProductionBlocked(options). - Secrets are auto-masked — in bodies and URLs. Values under sensitive
keys (
token,password,authorization,apiKey,secret,cookie, …) are replaced with«redacted»; secret query params (access_token,api_key,signature, …) anduser:pass@userinfo are stripped from the stored URL; and JWTs /Bearer …tokens inside plain-text bodies are masked too. Disable withautoRedact: false, or add your own rules viaredact(log). Redaction only affects what's stored/displayed — the real network request is sent untouched. - No data leaves the browser. Logs are kept in memory only — never sent
anywhere, never written to
localStorage/cookies, and cleared on reload. - Request headers are not captured (only
content-typeis read to decide JSON vs text).
installFetchLogger({
  // mask anything else you don't want on screen
  redact: (log) => ({ ...log, url: log.url.replace(/token=[^&]+/g, "token=•••") }),
});
License
MIT