
@lanegrid/agtrace
v0.7.1
Published
The official CLI for agtrace, built on top of agtrace-sdk. Visualize and analyze AI agent execution traces.
Maintainers
 zawakin
Readme


The Problem I Had
When I started using AI coding agents (Claude Code, Codex, Gemini), I realized I was working with a black box. I couldn't see:
- How much of the context window was being consumed
- What the agent was actually doing between my prompts
- When the conversation was getting too long and performance would degrade
I found myself guessing the agent's internal state. That felt wrong.
What Changed
Now I always run agtrace alongside my coding agent. It's become essential.
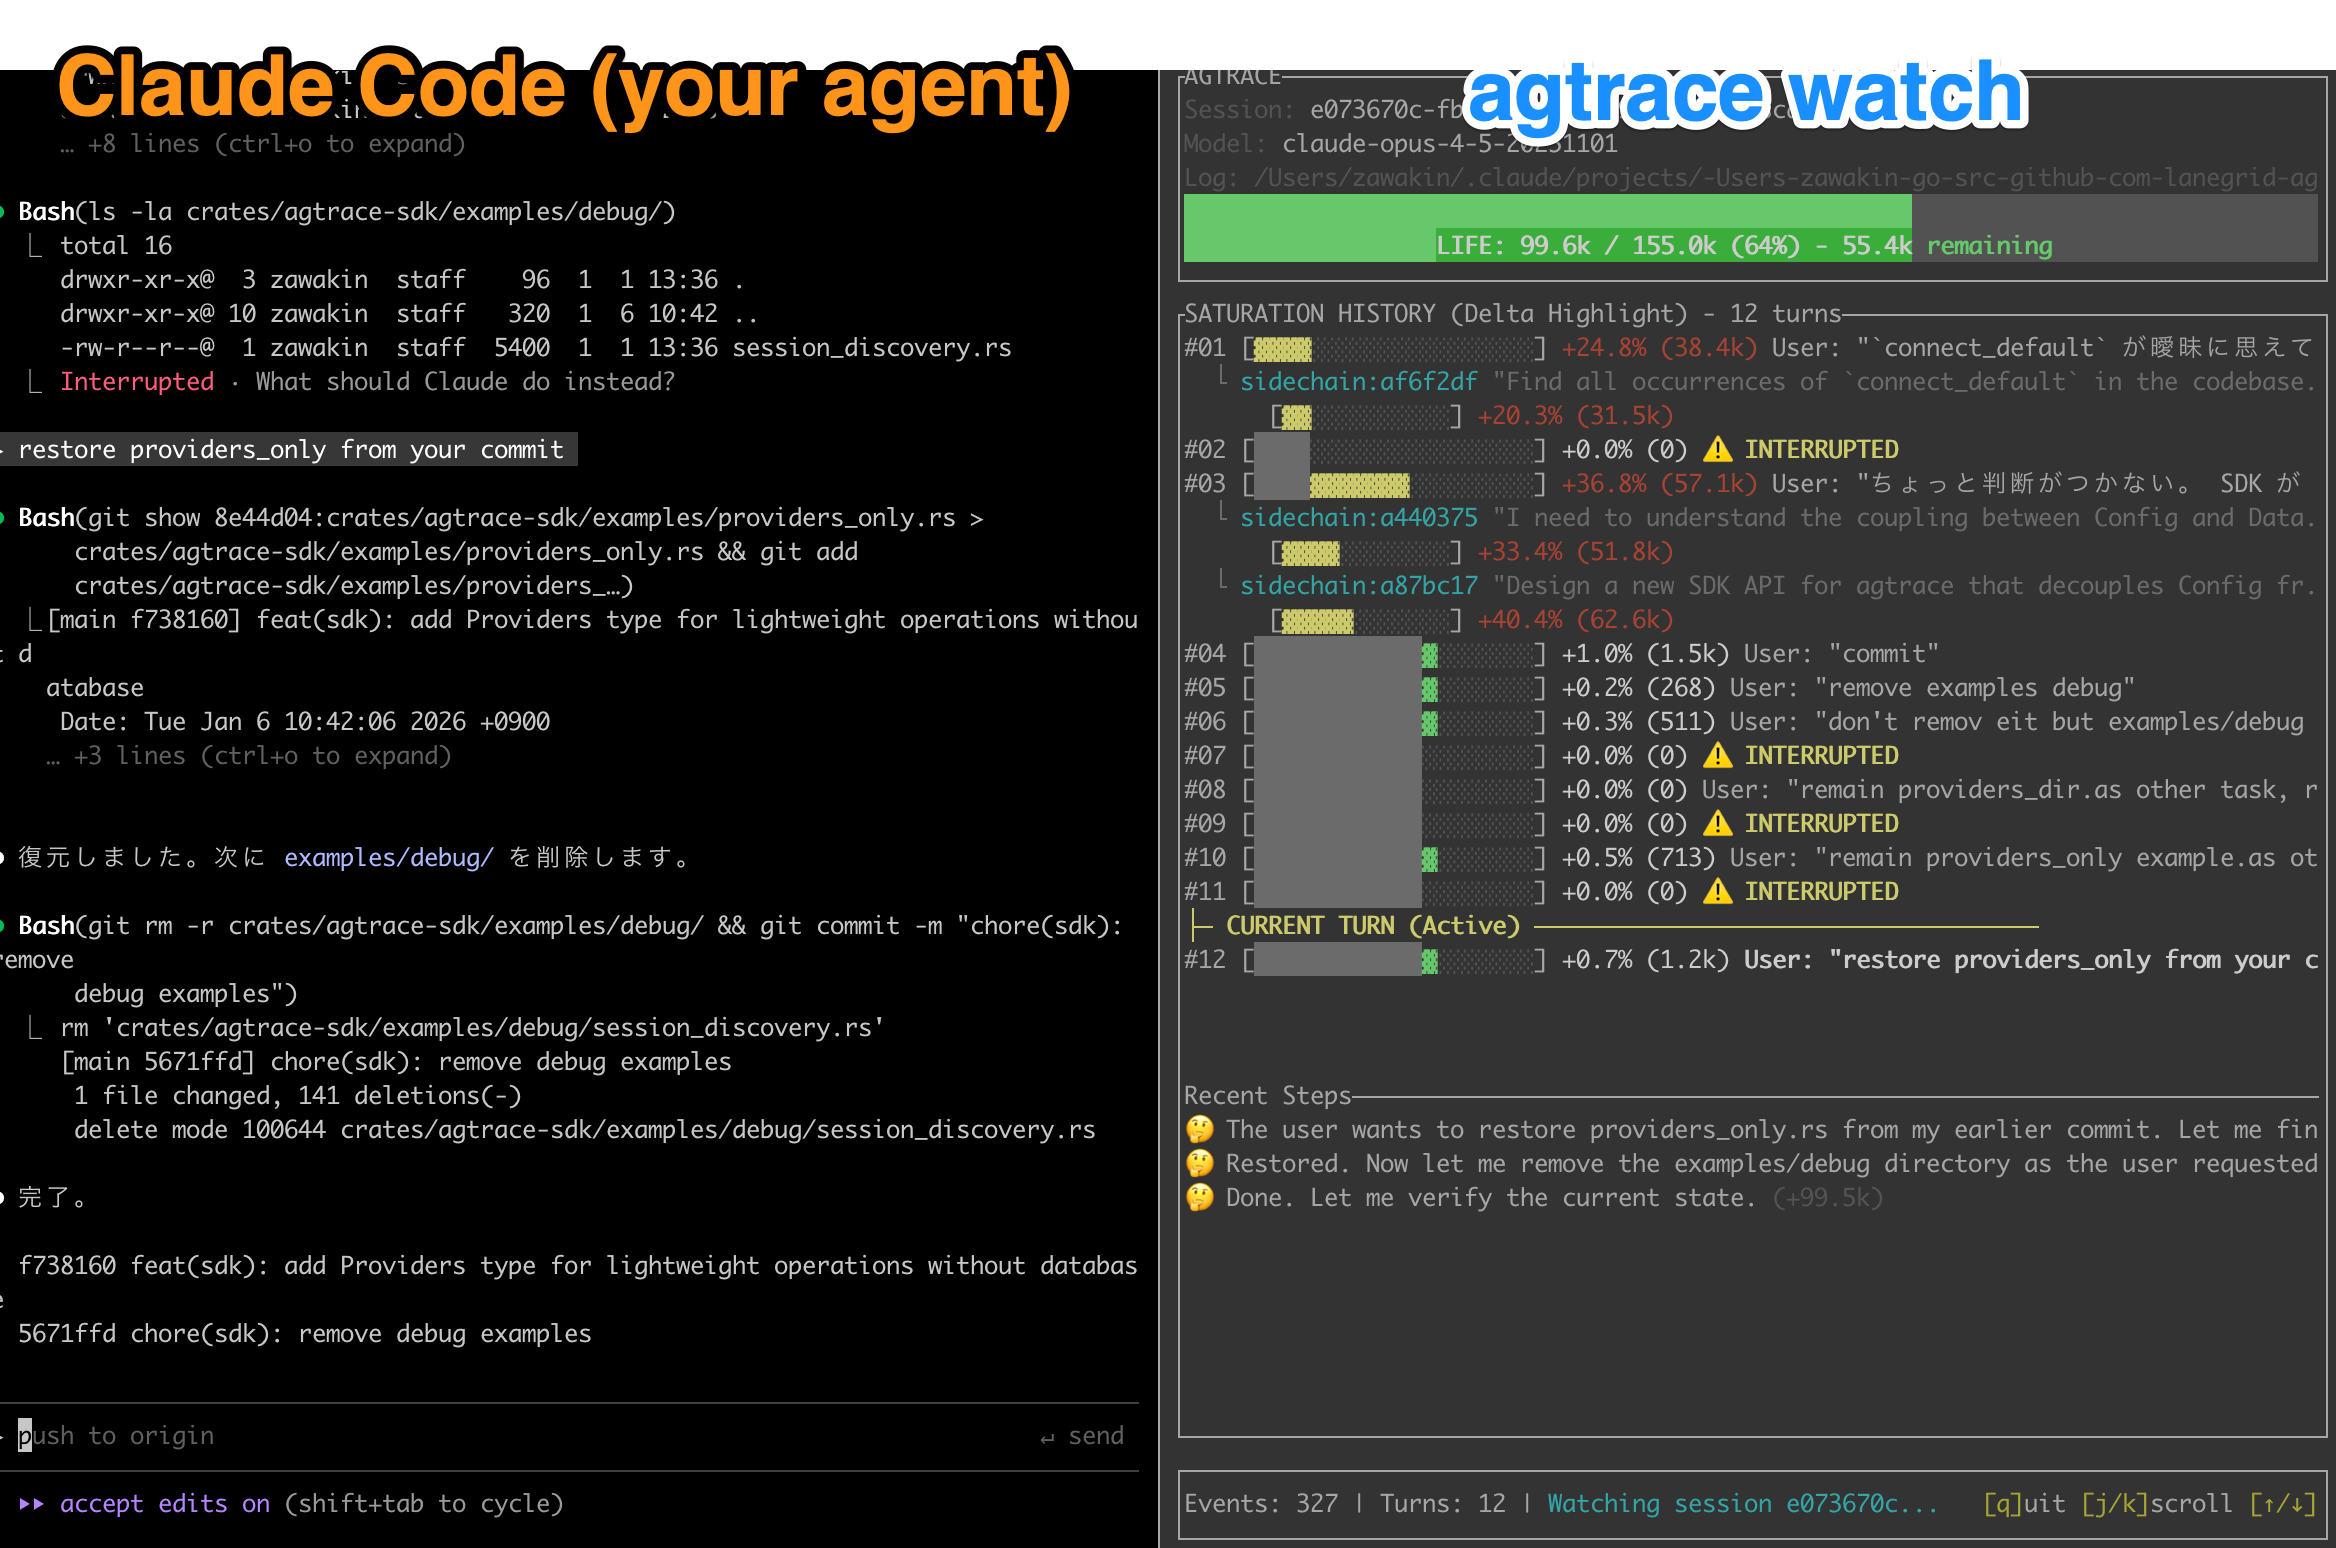
What I see:
- Context window usage — A color-coded bar showing how full the conversation is
- Token consumption trends — How much context each task uses over time
- Live activity — Tool calls, file reads, reasoning traces as they happen
For the first time, I can make informed decisions about when to start a new session, how to scope my requests, and whether the agent is stuck in a loop.

Try It
npm install -g @lanegrid/agtrace
cd my-project
agtrace init      # One-time setup
agtrace watch     # Launch dashboard in a separate terminal
Works with Claude Code, Codex (OpenAI), and Gemini. Zero config — just discovers existing logs.
Give Your Agent Memory of Past Sessions
One thing I didn't expect: agents can also query their own execution history via MCP:
# Claude Code
claude mcp add agtrace -- agtrace mcp serve

# Codex
codex mcp add agtrace -- agtrace mcp serve
Now your agent can search what it did yesterday, find past errors, and learn from previous sessions.
See the MCP Integration Guide for more.
Other Commands
agtrace session list       # Browse past sessions
agtrace lab grep "error"   # Search across all sessions
For Tool Builders
If you're building your own IDE plugin, dashboard, or observability tool:
[dependencies]
agtrace-sdk = "0.6"
See SDK Documentation and Examples.
Documentation
Feedback
Have ideas?
License
MIT / Apache 2.0