
@madhavmahajan132/nodepulse
v1.1.0
Published
Zero-configuration application performance monitoring for Node.js and Express.

Maintainers
 madhavmahajan132
Readme
NodePulse APM




A small, self-hosted performance dashboard for Node.js and Express.
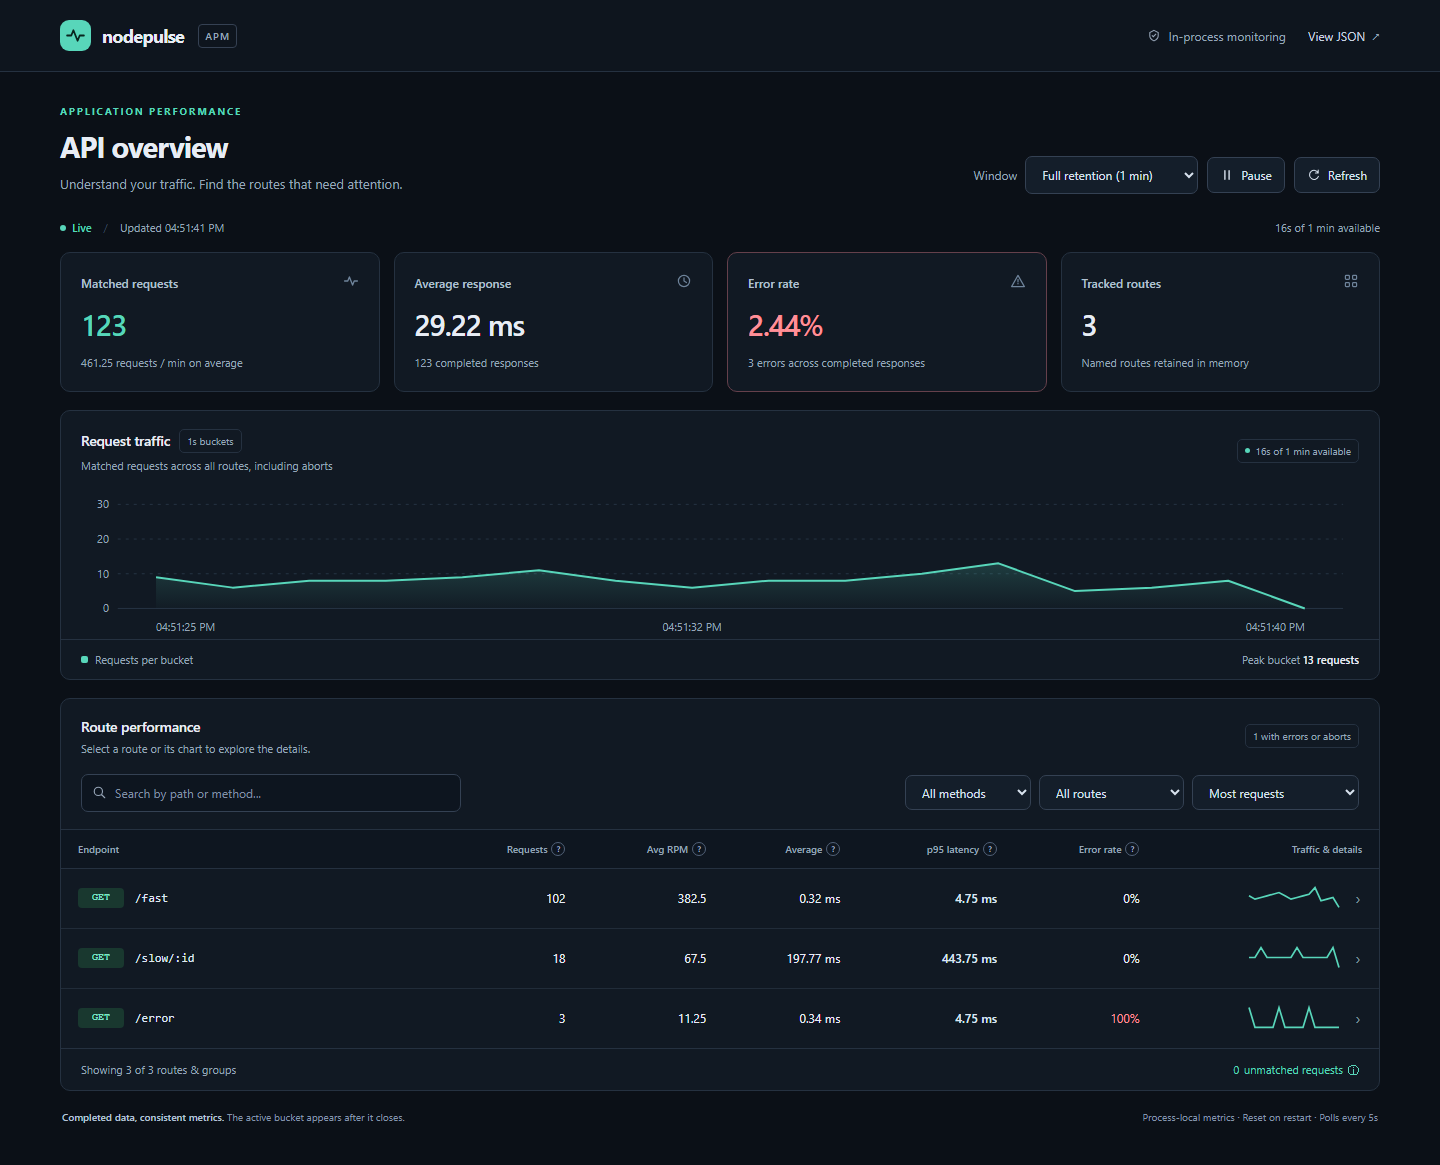
NodePulse measures route traffic, response time, percentiles, errors, aborts, and unmatched requests directly inside your Express process. There is no monitoring account to create, no external collector to run, and no request-level data sent anywhere.
Security: NodePulse does not include authentication. Protect the dashboard and JSON endpoint with your own middleware before exposing them outside a trusted environment.
What you get
- A self-contained dashboard at
/nodepulse - Searchable routes and expandable, interactive per-API traffic charts
- Versioned JSON metrics at
/nodepulse/metrics.json - Normalized
METHOD /route/:patternaggregation - Average requests per minute (RPM)
- Average, minimum, and maximum response time
- Histogram-derived p50, p95, and p99 latency
- Configurable error-rate tracking
- Aborted-request and unmatched-request tracking
- Bounded memory through retention and route-cardinality limits
- Dual ESM/CommonJS support with TypeScript declarations
- No runtime dependencies other than your existing Express installation
Requirements
- Node.js 22 or newer
- Express 4.18 through Express 5.x
Installation
npm install @madhavmahajan132/nodepulseQuick start
Mount NodePulse before request logging and application routes so it can observe the final response status and duration.
CommonJS
const express = require("express");
const nodepulse = require("@madhavmahajan132/nodepulse");

const app = express();

app.use(nodepulse());
app.use(express.json());

app.get("/api/users/:id", async (request, response) => {
  response.json({ id: request.params.id });
});

app.listen(3000);
ES modules
import express from "express";
import nodepulse from "@madhavmahajan132/nodepulse";

const app = express();

app.use(nodepulse());
app.use(express.json());

app.get("/api/users/:id", async (request, response) => {
  response.json({ id: request.params.id });
});

app.listen(3000);
Exercise a few application routes, then open:
Dashboard:    http://localhost:3000/nodepulse
JSON metrics: http://localhost:3000/nodepulse/metrics.json
With the default configuration, NodePulse needs one complete 60-second bucket before it displays aggregate metrics. Seeing Warming up during that first minute is expected.
Integration in an existing application
The recommended middleware order is:
const express = require("express");
const cors = require("cors");
const nodepulse = require("@madhavmahajan132/nodepulse");

const app = express();

app.disable("x-powered-by");

// Mount before request logging and application routes.
const pulse = nodepulse({ excludePaths: ["/health"] });
app.use(pulse);

app.use(cors());
app.use(express.json({ limit: "100kb" }));
app.use(requestLogger);

app.get("/health", healthHandler);
pulse.mount(app, "/api/users", usersRouter);
pulse.mount(app, "/api/orders", ordersRouter);

app.use(notFound);
app.use(errorHandler);
NodePulse listens for the response lifecycle, so an error status assigned by the final error handler is still recorded correctly.
Understanding the dashboard
Start with the traffic, response-time, and error summaries, then search routes by path or HTTP method. Filter for errors or aborts and sort by requests, p95 latency, or error rate to find an API worth investigating.
Select a route or its sparkline to expand its details. The larger chart shows completed time buckets with exact timestamps. Hover, tap, or use the keyboard-accessible slider to inspect request counts and RPM. The same view includes p50/p95/p99, minimum and maximum latency, completed responses, errors, and aborts. Latency percentiles summarize the selected window; the historical chart shows traffic.
Choose a shorter window, pause automatic updates, or refresh manually. The open route and inspected time stay selected during polling. Connection failures retain the last successful snapshot with a visible warning. The interface supports mobile screens and keyboard navigation; Escape closes route details.
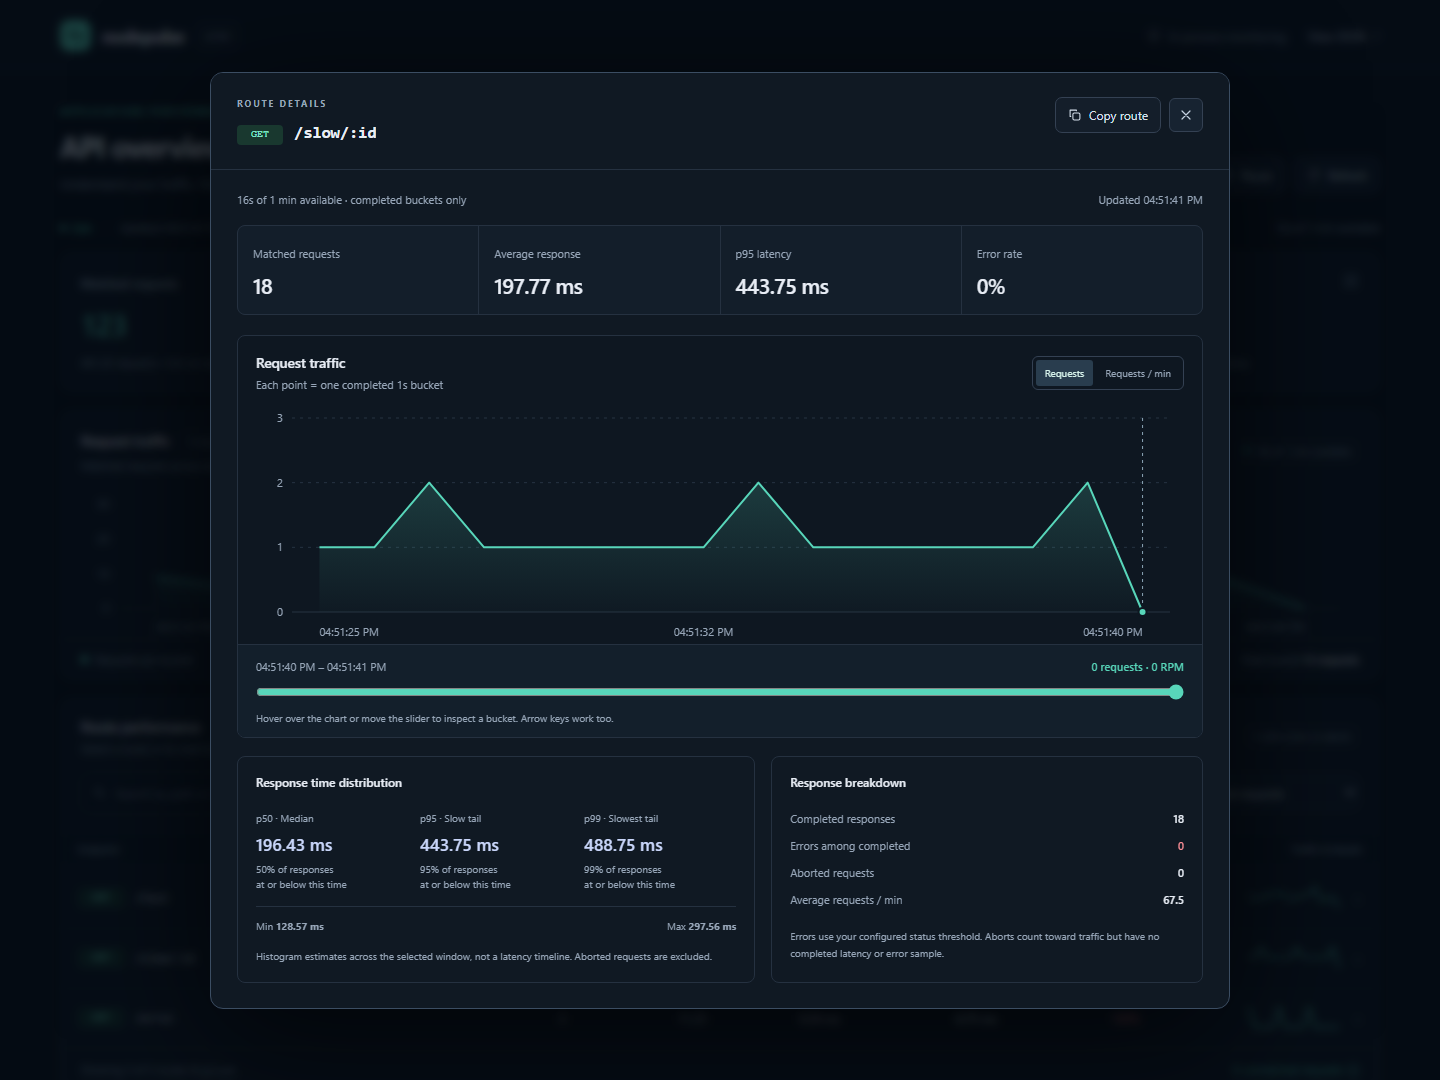
View the mobile route details screenshot. These screenshots use actual completed traffic from the included example application with one-second demonstration buckets; the default bucket remains 60 seconds.
| Value | Meaning | | ------------------ | ------------------------------------------------------------------------- | | Tracked routes | Normalized route keys currently retained in memory. | | Total requests | Matched requests from completed buckets in the displayed window. | | Unmatched | Requests that did not resolve to an Express route, usually 404s. | | Avg RPM | Average matched requests per minute across completed buckets. | | Average | Mean response time for cleanly completed requests. | | p95 | Estimated latency at or below which 95% of completed requests finished. | | Errors | Percentage of completed responses meeting the configured error threshold. | | Recent trend | Request counts per completed time bucket, oldest to newest. |
Hover over or focus a dashboard column title for a short explanation inside the UI.
Complete-bucket reporting
NodePulse never mixes a partially active bucket with completed data.
With the default 60-second bucket:
Completed bucket 1    Completed bucket 2    Active bucket 3
10 requests           0 requests            7 requests so far
      │                      │                       │
      └──────────────────────┴── included            └── excluded
Every route metric—traffic, latency, percentiles, errors, aborts, and trends—uses the same completed buckets.
- Values change only when a bucket closes.
- No partial-bucket extrapolation is performed.
- A completed zero-request bucket is real data and contributes to the RPM denominator.
- A zero-request bucket does not invent latency or error samples; those values remain empty when no completed responses exist.
The dashboard defaults to the full retention window; the window selector offers shorter bucket-aligned periods. During the first hour it uses the completed portion available. For example, after 10 minutes:
{
  "windowSeconds": 3600,
  "effectiveWindowSeconds": 600
}
After 60 minutes, the window continuously rolls forward: the oldest completed bucket expires as a new one closes.
Configuration
app.use(
  nodepulse({
    retentionMinutes: 60,
    bucketSizeSeconds: 60,
    dashboardPath: "/nodepulse",
    metricsJsonPath: "/nodepulse/metrics.json",
    errorStatusThreshold: 500,
    maxTrackedRoutes: 200,
    excludePaths: ["/health", /^\/internal/],
  }),
);
| Option | Default | Description |
| ---------------------- | ------------------------: | ------------------------------------------------------------------------------- |
| retentionMinutes | 60 | Maximum completed history retained in memory. |
| bucketSizeSeconds | 60 | Duration of one fixed time bucket. |
| dashboardPath | /nodepulse | Path serving the browser dashboard. |
| metricsJsonPath | /nodepulse/metrics.json | Path serving schema-v2 JSON metrics. |
| errorStatusThreshold | 500 | Status code at or above which a response counts as an error. |
| maxTrackedRoutes | 200 | Maximum distinct matched route keys before overflow uses other. |
| excludePaths | [] | Exact strings or regular expressions matched against normalized route patterns. |
Invalid options throw when nodepulse() is initialized, allowing configuration mistakes to fail during application startup.
Important validation rules:
- Retention in seconds must be evenly divisible by bucket size.
- Dashboard and JSON paths must be distinct absolute paths.
- Stateful regular expressions using
goryare rejected. - NodePulse automatically excludes its own dashboard and polling traffic.
Route aggregation
NodePulse groups requests by HTTP method and normalized Express route pattern:
GET /users/1      ┐
GET /users/42     ├──▶ GET /users/:id
GET /users/9382   ┘

POST /users/42   ─────▶ POST /users/:id
Methods remain separate because different methods often perform very different work.
Query parameters never change route identity. For a registered /users/:id route, /users/123?page=1 and /users/alice?sort=name both count as GET /users/:id. Parameter values are never used to guess the route pattern. Registered case, optional/wildcard syntax, and strict leaf trailing slashes are preserved.
Registering router mounts
Use the returned middleware's mount helper for every router mount in a chain, including static mounts:
const pulse = nodepulse();
app.use(pulse);

const members = express.Router();
members.get("/:memberId", memberHandler);

const teams = express.Router();
pulse.mount(teams, "/members", members);
pulse.mount(app, "/teams/:teamId", teams);
This records GET /teams/:teamId/members/:memberId for numbers, UUIDs, encoded IDs, and arbitrary slugs, with or without mergeParams. Ordinary app.get() route definitions stay unchanged, and child routes can be registered before the helper is called.
pulse.mount(parent, path, router) returns the parent. The parent may be an Express application or Router; the child must be an Express Router. String, RegExp, and array paths use the installed Express version's matching rules. Array alternatives from one registration share one metric key. Nested Express sub-applications are not supported by the helper.
Migration: replace app.use("/api", router) with pulse.mount(app, "/api", router), and do the same for nested mounts. Existing middleware calls still work, but a mount prefix not registered with the helper is reported in the reserved unresolved series. An empty root mount adds no prefix and can be transparent. Enabling mergeParams alone no longer supplies mount identity.
The unresolved series combines matched requests whose full pattern cannot be established. It has the same latency, error, and abort metrics as ordinary routes, occupies one bounded series outside maxTrackedRoutes, and never stores literal mount values. It is separate from other (route-cap overflow) and unmatched (no matched Express route). Path exclusions apply only to resolved patterns; unresolved traffic is not excluded by guessing a path.
Route identity is captured when Express selects a route, so it survives asynchronous responses and app-level error handlers. If several routes match, the last selected route wins. A route that calls next() and eventually falls through to a 404 remains attributed to that matched route.
Requests with no matched Express route are grouped under one fixed unmatched series. Unknown raw paths are not stored individually.
JSON metrics API
GET /nodepulse/metrics.json
GET /nodepulse/metrics.json?windowSeconds=300
windowSeconds must be positive, divisible by the configured bucket size, and no larger than retention.
A shortened schema-v2 response looks like:
{
  "schemaVersion": 2,
  "generatedAtMs": 1788060000000,
  "windowStartMs": 1788059400000,
  "windowEndMs": 1788060000000,
  "aggregationState": "ready",
  "windowSeconds": 3600,
  "effectiveWindowSeconds": 600,
  "bucketSizeSeconds": 60,
  "routes": [
    {
      "routeKey": "GET /api/users/:id",
      "aggregationState": "ready",
      "requestCount": 24,
      "completedCount": 23,
      "errorCount": 1,
      "abortedCount": 1,
      "requestsPerSecond": 0.04,
      "averageResponseTimeMs": 42.5,
      "errorRate": 0.0434782609,
      "p95ResponseTimeMs": 187.5,
      "p99ResponseTimeMs": 205.5,
      "recentRequestCounts": [3, 1, 0, 4, 0, 0, 0, 0, 7, 9]
    }
  ],
  "unmatched": {
    "routeKey": "unmatched",
    "aggregationState": "ready",
    "requestCount": 2,
    "statusCounts": { "404": 2 },
    "recentRequestCounts": [0, 0, 1, 0, 0, 0, 0, 0, 0, 1]
  }
}
Before the first bucket closes, aggregate fields are null and aggregationState is "warming_up".
windowStartMs is inclusive and windowEndMs is exclusive. They identify the exact completed interval, anchored to middleware startup. Trend item i starts at windowStartMs + i * bucketSizeSeconds * 1000. These additive fields preserve schema v2.
Both NodePulse endpoints accept only GET and HEAD. Other methods receive HTTP 405.
Protecting the dashboard
NodePulse deliberately does not prescribe an authentication system. Place your own authentication middleware before it:
app.use("/nodepulse", requireAuth);
app.use(nodepulse());
For local-only development, also bind the application to loopback:
app.listen(3000, "127.0.0.1");The dashboard response includes restrictive content-security, framing, referrer, content-type, and cache headers. These headers do not replace authentication.
Storage and privacy
Metrics are held in bounded JavaScript Map objects inside the current Node.js process.
NodePulse stores aggregate counters and latency histograms. It does not store:
- Request or response bodies
- Headers, cookies, or authorization tokens
- Raw parameter values
- Individual request records
- Metrics in a database or external service
Consequences of this design:
- Metrics reset when the process restarts.
- Each worker or server has its own independent dashboard.
- No application metrics leave the process unless someone accesses the configured JSON endpoint.
Memory protection
- Completed buckets automatically expire after retention.
- The number of matched route keys is capped by
maxTrackedRoutes. - Routes beyond the cap share the reserved
otherseries. - Matched traffic with unknown identity shares one separate
unresolvedseries. - Unmatched paths share one bounded series rather than using raw URLs.
- Idle routes are removed after their last activity leaves retention.
The release memory gate simulates 3.6 million requests at 500 RPS across 50 routes and verifies that heap usage plateaus after retention fills. See benchmark methodology.
Current limitations
NodePulse v1 does not include:
- Persistence across process restarts
- Aggregation across clusters, workers, containers, or servers
- Built-in authentication
- Distributed tracing
- Alert delivery
- Exact percentiles based on retained raw samples
- A public storage-adapter API
Documentation
- Complete product and developer manual
- Architecture
- Benchmark methodology and results
- Release checklist
- Security policy
- Contributing
- Changelog
Development
npm install
npm run check
npm run test:coverage
npm run test:browser
Additional benchmark and packaging commands are documented in MANUAL.md.