
@markbattistella/docsify-charty
v2026.9.9
Published
Charts and graphs for your docsify website

Maintainers
 markbattistella
Readme
docsify.js charty
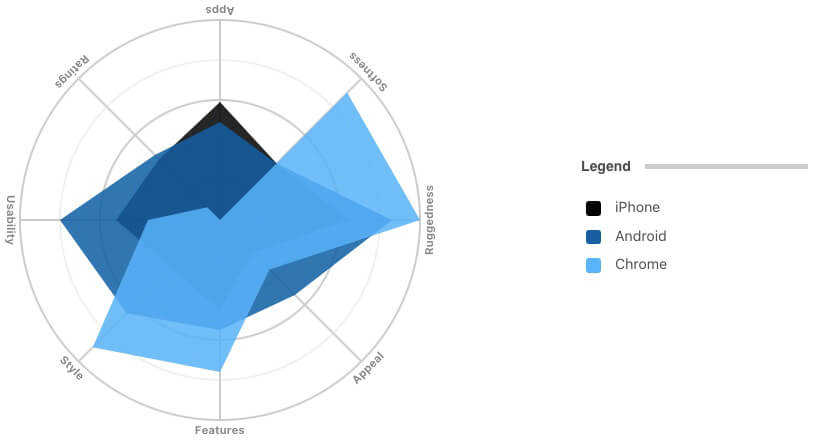
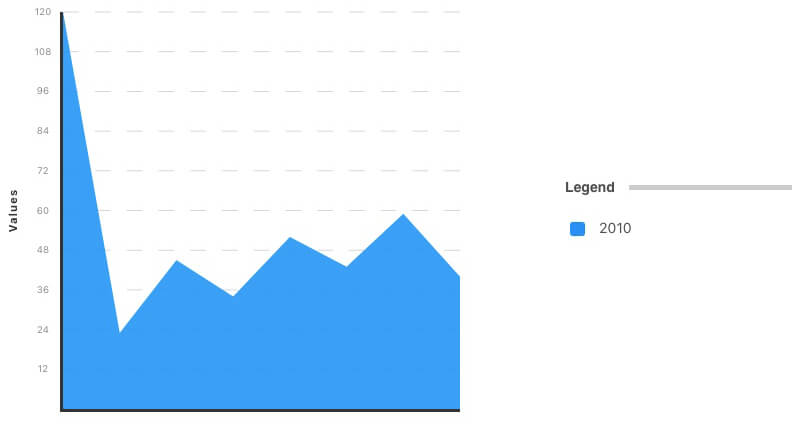
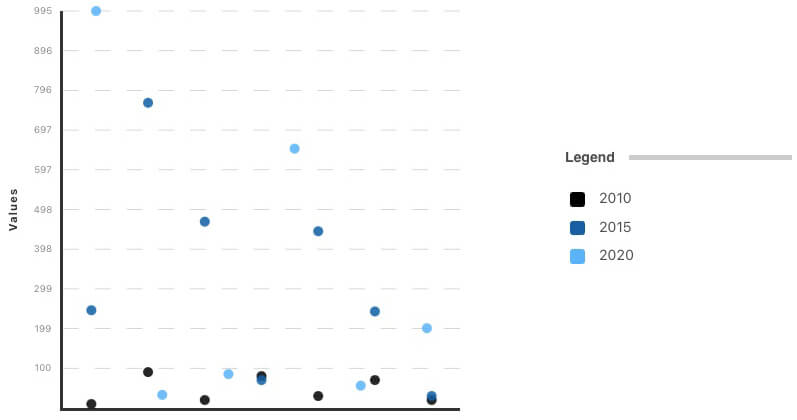
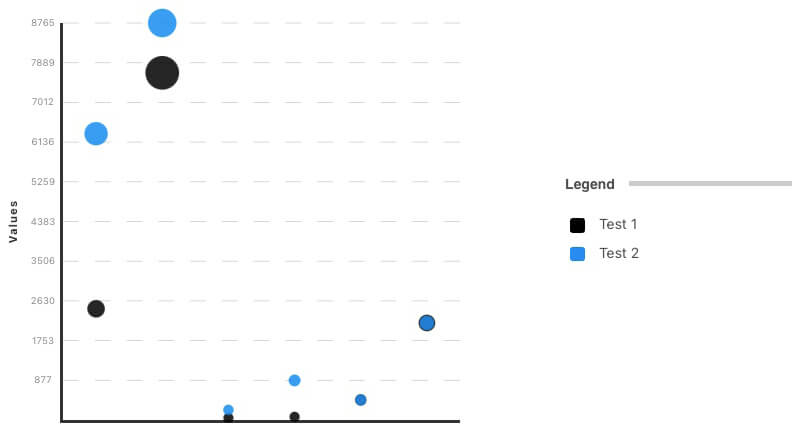
This plugin enhances your Docsify documentation by adding SVG charts to your website. It allows you to add in multiple types of charts, including pie, doughnut, sectional, radar, area, scatter, line, and bar types. By utilising this plugin, you can easily show your data in a beautiful interface.
There is a companion plugin, publish-plugin-charty, for Publish. The two share a stylesheet and produce byte-identical markup from the same chart definition, so a chart written once looks the same on either site.
Installation
Update index.html file
Assuming you have a working docsify framework set up, it is easy to use the plugin.
Add the following script and stylesheet to your
index.htmlvia either CDN or downloading it and using it locally:<!-- unpkg.com --> <script src="https://unpkg.com/@markbattistella/docsify-charty@latest/dist/docsify-charty.min.js"></script> <link rel="stylesheet" href="https://unpkg.com/@markbattistella/docsify-charty@latest/dist/docsify-charty.min.css"> <!-- jsDelivr --> <script src="https://cdn.jsdelivr.net/npm/@markbattistella/docsify-charty@latest"></script> <link rel="stylesheet" href="https://cdn.jsdelivr.net/npm/@markbattistella/docsify-charty@latest/dist/docsify-charty.min.css"> <!-- locally --> <script src="docsify-charty.min.js"></script> <link rel="stylesheet" href="docsify-charty.min.css">In docsify setup, configure the plugin:
<script>
window.$docsify = {
  charty: {

    // Global theme for chart colours in HEX
    theme: '.',

    // Accepts "dark" or "light"
    mode: "light",

    // Boolean to enable or disable debug messages
    debug: false
  }
};
</script>
Configuration
There are several options available for the docsify-charty plugin:
Example: index.html
| Name | Type | Example | Description |
|---------|-----------|-----------|-------------------------------------------|
| theme | String | "#EE5599" | Global theme for chart colours in HEX. Series colours are generated from it in OKLCH, so the steps are evenly spaced to the eye. Defaults to #0984E3 |
| mode | String | "system" | Accepts "light", "dark", or "system". Defaults to system, which follows the surrounding page rather than forcing a scheme |
| debug | Boolean | false | Console warnings when a chart can't be drawn, and why |
Per chart settings
| Name | Accepts | Description |
|-------------------|---------------|------------------------------------------|
| title | String | The title of the chart, displayed at the top. Leave blank if you want to hide it |
| caption | String | The sub-text of the chart, displayed under the title. Leave blank to hide it |
| type | String | The type of charty you want to display |
| options.theme | String | Set an individual theme to this chart. It will override the global theme |
| options.legend | Boolean | Show the legend. Default true |
| options.labels | Boolean | Show the chart labels. Default true |
| options.numbers | Boolean | Draw the value labels, revealed on hover. Default true |
| points | Array | Axis names for a radar chart. May also be given on the first data item |
| data.label | String | Graphed data point label |
| data.value | Int / Array | Graphed value that puts it on the render |
| data.colour | String | Override the global and theme with a specific colour |
Markdown code
```charty
{
  "title":   '',
  "caption": '',
  "type":    '',
  "options": {
    "theme":   '',
    "legend":  '',
    "labels":  '',
    "numbers": ''
  },
  "data": [
    {
      "label": '',
      "value": '',
      "colour": ''
    }
  ]
}
\`\`\`
Styling
Charty's own styles are plain class selectors — no cascade layer — so that a
host theme's generic resets can't override them. Notably, theme-simple and
several other Docsify themes ship an unlayered * { font-size: inherit }, which
inside a layer would resize every label in every chart.
To restyle something, write a rule of equal specificity after the stylesheet:
.charty { --charty-canvas: 34rem; }
.charty__title { font-size: 1.4em; }
The colour tokens (--charty-surface, --charty-text, --charty-muted,
--charty-line, --charty-axis, --charty-track, --charty-focus) all use
light-dark(), so overriding one means supplying both halves.
Types of charts
The images below were captured before 4.0 and don't reflect the current rendering. See the live docs at charty.docsify.markbattistella.com.
Circular
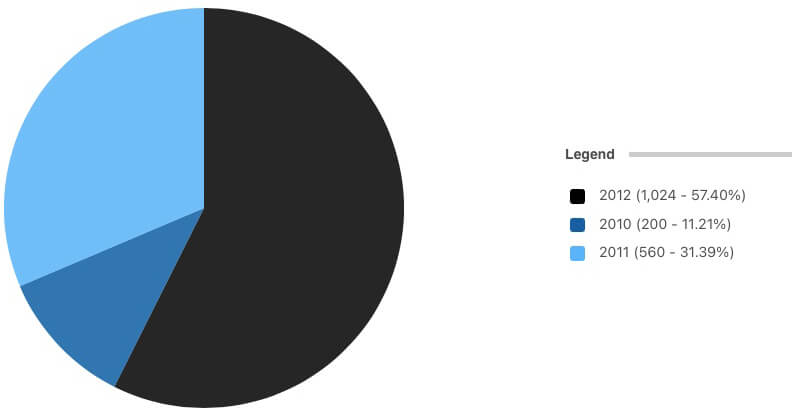
Pie chart
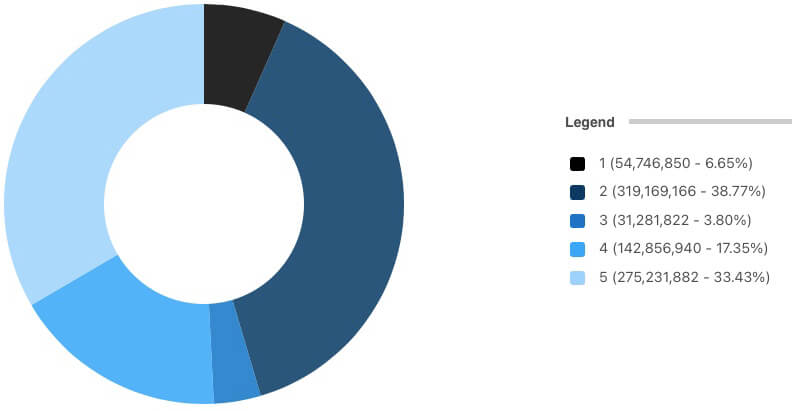
Donut / Doughnut chart
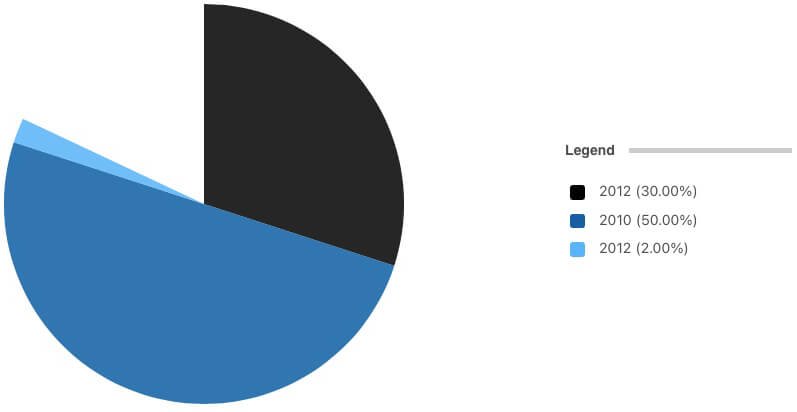
Section / Sectional chart
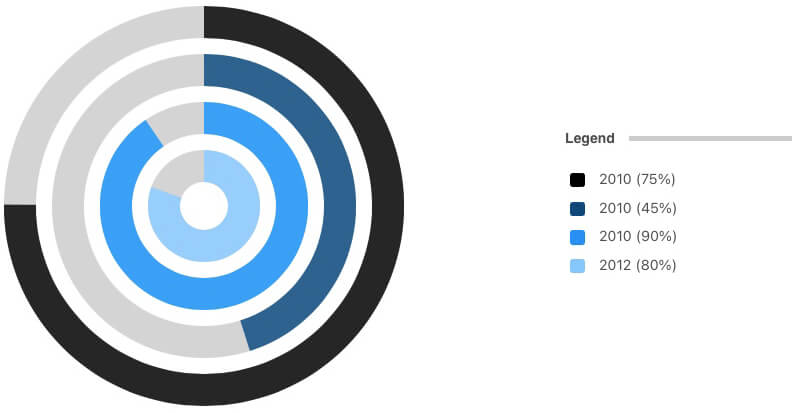
Rings chart
Area
Radar chart
Area chart
Plot
Scatter chart
Bubble chart
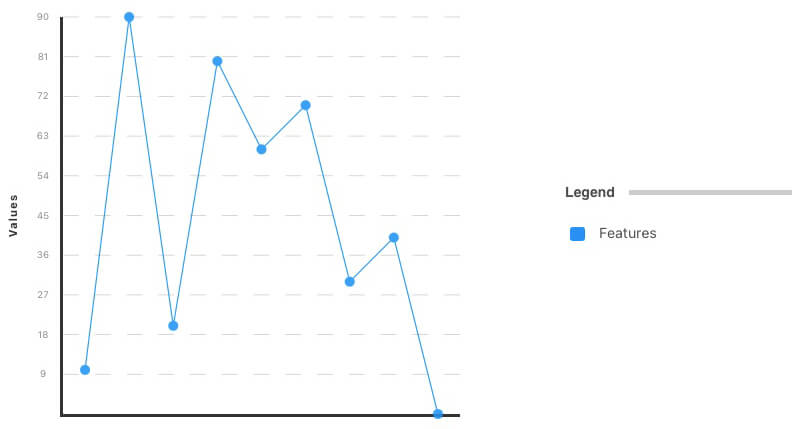
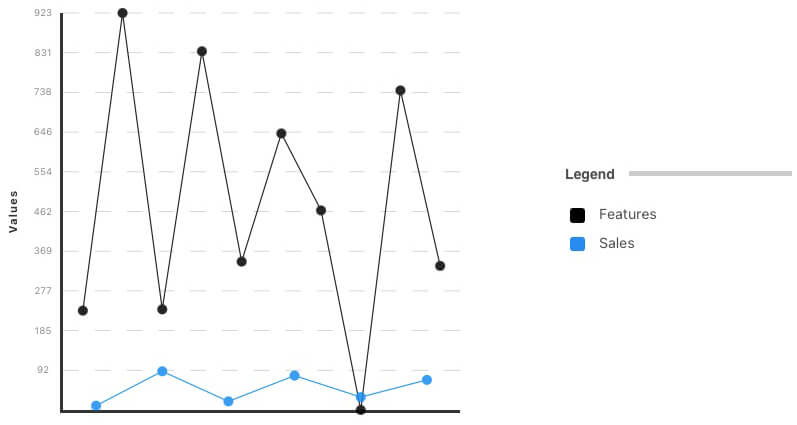
Line chart
Bar / Column
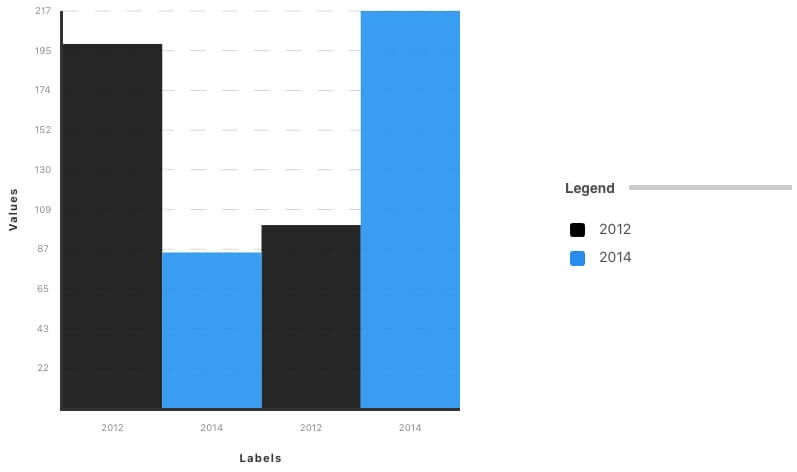
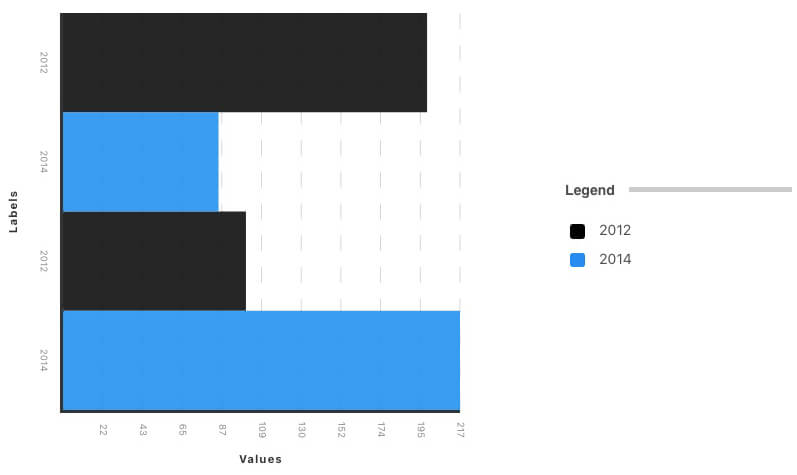
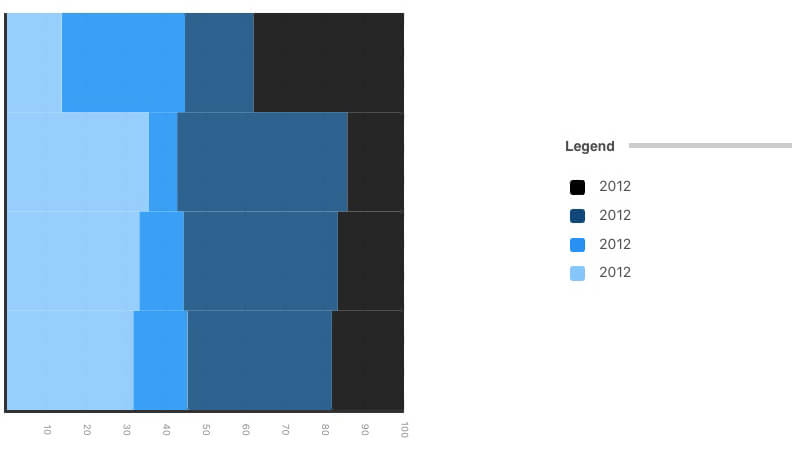
Bar / Bar-stack chart
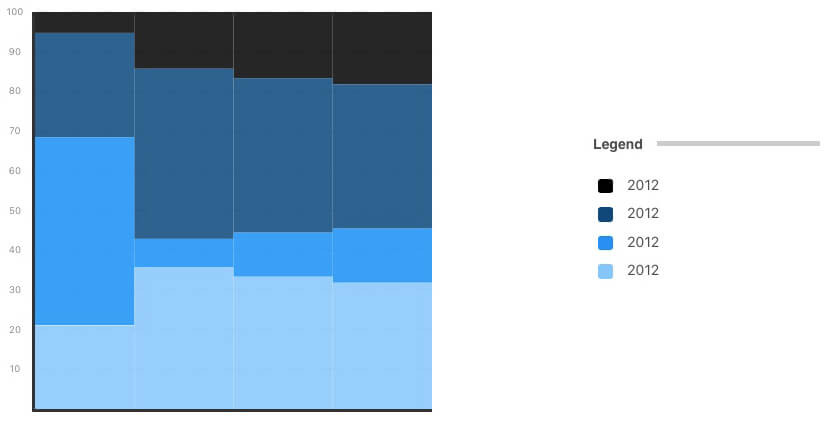
Column / Column-stack chart
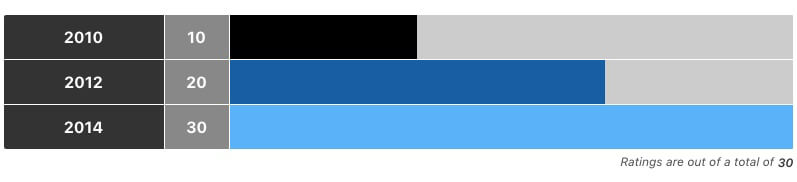
Rating
Contributing
Clone the repo:
git clone https://github.com/markbattistella/docsify-charty.gitCreate your feature branch:
git checkout -b my-featureCommit your changes:
git commit -am 'Add some feature'Pushto the branch:git push origin my-new-featureSubmit the
pullrequest