
@martinszeltins/log-proxy
v1.0.4
Published
A simple log service. Send logs via HTTP to this service and it will print them to the console.
Maintainers
 martinszeltins
Readme
Log Proxy Server
A simple Node.js HTTP server for remote logging during debugging sessions. When you can't access console logs or they don't show up, send them to this proxy server instead!
Quick Start
$ npx @martinszeltins/log-proxyInstall dependencies:
$ npm installStart the server:
$ node app.jsSend log messages:
// Basic log message (defaults to INFO level)
fetch('http://localhost:23465', {
    method: 'POST',
    headers: {
        'Content-Type': 'application/json'
    },
    body: JSON.stringify({ message: 'This is a log message' })
});

// Log message with specific level
fetch('http://localhost:23465', {
    method: 'POST',
    headers: {
        'Content-Type': 'application/json'
    },
    body: JSON.stringify({
        message: 'Database connection failed',
        level: 'ERROR'
    })
});
Create a simple wrapper function
const log = (...messages) => {
    messages.forEach(message => {
        fetch('http://localhost:23465', {
            method: 'POST',
            headers: {
                'Content-Type': 'application/json'
            },
            body: JSON.stringify({ message })
        });
    });
}
log('Hello, this is a test log message!');
log(userObject);
log('User ID:', 12345, 'Status:', 'active', { timestamp: Date.now() });
log('Multiple', 'arguments', 'are', 'supported!');Usage Examples
From JavaScript/Browser
// Simple debug message (defaults to INFO)
fetch('http://localhost:23465', {
    method: 'POST',
    headers: { 'Content-Type': 'application/json' },
    body: JSON.stringify({ message: 'User clicked button' })
});

// Log with specific level
fetch('http://localhost:23465', {
    method: 'POST',
    headers: { 'Content-Type': 'application/json' },
    body: JSON.stringify({
        message: 'High CPU usage detected',
        level: 'WARN'
    })
});

// Error logging
fetch('http://localhost:23465', {
    method: 'POST',
    headers: { 'Content-Type': 'application/json' },
    body: JSON.stringify({
        message: 'Failed to save user data',
        level: 'ERROR'
    })
});

// Debug logging with variable values
const userData = { id: 123, name: 'John' };
fetch('http://localhost:23465', {
    method: 'POST',
    headers: { 'Content-Type': 'application/json' },
    body: JSON.stringify({
        message: `User data: ${JSON.stringify(userData)}`,
        level: 'DEBUG'
    })
});
From cURL
# Basic INFO log
curl -X POST http://localhost:23465 \
  -H "Content-Type: application/json" \
  -d '{"message": "Test message from cURL"}'

# Error log
curl -X POST http://localhost:23465 \
  -H "Content-Type: application/json" \
  -d '{"message": "Connection timeout", "level": "ERROR"}'

# Warning log
curl -X POST http://localhost:23465 \
  -H "Content-Type: application/json" \
  -d '{"message": "Memory usage above 80%", "level": "WARN"}'
From PHP
Create a simple wrapper function:
function log_message(...$messages) {
    foreach ($messages as $message) {
        $data = json_encode(['message' => $message]);

        $context = stream_context_create([
            'http' => [
                'method' => 'POST',
                'header' => 'Content-Type: application/json',
                'content' => $data
            ]
        ]);

        file_get_contents('http://localhost:23465', false, $context);
    }
}
log_message('Hello, this is a test log message!');
log_message($userObject);
log_message('User ID:', 12345, 'Status:', 'active', ['timestamp' => time()]);
log_message('Multiple', 'arguments', 'are', 'supported!');Test Script
Run the included test script to see the server in action:
node test.jsEndpoints
POST / - Send log messages
- Body:
{ "message": "your log message", "level": "INFO|WARN|ERROR|DEBUG" } - Level is optional, defaults to "INFO"
- Returns:
{ "status": "success", "timestamp": "...", "level": "INFO" }
- Body:
GET / - Health check and usage information
- Returns server status and usage examples
Log Levels
The server supports standard log levels with color coding:
- INFO (Green) - General information messages
- WARN (Yellow) - Warning messages
- ERROR (Red) - Error messages
- DEBUG (Cyan) - Debug/development messages
If no level is specified, messages default to INFO level.
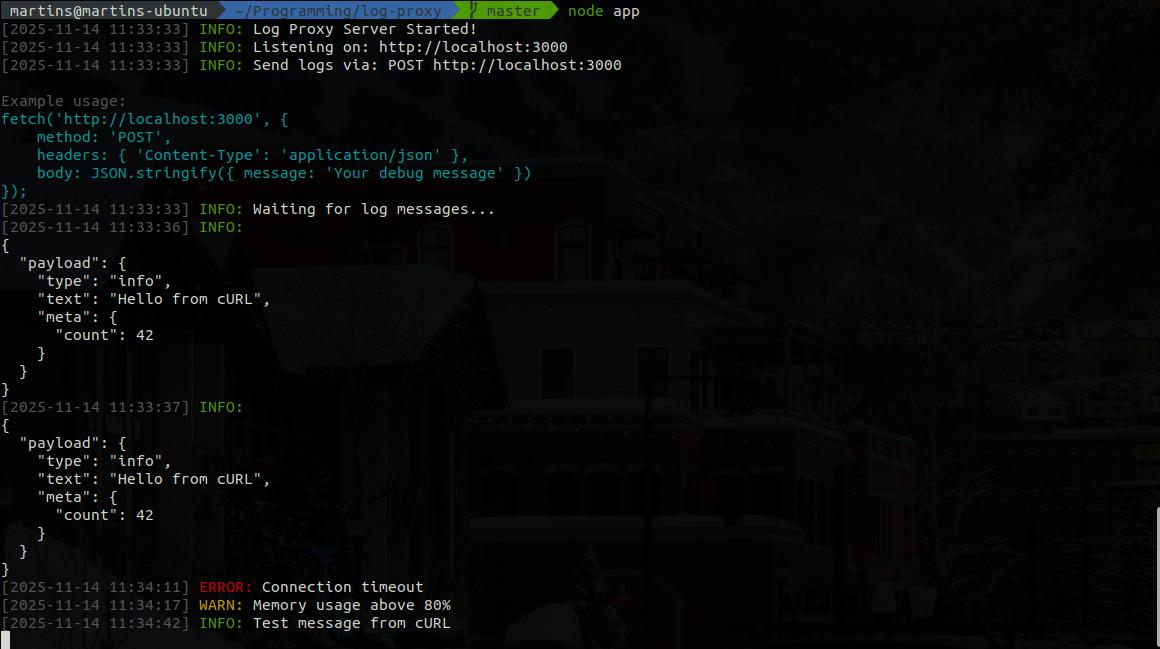
Console Output Format
When a log message is received, the server prints in traditional format:
[2024-11-14 10:30:45] INFO: Your debug message here
[2024-11-14 10:30:46] ERROR: Something went wrong
[2024-11-14 10:30:47] WARN: High memory usage detected
The output includes:
- Gray timestamp in
[YYYY-MM-DD HH:MM:SS]format - Colored log level (INFO=green, WARN=yellow, ERROR=red, DEBUG=cyan)
- White message text for optimal readability
Configuration
The server runs on port 23465 by default. You can modify the port variable in app.js if needed.
Stopping the Server
Press Ctrl+C to gracefully stop the server.
Perfect for:
- Debugging applications where console.log doesn't work
- Remote debugging scenarios
- Testing and development environments
- Quick log aggregation during development