
@merryjs/react-native-charts
v1.0.0-beta5
Published
This library is React Native wrapper of popular Native charting library [MPAndroidChart](https://github.com/PhilJay/MPAndroidChart) and [Charts](https://github.com/danielgindi/Charts)

Readme
React Native Charts Wrapper
This library is React Native wrapper of popular Native charting library MPAndroidChart and Charts
Introduction
Inspired by react-native-mp-android-chart and react-native-ios-charts
React Native Charts Wrapper is built on MPAndroidChart(v3.0.1) & Charts(v3.0.1), support both android & ios.
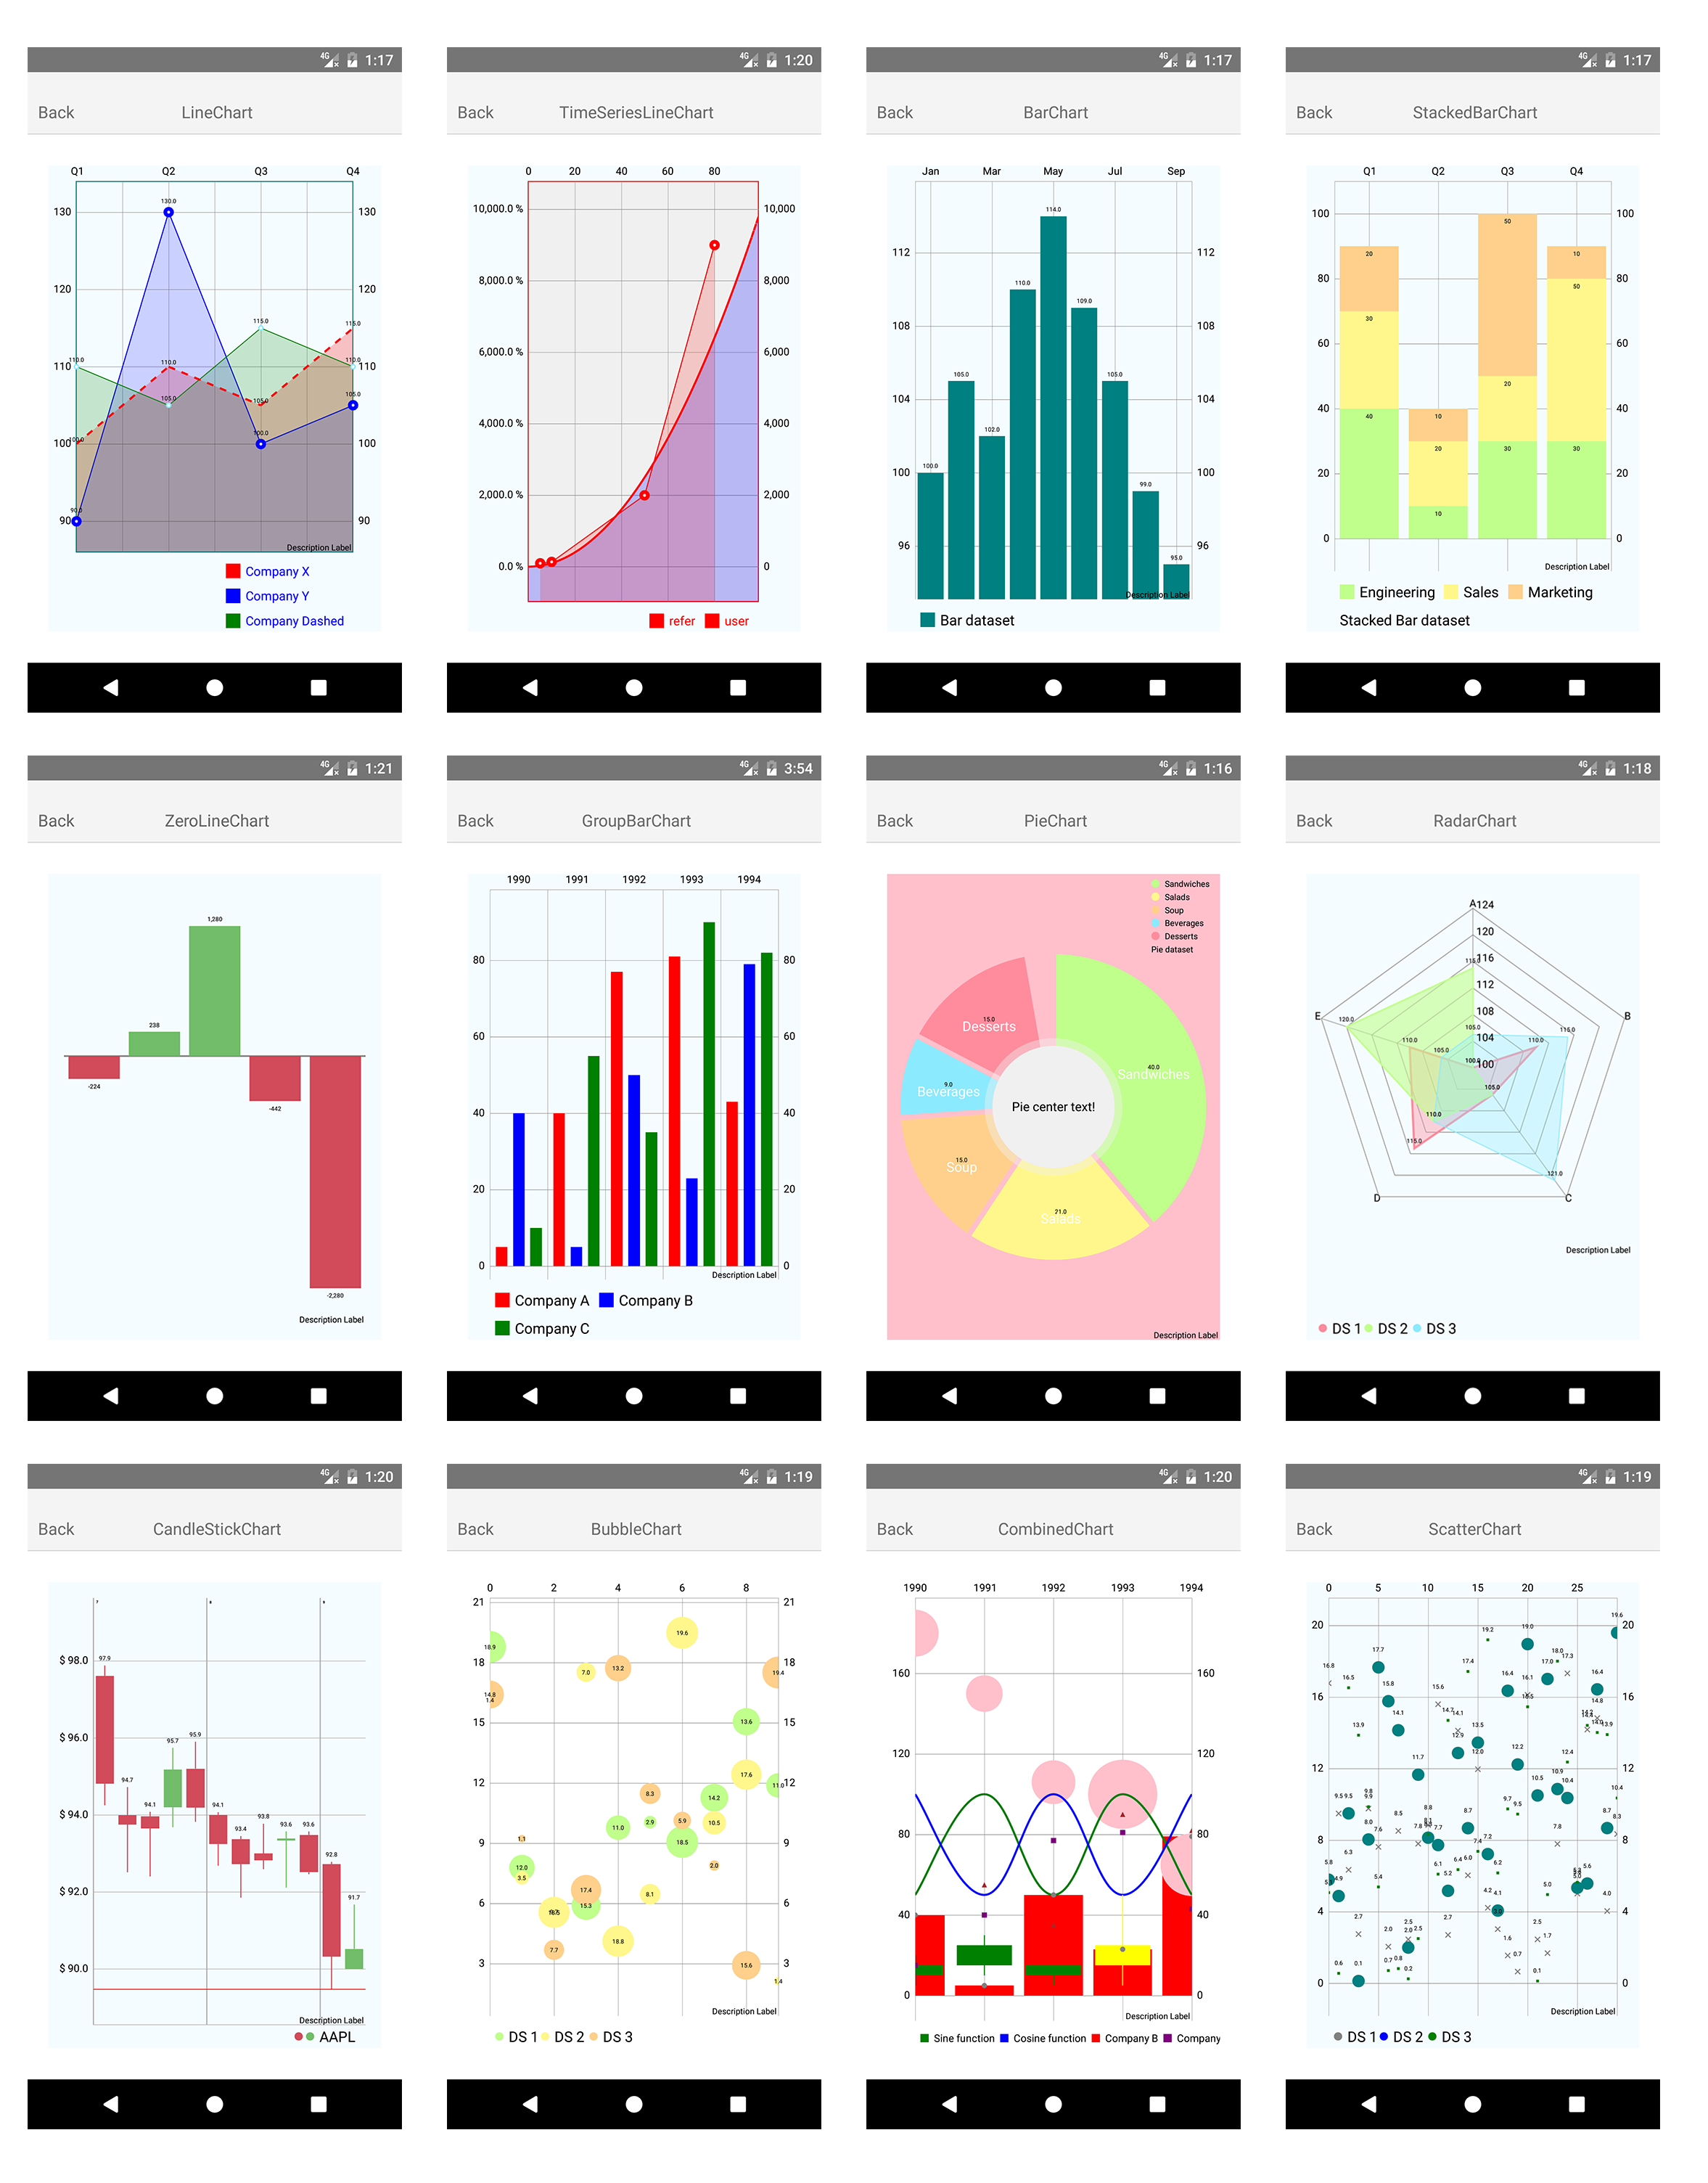
ANDROID Download Example Apk
IOS
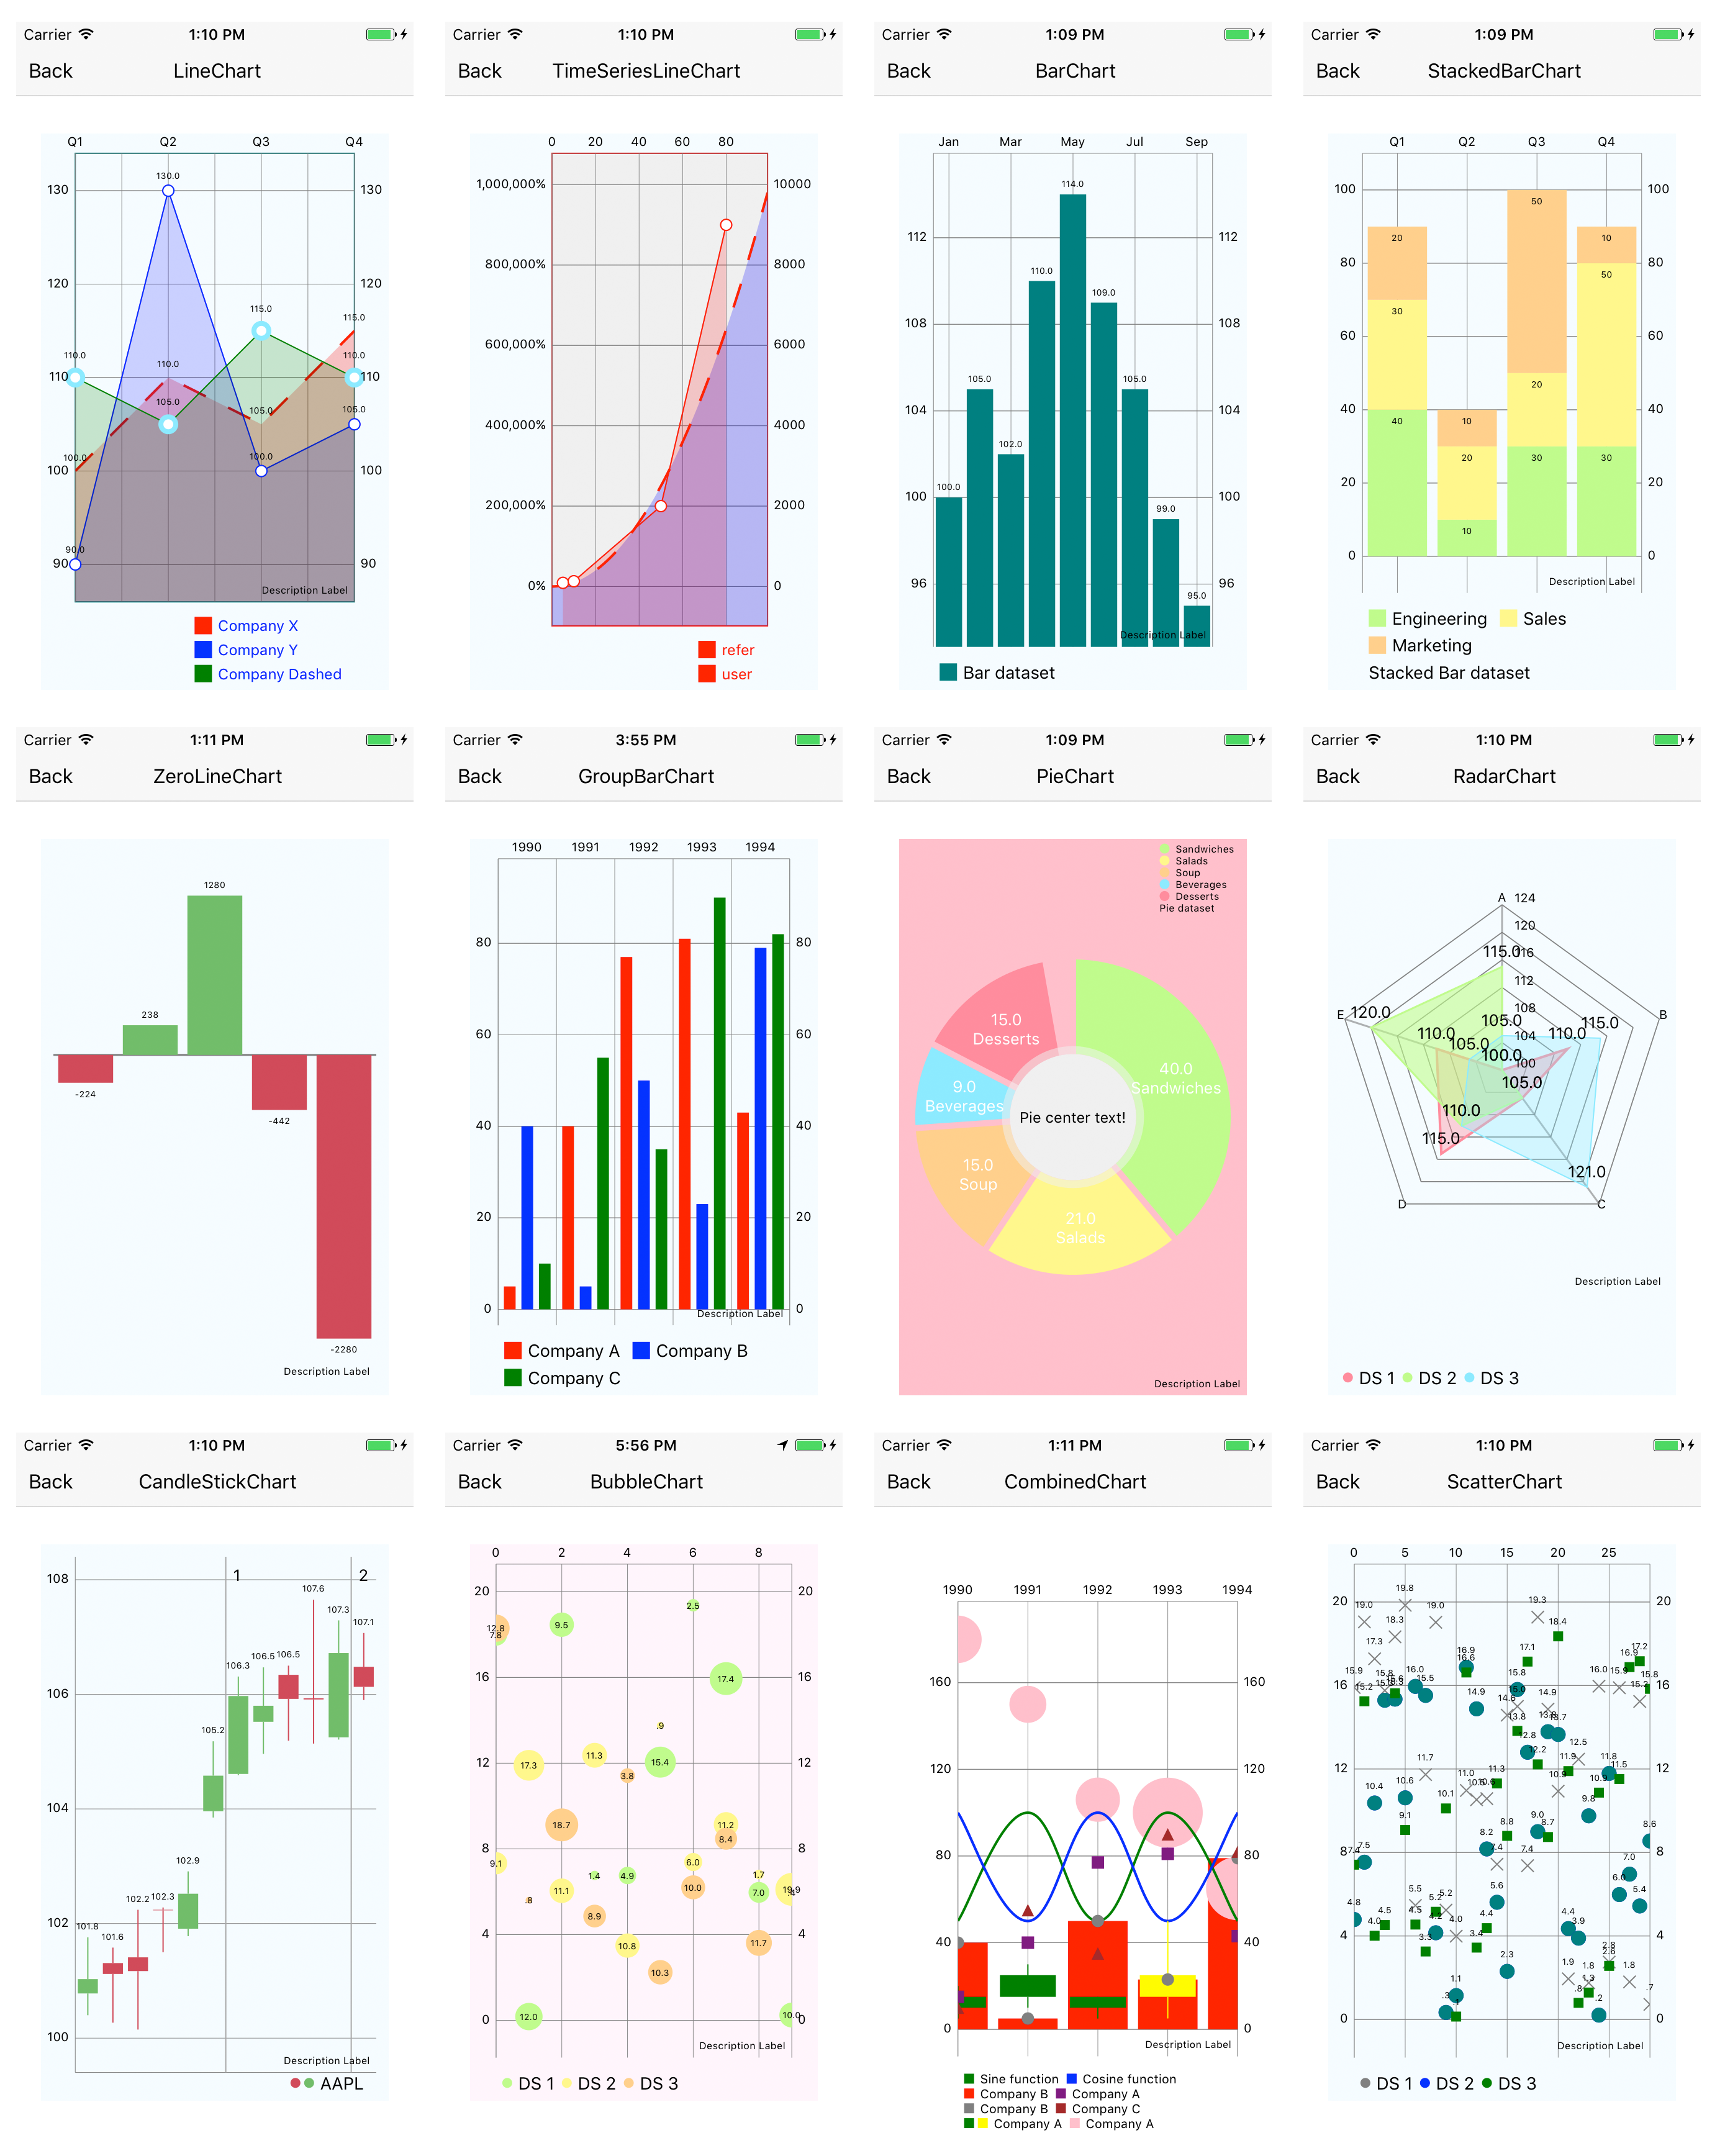
Supported Chart Type
- Bar(Stack,Group)
- Line
- Scatter
- Bubble
- Pie
- Radar
- Combined
- CandleStick
Setup
A step by step tutorial to set up a new project can be found here
Library can be easily installed using NPM:
npm install --save @merryjs/react-native-charts
or
yarn add @merryjs/react-native-charts
Additional setup is required because library is using native code.
ANDROID
1. Add Maven Repository
android/build.gradle
allprojects {
    repositories {
        ...

        maven { url "https://jitpack.io" }    // used for MPAndroidChart
    }
}
2. Add Maven Dependency
Mostly automatic install with react-native
react-native link react-native-chartsManual install
android/settings.gradle
include ':@merryjs/react-native-charts'
project(':@merryjs/react-native-charts').projectDir = new File(rootProject.projectDir, '../node_modules/@merryjs/react-native-charts/android')
android/app/build.gradle
dependencies {
    ...
	compile project(':@merryjs/react-native-charts')
}
MainApplication.java
On top where imports are:
import com.github.wuxudong.rncharts.MPAndroidChartPackage;Add package in getPackages method:
protected List<ReactPackage> getPackages() {
    return Arrays.<ReactPackage>asList(
        new MainReactPackage(),
        new MPAndroidChartPackage()             // <----- Add this
    );
}
IOS
1. Add Source Files
add directory node_modules/@merryjs/react-native-charts/ios/ReactNativeCharts under your project top level. (In Xcode: File -> Add files to "App Name")
2. Add Bridge File
When you add the files XCode should prompt you to create a bridging header if you haven't done so already, or you can create empty swift file to trigger xcode prompt. Create the bridging header and import the RCTViewManager.h. It should look something like this.
	#import "React/RCTBridge.h"
	#import "React/RCTViewManager.h"
	#import "React/RCTUIManager.h"
	#import "React/UIView+React.h"
	#import "React/RCTBridgeModule.h"
	#import "React/RCTEventDispatcher.h"
	#import "React/RCTEventEmitter.h"
You should make sure set this file in your target -> Build Settings -> Swift Compiler - General -> Object-C Bridging Header
3. Add Charts and SwiftyJSON
- Mostly automatic install
add a Podfile to your ios directory with the following content. Then run pod install and open the generated .xcworkspace from now on in xcode.
use_frameworks!

target 'MyApp' do
  pod 'SwiftyJSON', '3.1.4'
  pod 'Charts', '3.0.1'
end

post_install do |installer|
  installer.pods_project.targets.each do |target|
    target.build_configurations.each do |config|
      config.build_settings['SWIFT_VERSION'] = '3.0'
    end
  end
end- Manual install
- Install SwiftyJSON and iOS Charts libraries and add
SwiftyJSON.xcodeprojandCharts.xcodeprojfiles to your project. - Under
Build Phases, underLink Binary With Libraries, click the plus sign and addSwiftyJSON.frameworkandCharts.framework. - Add the
SwiftyJSON.frameworkandCharts.frameworkto theEmbedded Binariessection in your app. - In your project's build settings, go to build options and change the
Embedded Content Contains Swift CodetoYes.
Usage
There are 8 supported charts with many configuration options. Almost all configuration available in base MPAndroidChart library are available through this wrapper. More details on available configuration can be found on their wiki.
Example of how charts are used and how to apply configuration can be found in example.
Convention
Android and IOS have different convention:
- color's alpha in android is 0-255, in ios is 0-1
- percent in android is 0-100, in ios is 0-1
- animation.duration in MpAndroidChart is milliseconds, in Charts is seconds.
- their enum case name is always different, for example XAxisPosition, in MpAndroidChart is BOTH_SIDED, in Charts is bothSided.
Here we use android Convention
Always use processColor to set color
Data Format
Complete Form
  data : {
  	...
  	dataSets: [
  		{
  			values: [
  				{x: 5, y: 90},
  		        {x: 10, y: 130},
  		        {x: 50, y: 2000, marker: "eat more"},
  		        {x: 80, y: 9000, marker: "eat less"}
  	    	]
  	    },
  	    ...
  	]
  }
marker is optional, if x is omitted, index will be used.
Simplified Form
  data: {
  	...
      dataSets: [
      	{
        		values: [5, 40, 77, 81, 43]
        	},
        	....
      ]
  }
index will used as x.
check Example->TimeSeriesLineChart for details
Callback
Support value selection callBack.
you can do whatever you want, even pop your own modal, or jump to another page.
Custom Marker Content
Support custom marker content.
check Example->TimeSeriesLineChart for details.
Notice
Several settings are removed.
- fontFamily & fontStyle
The font is a little different in android & ios, I don't know how to configure it in js in the same way.
- pie's entryLabelTextSize & entryLabelColor
MpAndroidChart & Charts are dealing pie's entryLabel in a different way, currently the settings of pie's entryLabelTextSize & entryLabelColor can only work in android.
size of chart
you can set chart to fixed width & height, or flex:1
Need for help
I spent serveral days to learn swift and ios, but I am still quite new to it.
It is not quite elegant to copy source files to your project, but I haven't figure out how to build it as a framework like others.
Here is the question in stackoverflow.
It is appreciated if you can answer the question or create a issue/PR.
License
The MIT License
Copyright (c) 2017 wuxudong
Copyright (c) 2016 Martin Skec
Copyright (c) 2016 Jose E. Padilla
Permission is hereby granted, free of charge, to any person obtaining a copy of this software and associated documentation files (the "Software"), to deal in the Software without restriction, including without limitation the rights to use, copy, modify, merge, publish, distribute, sublicense, and/or sell copies of the Software, and to permit persons to whom the Software is furnished to do so, subject to the following conditions:
The above copyright notice and this permission notice shall be included in all copies or substantial portions of the Software.
THE SOFTWARE IS PROVIDED "AS IS", WITHOUT WARRANTY OF ANY KIND, EXPRESS OR IMPLIED, INCLUDING BUT NOT LIMITED TO THE WARRANTIES OF MERCHANTABILITY, FITNESS FOR A PARTICULAR PURPOSE AND NONINFRINGEMENT. IN NO EVENT SHALL THE AUTHORS OR COPYRIGHT HOLDERS BE LIABLE FOR ANY CLAIM, DAMAGES OR OTHER LIABILITY, WHETHER IN AN ACTION OF CONTRACT, TORT OR OTHERWISE, ARISING FROM, OUT OF OR IN CONNECTION WITH THE SOFTWARE OR THE USE OR OTHER DEALINGS IN THE SOFTWARE.