
@mosetta/ide-plugin-debug
v0.0.14
Published
DAP through vscode-js-debug: breakpoints that remember their line, stepping, variables, and a browser opened under the debugger when your server prints its address.

Maintainers
 pre-fabricated
Readme
Debugger
@mosetta/ide-plugin-debug · DAP through vscode-js-debug: breakpoints that remember their line, stepping, variables, and a browser opened under the debugger when your server prints its address.
What it does
Debug a file, an npm script, or a page in the browser. The program runs in a real terminal of the IDE, with the debugger attached, and the panel shows where it stopped.
- Breakpoints in the editor's gutter, with conditions, hit counts and logpoints that print instead of stopping. A breakpoint follows its line when you edit above it.
- Exceptions: stop on none, on uncaught ones, or on all of them.
- When stopped: the line being executed, the stack, the variables and scopes, watches, the value under the pointer, and a console that evaluates in the stopped frame.
- Your server and its page together: when the program prints a local address (Vite,
Next, Storybook and plain
http.Serverall do), the page opens in Chrome under the same debugger, so a breakpoint in browser code stops too. - Code outside the project — Node's internals,
node_modules— opens read-only when the stack leads there.
Keys
| Command | macOS | Windows and Linux |
|---|---|---|
| panel.debug — the debugger panel | Cmd+Shift+D | Ctrl+Shift+D |
| debug.file — debug the open file | Shift+F9 | Shift+F9 |
| debug.runFile — run it without the debugger | Shift+F10 | Shift+F10 |
| debug.toggleBreakpoint | Cmd+F8 | Ctrl+F8 |
| debug.continue | F9 | F9 |
| debug.stepOver / stepInto / stepOut | F8 / F7 / Shift+F8 | F8 / F7 / Shift+F8 |
| debug.stop | Cmd+F2 | Ctrl+F2 |
Settings
Section debug in settings.json:
| Key | Default | What it does |
|---|---|---|
| openBrowser | true | Open the address a program prints in the browser, under the debugger. |
| serverReady | localhost, 127.0.0.1 and 0.0.0.0 URLs | The regular expression an address is recognised by. |
| browser | empty — the installed Chrome | canary, dev, edge, or a path to a browser. |
| browserArgs | none | Arguments for the browser, such as --headless=new. |
| webRoot | empty — the project root | Where the dev server serves files from, relative to the root; packages/site in a monorepo. |
Screenshots and demos
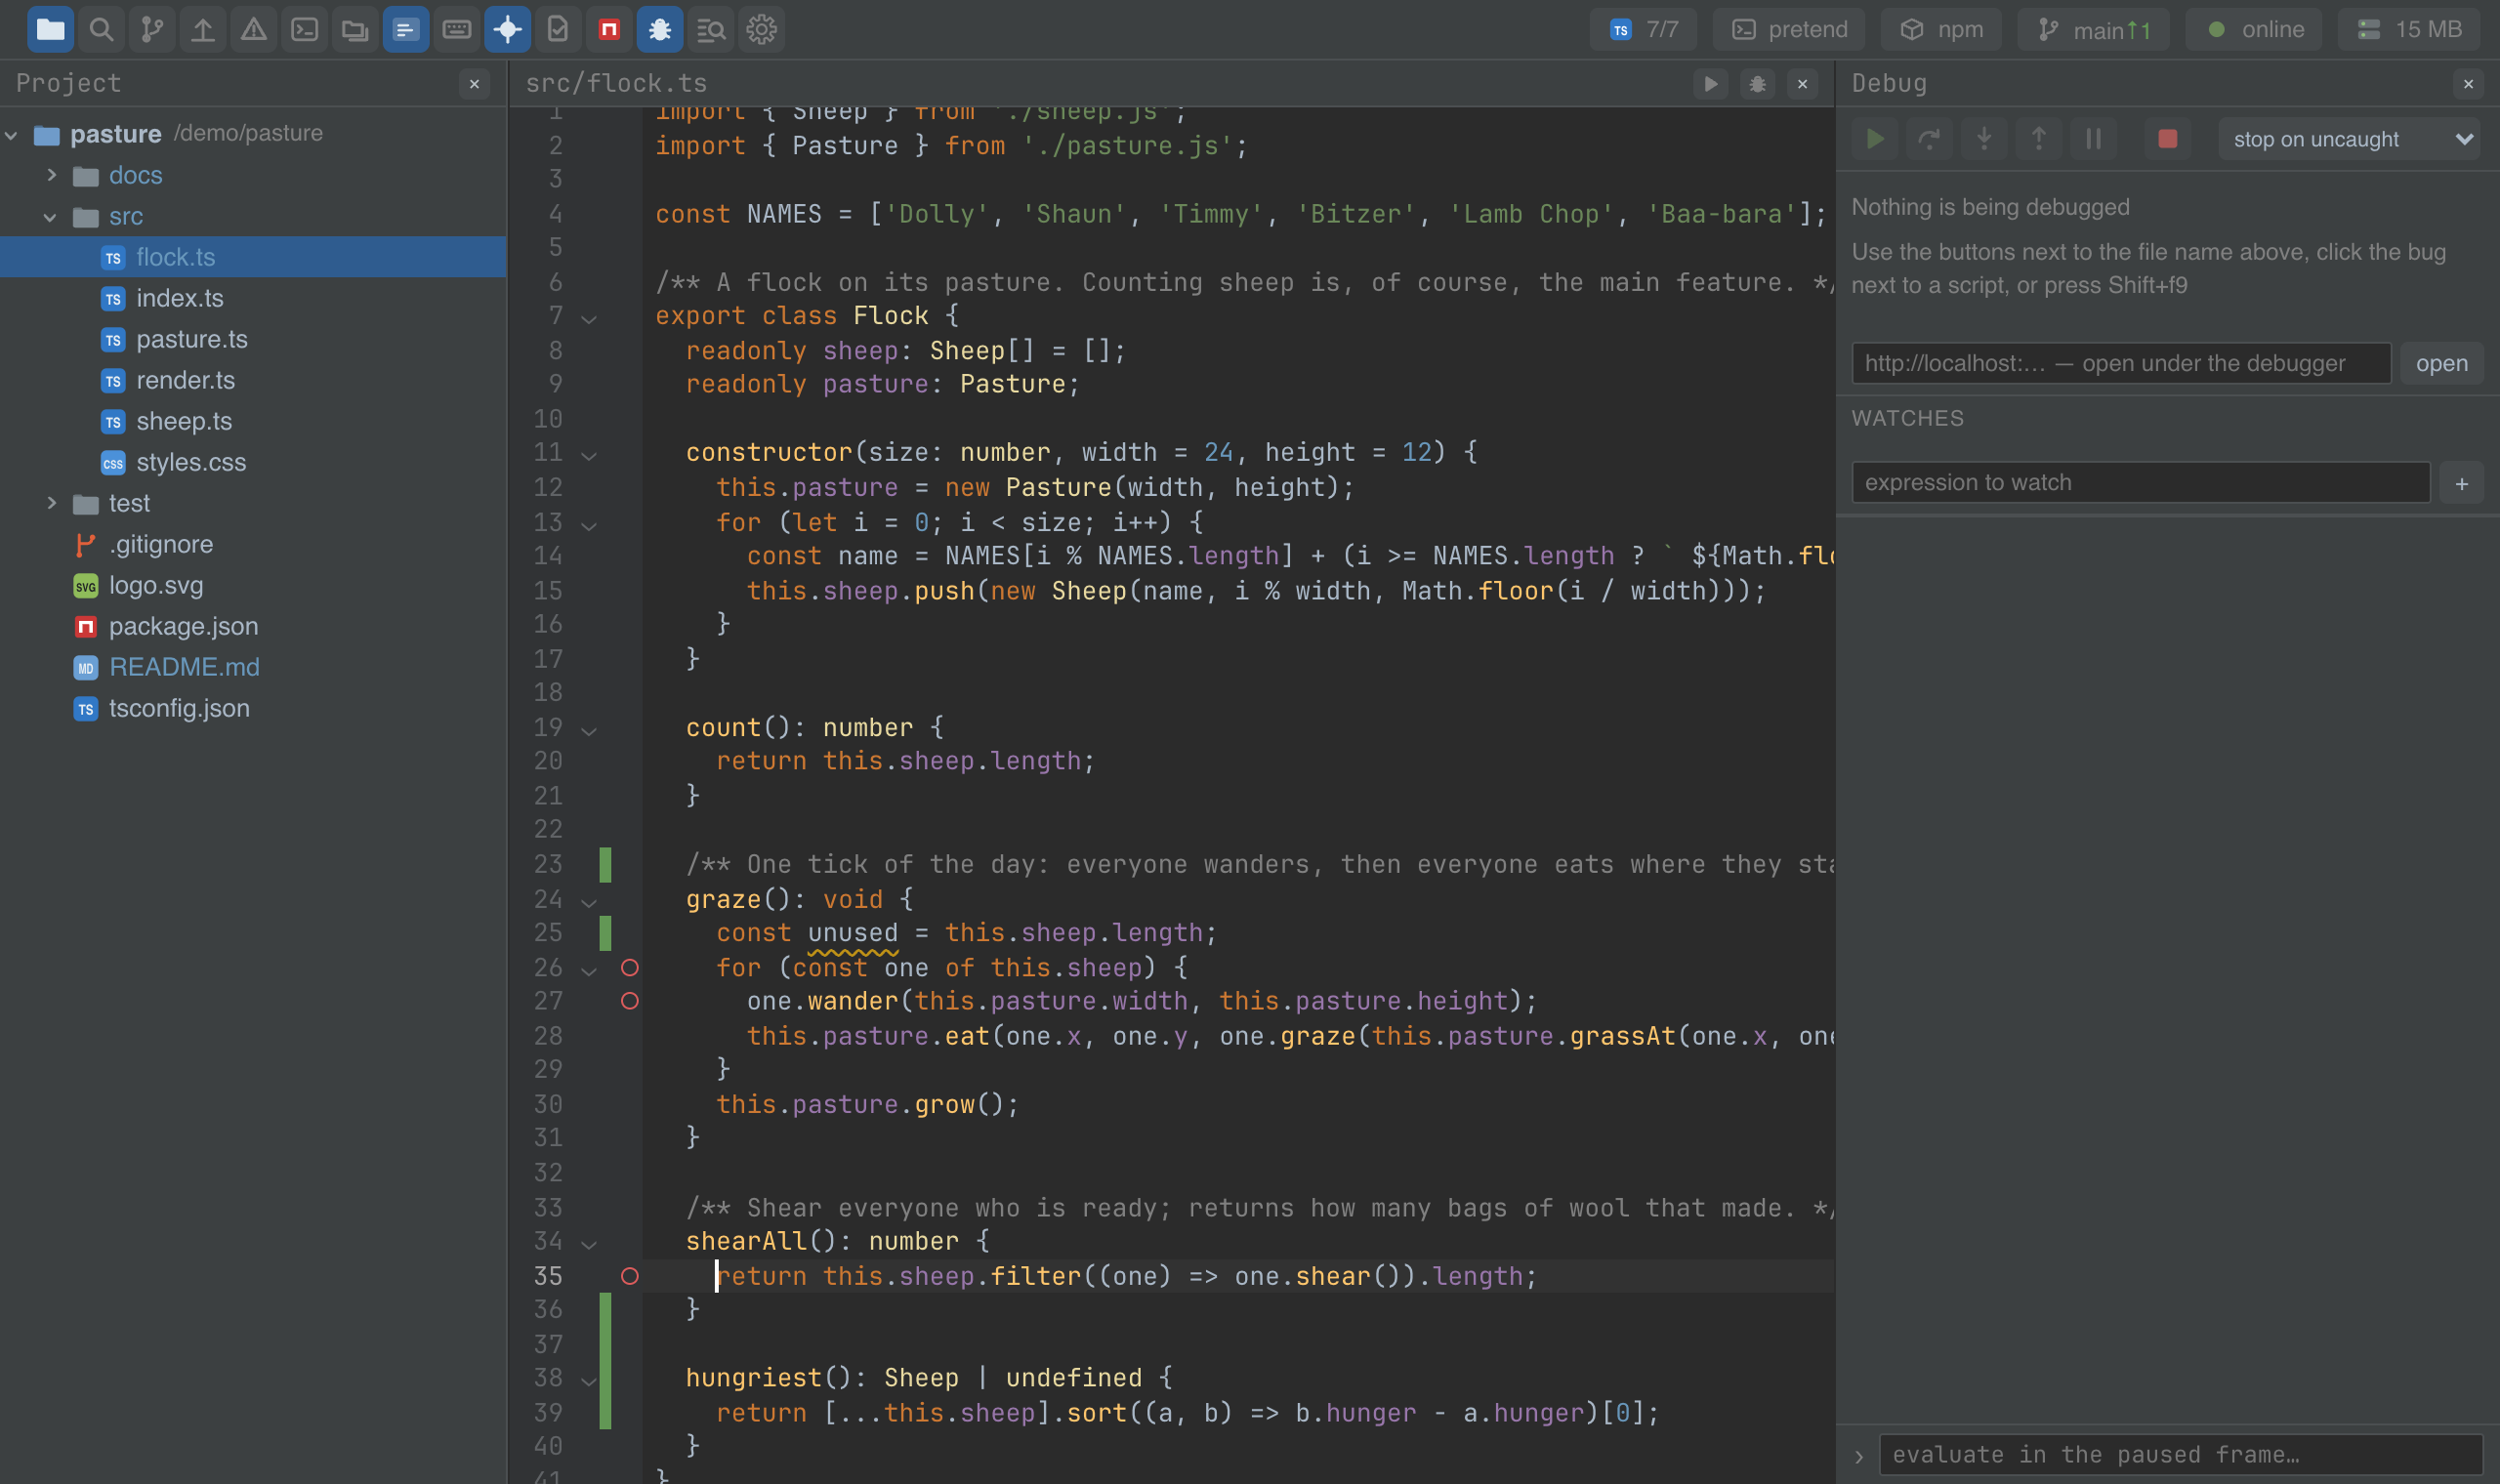
Try it in the browser — breakpoints can be set there; running needs the IDE on your machine.
Using it from another plugin
import DebugPlugin from '@mosetta/ide-plugin-debug';

const debug = this.ide.getPlugin(DebugPlugin);

await debug.launch({ name: 'seed', program: 'scripts/seed.ts', args: ['--small'] });
await debug.debugScript('pasture::dev');        // an npm script, the way the terminal runs it
await debug.openUrl('http://localhost:5173/');  // a page in Chrome, under the debugger

debug.state; // runs, sessions, where it is paused, breakpoints — as signals
launch takes a program or a url, and optionally name, runtime and
runtimeArgs, args, cwd and env. The panel opens by itself.
The debugger plugs itself into the rest of the IDE through the same registry keys any
plugin can use: editor.extension for the gutter and the current line, editor.hover for
values under the pointer, file.view for code outside the project, panel.action for
run and debug in the editor's header, tree.action for the tree's context menu and
scripts.action for debug next to a script.
Maintaining the adapter
The adapter lies in vendor/js-debug as released, with no edits; its version, address
and checksum are in vendor/js-debug.json. It is not published on npm, and the IDE
brings its own tools along, so it lives in the repository.
To update it: download js-debug-dap-v<version>.tar.gz from the releases of
microsoft/vscode-js-debug, unpack it in place of vendor/js-debug, rewrite
vendor/js-debug.json (the version, the address, shasum -a 256) and run
pnpm --filter @mosetta/ide-plugin-debug test — the tests talk to the real adapter and
guard the parts of it that are not documented.