
@noname260588/pm2-watch
v1.2.12
Published
PM2-Watch PRO - Advanced PM2 Monitoring

Readme
🚀 PM2-Watch PRO
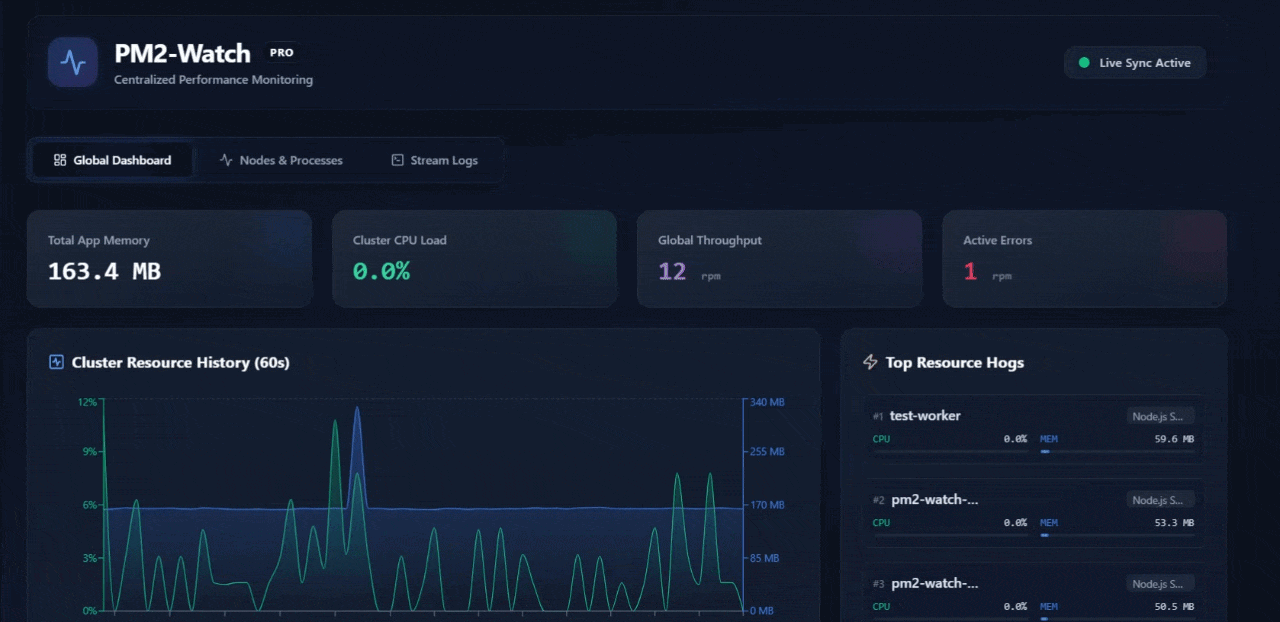
PM2-Watch PRO is a real-time Centralized Monitoring System for Node.js clusters managed by PM2. Designed with a Hub-and-Spoke architecture and a modern Glassmorphism Dark Mode UI, it delivers an experience on par with professional APM (Application Performance Monitoring) solutions.
 (Live Demo)
🌟 Key Features
- 💻 System-Level Metrics: Monitors not only Node.js processes but also displays real-time CPU Load, RAM Consumption, and Host OS Uptime.
- 📈 Real-time APM & Custom Metrics:
- Auto-integrates with
@pm2/io. - Network flow monitoring: RPM (Requests Per Minute) and Latency.
- Auto-discovers and displays Custom Metrics (e.g., Active DB Connections, External API Calls).
- Auto-integrates with
- 📊 Drill-down Charts: Click on any Worker to view real-time hardware (CPU/RAM) and network (Req/min, Latency) line charts (
Recharts) over the last 60 seconds. - 🚨 Smart Alerts: Instant toast notifications when CPU exceeds 80% or a process crashes.
- 📜 Live Log Streaming & FlexSearch:
- Stream logs (stdout/stderr) from all servers in real-time.
- Built-in FlexSearch engine enables lightning-fast Client-side Full-text search for errors directly in your browser.
- ⚡ Remote Action Gateway: Remotely interact with processes (Restart/Stop) right from the Dashboard via secure WebSockets.
- 💾 Zero-Config Auto Log Rotation: Built-in log rotation engine running entirely inside the Agent. No external modules needed. Automatically rotates logs when they reach 10MB, compresses them using Gzip (.gz) to save disk space, and automatically purges files older than 7 days! Protects your servers from disk exhaustion.
🏗 System Architecture
The system is built on a complete Hub-and-Spoke model, divided into 3 main components (Monorepo):
/backend(Hub - Central Server):- Central server built on Express & Socket.io.
- Manages the entire State and connection status of all connected Spokes (Agents).
- Acts as a Router, directing Log Streams and remote control commands (Restart/Stop) from the Frontend down to the correct Agent.
- Serves the compiled static assets (Frontend Build) in Production mode.
/agent(Spoke - Node Client):- Installed directly on the servers you want to monitor (where PM2 is running).
- Metrics Collector: Hooks deeply into the PM2 Bus API (
pm2.launchBus) to extract metrics (CPU, RAM, Req/min, Latency) and PM2 events. - Log Streamer: Streams live stdout/stderr logs in real-time.
- Zero-Config Log Rotator: An internal log lifecycle management engine (auto-rotates >10MB, gzips, deletes old files) embedded directly within the process to avoid relying on buggy OS-level logrotate modules.
- Note: The Agent automatically hides internal processes (
pm2-watch-agent,pm2-watch-backend) from the dashboard to prevent accidental shutdown.
/frontend(Dashboard UI):- Built with React + Vite + TailwindCSS featuring a Glassmorphism design.
- Global Dashboard: Automatically aggregates and calculates resources (Aggregated Metrics) across the entire Cluster/Grid of independent servers.
- Real-time Engine: Continuous Socket.io connection to render smooth Recharts graphics.
- FlexSearch Integration: Indexes and allows lightning-fast Full-text search of log contents for any Worker right in the browser (Client-side Search).
🚀 1-Click Production Deployment
Instead of cloning the source code and typing commands manually, PM2-Watch PRO has been packaged as a professional Global CLI Tool.
Step 1: Install from NPM (Requires Node.js)
npm install -g @noname260588/pm2-watchStep 2: Start the System Simply type this single command anywhere:
pm2-watch startThis command will start 2 background processes:
pm2-watch-backend: The central hub and static file server running on port 2605.pm2-watch-agent: The internal data collection agent.
Open your browser at: http://localhost:2605
Available CLI Commands:
pm2-watch start: Start the monitoring system.pm2-watch stop: Stop the system.pm2-watch logs: View central server logs.
Note: To have PM2 automatically start the system upon VPS reboot, run pm2 save and pm2 startup.
🔄 Update / Uninstall Guide
Update to the latest version:
pm2-watch stop
npm cache clean --force
npm install -g @noname260588/pm2-watch
pm2-watch start
Completely remove from the system:
pm2 delete pm2-watch-agent pm2-watch-backend
npm uninstall -g @noname260588/pm2-watch
🐳 Docker Deployment (Docker Compose)
If you prefer not to install Node.js directly on your server, you can run PM2-Watch PRO as a Docker Container. Remarkably, the Agent inside the Container can still monitor PM2 running on the Host machine!
Start with Docker Compose:
git clone https://github.com/noname260588/pm2-watch.git
cd pm2-watch
docker-compose up -d --build
The Secret Sauce:
The system uses volume mounting ~/.pm2:/root/.pm2:ro to allow the Agent inside the container to connect to the PM2 RPC Socket running on the Host machine.
🔐 Future Roadmap
- Add Token Authentication for Agents and Frontend.
- Long-term Log and History storage in a Database (MongoDB/ClickHouse).
- Role-based Access Control (RBAC).
Developed with passion for High-Performance Node.js Monitoring.