
@pbrgld/loggify
v0.5.6
Published
A lightweight, dependency-free logging library for Bun.js and Node.js – featuring emoji support, styled output, contextual logging, and high-performance stdout logging.
Downloads
213
Maintainers
 pbrgld
Readme
@pbrgld/Loggify


⚠️ Project Status: Early Development ⚠️
🚧 Warning: Loggify is currently in an early development stage.
The version on themainbranch is considered unstable and may change significantly.🧪 Expect breaking changes as features are added and the API evolves.
🙌 Your feedback, bug reports, and contributions are highly appreciated!
Help shape Loggify into a reliable and performant logging tool.
Loggify is a fast, zero-dependency logging library built for modern JavaScript and TypeScript runtimes – especially fun with Bun.js!
Designed for developers who want more expressive and structured logs without sacrificing performance, loggify brings a fresh logging experience using styled output, emoji-enhanced messages, and flushable contextual logs that keep related information together.
🚀 Features
- ⚡ Zero dependencies – lightweight and fast by design
- 🧵 Context-aware logging – group related logs and flush them together
- 🖨️ Uses stdout instead of console.log – for faster, cleaner output
- 🎨 Styled text output – control colors, formatting, and visibility
- 🕵️ Caller info support – trace logs back to where they were triggered
- 🕒 Customizable timestamps – add or remove as needed
- 😎 Emoji-based or text-based tags – switch as you like
- 🔌 Native Grafana Loki Support - go beyond console logging and push your logs to GrafanaLoki
- 🔧 Built to play nicely with Bun.js – but works with Node.js too!
⚙️ Installation
You can install Loggify using either bun or npm:
Using bun
bun add @pbrgld/loggifyUsing npm for node.js
npm install @pbrgld/loggify🧩 Use in Your Code
Loggify works seamlessly with both TypeScript and JavaScript projects.
TypeScript Example
import Loggify from "@pbrgld/loggify";

const loggify: Loggify = new Loggify();

loggify.console("Hello world");
Simple console log
In the most simplest way, use the console method and provide a string as message to be sent to the console. As second parameter you can define a log type e.g. "okay", "success", "warn", "error" or the identifier for an emoji:
loggify.console("Hello world", "rocket");
🧠 Note: Constructor Defaults & Auto-Configuration
If the constructor is called without any arguments, a comprehensive default initialization is applied. This ensures that Loggify is fully functional out of the box, using sensible defaults for context management, output styling, and performance-optimized logging behavior. The defaults settings are:
- Show log type as emoji
- Log timestamp as time only
- Show app's current memory consumption: Heap used, Heap total and total memory allocation in memors (rss)
- Caller information (shows file as well as line and eventually function from where this log informtaion has been triggered from)
- Followed by the message provided
Constructor Parameters
You can configure Loggify by passing an options object to the constructor. This allows you to customize the logger’s behavior to fit your project’s structure, output preferences, and runtime environment.
The available parameters are well-typed and fully documented through TypeScript definitions – so you can rely on auto-completion and inline hints in modern editors to explore all configuration options.
Simply pass the options you need – and omit the rest. Loggify applies sensible defaults for any parameters you leave out.
const loggify: Loggify = new Loggify({
  logCallerInformation: false,
  logMemoryUsage: false,
  logTimestamp: {
    enabled: true,
    mode: "dateTime",
  },
});
👆 Hint: This is an example, how to set the parameters in the constructor to remove caller information and memory usage and log the timestamp in date-time mode.
🔕 Init class in silent mode
By default, Loggify prints informative initialization details when a new instance is created. This includes:
- The logger’s internal setup status
- The name of the class
- The currently installed version of Loggify
This startup log provides transparency about the logging environment and is especially useful during development or debugging.
However, if you prefer a completely silent initialization, you can disable this behavior using the initSilent parameter:
const loggify: Loggify = new Loggify({ initSilent: true });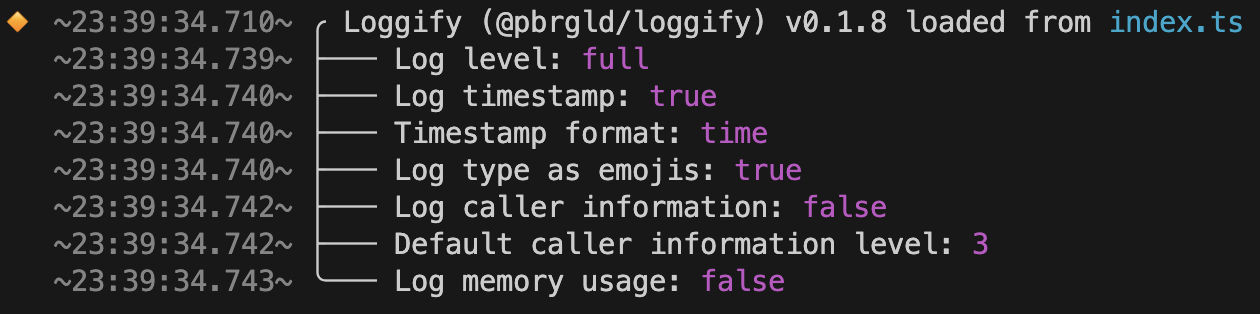
Text coloring and styling and using emojis
Loggify supports inline styling and emoji enhancements directly within your message strings, using a simple and expressive tag syntax inspired by HTML.
To apply styling or emojis, use square brackets followed by a type (ansi or emoji) and a colon-separated value.
Syntax
[ansi:<style|color>] — Apply text styles or colors
e.g., red, yellow, green, italic, underline, inverse
[emoji:] — Inject emoji symbols by keyword
e.g., check, rocket, warning, bug
[ansi:reset] — Resets the style to default (required to stop inherited formatting)
Example
loggify.console(
  "Hello [ansi:underline]world[ansi:reset]! This will be [ansi:red]red[ansi:reset] and [ansi:blue][ansi:inverse]blue[ansi:reset] text and showing an emoji [emoji:success]  ",
  "rocket"
);
This feature gives you powerful control over the visual appearance of your logs — without needing external dependencies or manual ANSI codes.
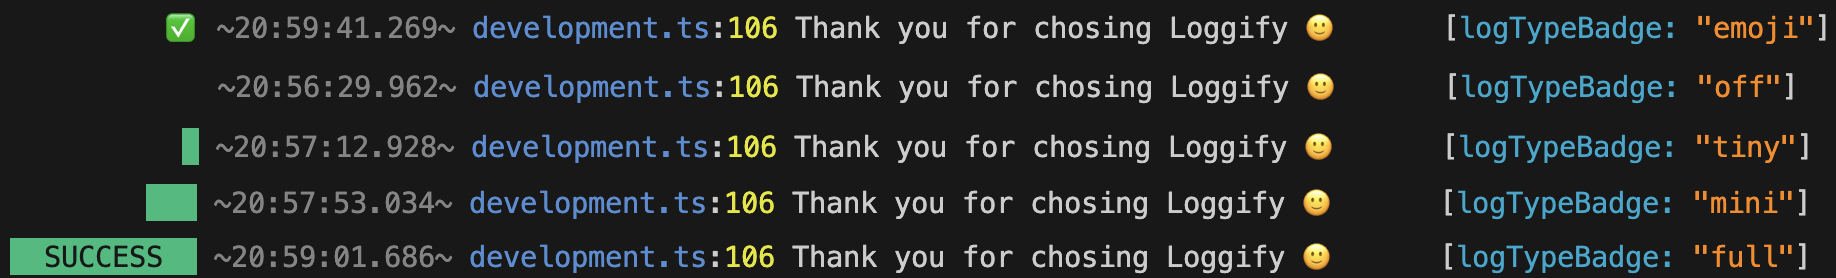
Log type badge
For best log experience, based on the system you app will be running, choose from 5 modes that allow you how to handle log type information:
- off = no information/indicator at all is printed
- tiny = first char of the log line, before timestamp is printed, shows a color indicator
- mini = same as tiny, but instead of only 1 char the first three spaces are indicating the log type
- full = is using the space of 10 characters to print color as well as log type as a text
- emoji = use the space of only the first char in most efficient way, by printing an emoji. Remark: this might not be working on all systems you are using Loggify
Custom log type badge
You want to use your own custom log type badge? No problem! Simply build the string for the log type option using the following syntax:
- start with custom
- use the ANSI color & styling mothod e.g. [ansi:orange]
- give your log type badge a name
- concatenate all three information with a =
loggify.console(
  `Use custom log badge types`,
  "custom=[ansi:orange][ansi:inverse]=myTag"
);
Object Logging Made Clear and Informative
Loggify supports clean and structured logging of complex objects right out of the box. Just pass any object to the logger, and Loggify will take care of the rest:
- ✅ Outputs in a readable and color-coded format, with type-specific highlighting
- 🧠 Automatically determines the buffer size and character length of the object
- 🧩 Supports deeply nested structures and mixed data types
- 🎯 Designed to preserve clarity, even in large or dynamic logs
This makes it easier to inspect the state of your application without losing track of key information – especially in asynchronous or data-heavy environments.
loggify.console("Hello world", "rocket", {}, object);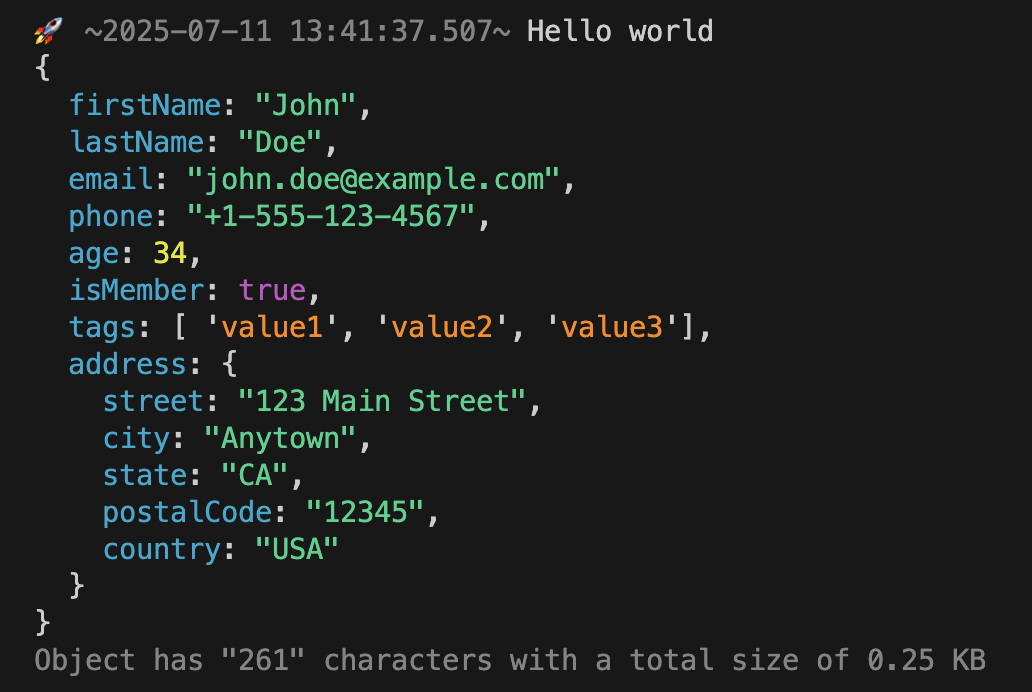
Log example for time measuring
Loggify supports built-in performance metrics logging by passing a metrics object through the logger options.
You can provide:
- A start and end timestamp (e.g. from performance.now())
- Or a direct duration in milliseconds
- (Optionally) set the log type to 'metrics' to emphasize performance-related output
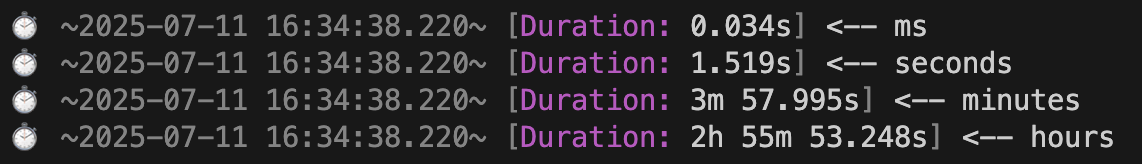
When metrics are provided, Loggify will automatically calculate and append the duration to the log message. Even better: durations are automatically converted into human-readable formats like seconds, minutes, or hours — depending on the threshold — so they’re much easier to interpret at a glance.
// Start performance timer
const performanceTimerStart: number = performance.now();
// < Your code goes here
// End performance timer
const performanceTimerEnd: number = performance.now();
loggify.console("Hello world", "metrics", {
  metrics: {
    start: performanceTimerStart,
    end: performanceTimerEnd,
  },
});
This makes it simple to track the performance of asynchronous operations and benchmark critical sections of your application — without manual formatting or external tools.
🧠 Advanced notice: You can either pass the performance counter start and end metrics via the metrics object or alternatively you can pass milliseconds to the duration parameter if you only have a result value.
🎚️ Set Log Level (Dynamically)
Loggify allows you to control the verbosity of your log output through log levels — either during initialization or at any time during runtime.
When creating a new instance of the class, you can pass a logLevel parameter into the constructor. Supported levels are:
- "off" – disables all output
- "minimal" – logs only critical or essential events
- "full" – logs everything with full detail and styling
You can also update the log level at any point later using:
loggify.setLogLevel("minimal");
Assigning log messages to a log level
As mentioned in th section set log level, there are three log levels you can assign your log messages to. This you should do to dynamically and easy reduce logging in example prodution environment.
Assigning a log message to a log level is very simple and straight forward. In the Console Options is a parameter logLevel, just provide either one of the values:
- off - message will always be logged
- minimal - message will not be logged when log level is set to off
- full - message will only be logged whenlog level is set to full
// Set log level
loggify.setLogLevel("minimal");

// Define which log level the information should be assigned to
loggify.console("Off", "circleRed", { logLevel: "off" });
loggify.console("Minimal", "circleOrange", { logLevel: "minimal" });
loggify.console("Full", "circleBlue", { logLevel: "full" });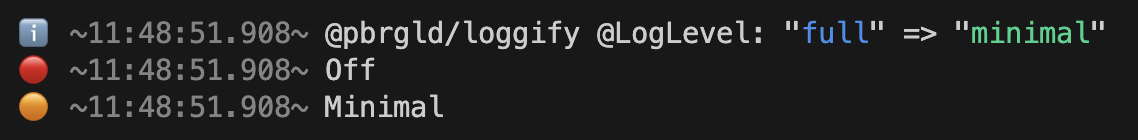
⚠️ Note: When not explicitly setting a log level within the console options, by default the log message will be assigned to full
Context logging example
Loggify supports context-based logging, a powerful mechanism that lets you group related log messages under a shared execution context — and output them all at once, in a clean, structured block.
This is especially helpful for asynchronous workflows or parallel processes, where traditional logging often becomes fragmented and hard to follow.
🔧 How It Works
- Generate a unique contextId using the built-in Loggify.generateContextId() method.
- Pass this contextId to each log call associated with the same logical process.
- Instead of immediately printing, Loggify will collect all related logs in-memory using a performant internal HashMap.
- Once the operation completes, call Loggify.flush(contextId) to output the entire log block to the console.
🚀 Key Benefits
- 🧠 Consolidated Logs: All logs related to a context are grouped and printed together — no more scattered entries across hundreds of lines.
- 🕒 Optional Duration Tracking: Loggify measures and includes the total execution time for each context block.
- ⚡ High Performance: Logging operations are non-blocking and memory-efficient.
- ♾️ Fully Concurrent: You can manage an unlimited number of parallel logging contexts without interference.
📌 Example
// Define a unique contextID
const uniqueContextId: string = loggify.generateContextId();

// Initialize the context by passing contextID and optionally title as well as performance start
loggify.console("Demo function start", "init", {
  context: {
    id: uniqueContextId,
    title: "Demo function for documentation",
    start: performance.now(),
  },
});

// Append context based logging by adding the contextID in each log statement
loggify.console("Some logging inside the demo function", undefined, {
  context: { id: uniqueContextId },
});

// Finish by either error or success, adding contextID of course as well as performance end timer if you wish
loggify.console("Demo function end", "finished", {
  context: { id: uniqueContextId, end: performance.now() },
});

// Finally use the flush method and provide the contextID to send everything to console
loggify.flush(uniqueContextId);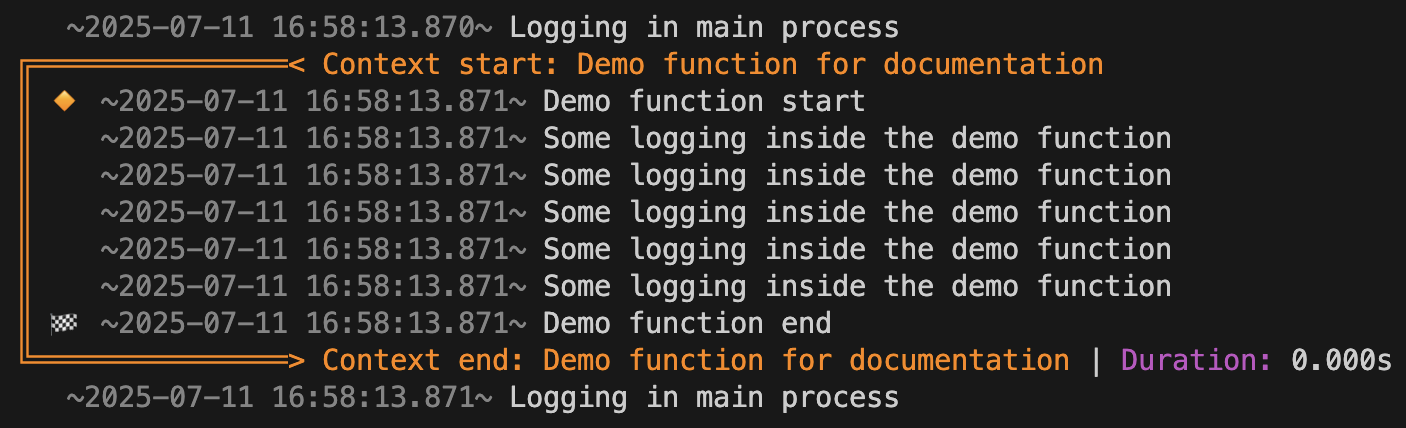
🚫 Discard context logging
When using the flush method, you can pass the option "discardContextLog" which is a boolean. Set to TRUE to not render what has been logged to the console. When is this handy to be uesed? -> When you initializes and start a function, you can start the contextual logging into memory and when your funtion exits with a logical error or inside the catch or finally block, you can use flush to log the issue to the console, while on the other hand when the function exists successfully, you may not want to render the contextual logging results, so on success, you'll flush the data from the memory and not rendering to console.
loggify.flush(contextId, { discardContextLog: true });Grafana Loki integration
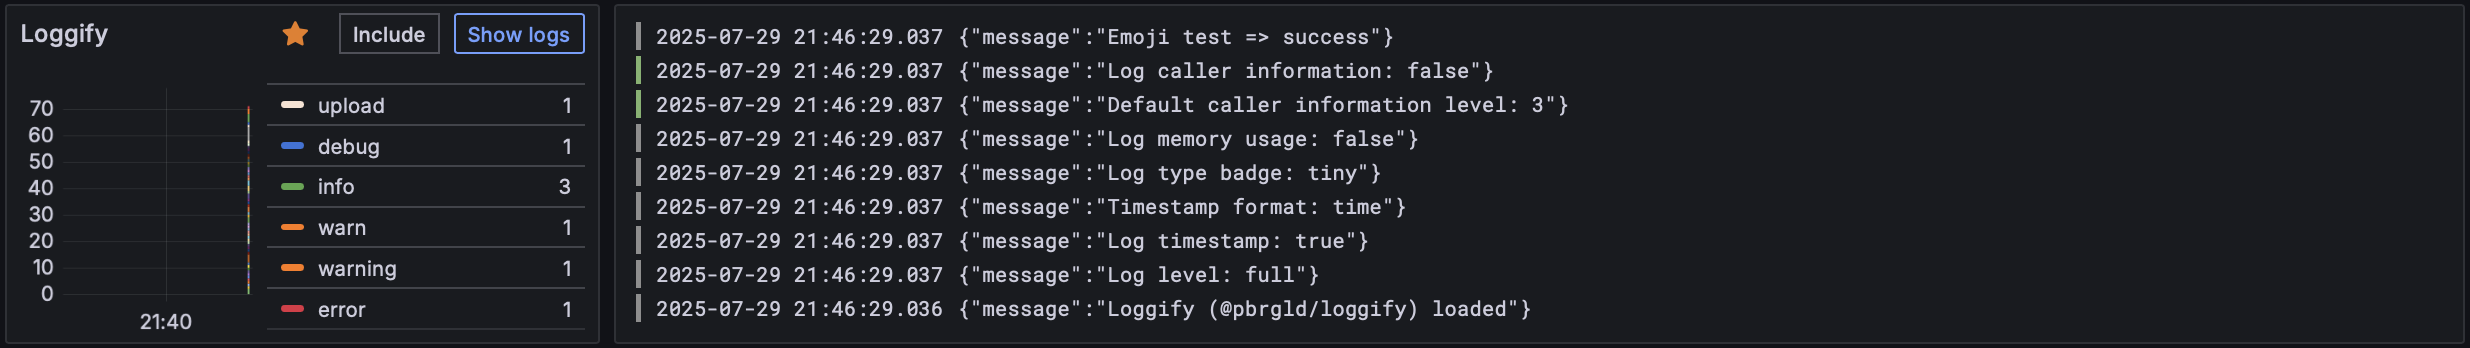
Loggify comes with an integration to Grafana Loki ↗. Both, Grafana Loki and Loggify make it up to a perfect match. While Loggify shows you nicely and colourful logging information in your terminal of your application while things happen, Grafana Loki allows you to browse through the logs in a very nice way and query over the data you've logged, using Loggify.
const loggify: Loggify = new Loggify({
  logTypeBadge: "tiny",
  logMemoryUsage: false,
  logCallerInformation: false,
  grafanaLoki: {
    hostname: "urlTo.grafanaLoki.server",
    port: 3100,
    isSecure: true,
    auth: {
      type: "basic",
      user: "username",
      pass: "securePassword",
    },
    labels: {
      app: "nameOfYouApp",
      env: "PROD",
      host: "this",
      job: "logger",
      level: "info",
    },
  },
});
In order to enable the GrafanaLoki integration, simply pass some data in the constructor of the Loggify class, such as:
- hostname (alternatively can also be IP address)
- port (default: 3100)
- isSecure (true should be used for HTTPS connections)
- auth
- type (can be none, basic or bearer)
- user (used for basic auth)
- pass (used for basic auth)
- bearerToken (when using bearer token)
- labels (optional object that allows you to define labels globally)
🧠 Note: About labels
First of all the common recommendation for GrafanaLoki is not to use more than 5 labels in total, if possible. Second, the labels you define globally for GrafanaLoki within the constructor, you can overwrite any time on console level.
⚠️ Important: Do not push to GrafanaLoki
There is some information that you wish not to push to GrafanaLoki and it should only be part of the local logging in the terminal? No problem, simply add
grafanaLoki: { doNotPush: true }to theLogConsoleOptions.
Just to make the information sort of complete, to grafanaLoki object on console method within LogConsoleOptions, you can of course overwrite the level by using levelOverwrite and add additional labels on the detailed level or overwrite globally defined labels by using the labels object.
Caller information handling
When working with bigger projects or guest working in bogger projects that you are not familar with, especially when there is a lot of asynchronus code, the caller information becomes quite handy, because it shows you from which file and line in code the output has been initiated from - also the function name helps to clearly identify its origin.
Overwrite caller stack level
Depending on your setup, it may be required that you on log detail level overwrite the parent or default caller stack level. For instance you initiate the loggify instance in a top code file and export the instance to use it in child files, you may want to use anoter call stack level to extract the informatation from where the loggify.console() method has been invoked. With the overwriteCallerStackLevel you can influence the information individually for each individual call of loggify.console().
loggify.console(`This is a log from inside the function`, "create", {
  callerInformation: { overwriteCallerStackLevel: 0 },
});
🧠 Note: Hide function
Don't want to print the function? - When ever within the callstack a function is identified, by default the information is printed on in the log as part of the caller information. If for what reason ever you do not want to print this information, use
hideFunctionInfo: trueto hide it.
🧭 Project Philosophy & Community Focus
This is the first package I’m sharing with the community – and it’s something I deeply care about. With Loggify, my goal is to create a logging tool that helps developers stay focused, informed, and productive – especially when working on complex projects with asynchronous processes and nested dependencies.
Logging is not just a technical feature – it’s a developer’s compass in growing codebases. When things get messy, good logs can mean the difference between clarity and chaos.
That’s why Loggify focuses on:
- ✅ Simplicity – clear API, no unnecessary complexity
- 🚀 Performance – using stdout, no dependencies
- 💡 Developer Experience – styled, structured, and readable logs
- 🔁 General-purpose use cases – helpful in any project context
- 🤝 Community-driven development – your input matters!
If Loggify helps you solve a problem, I’d love to hear about it – and I’m happy to support others in turning their ideas into reality. Let’s build something useful together.
🗺️ Roadmap – What’s Next for Loggify
Loggify is just getting started, and there are exciting features on the horizon!
The following improvements are planned to make Loggify even more powerful and flexible for all kinds of environments and use cases.
✅ Planned Features
🌐 Browser Support
Currently, Loggify is optimized for Node.js and Bun.js environments.
Future versions will bring compatibility with modern browsers and frontend workflows.🎨 Custom Style Templates (Tag-Based)
Instead of manually setting styles likecolororbold, you’ll be able to use semantic tags like[style:file],[style:warning], etc.
These tags will map to custom-defined style presets – making your logging both cleaner and more expressive.📊 Native Grafana Loki Support (Zero-Dependency)
Future versions of Loggify will support native integration with Grafana Loki for log aggregation and monitoring – without introducing any external dependencies.
This feature will use Loki’s REST-based /loki/api/v1/push endpoint directly, enabling developers to stream structured logs to a local or remote Loki instance using native HTTP calls (fetch, https.request, etc.).
This will allow seamless integration with your Loki + Promtail and in future Alloy + Grafana stack while keeping your project lean and dependency-free.
🛰️ Native AWS CloudWatch Integration (planned) Support for a native integration with AWS CloudWatch is on the roadmap. The goal is to enable zero-dependency log forwarding by directly interacting with the AWS CloudWatch Logs API. This feature will allow users to stream logs to the cloud without relying on external packages, offering high performance and full control while staying aligned with Loggify’s lightweight architecture.
🏷️ Banner Logging
Loggify will introduce a new banner feature to highlight important log entries in a visually distinct and prominent block within the console output. These banners can be used to signal critical events, section headers, or state transitions — especially powerful in the context of Context Logging, where grouped logs can be framed by eye-catching visual elements.
The banner output will be highly customizable, allowing you to define:
- A title message
- Optional subtext
- Color styling (ANSI)
- Symbolic decorations (like 📣🚨🛠️)
Why it matters:
- Helps developers instantly spot important events within large log streams
- Makes Context Logging blocks more structured and readable
- Improves debugging by clearly separating execution phases or issue boundaries
- Great for start/end markers, alerts, or build steps in CI/CD
📄 Changelog
You can find all notable changes in the Changelog.
💬 Join the Community
Have questions about Loggify, want to report an issue, or just exchange ideas with other developers?
Join our official Discord server to connect, discuss features, and stay up to date with the latest developments.

📝 License
This project is licensed under the MIT License – see the LICENSE file for details.
© 2025 Paul Bergold