
@prodisco/k8s-mcp
v0.1.9
Published
ProDisco: Kubernetes MCP server with progressive disclosure
Maintainers
 prodisco
Readme
ProDisco (Progressive Disclosure Kubernetes MCP Server)
ProDisco gives AI agents Kubernetes access + Prometheus metrics analysis through two unified tools. It follows Anthropic's Progressive Disclosure pattern: the MCP server exposes search tools which surface API methods, agents discover them to write code, execute it in a sandbox, and only the final console output returns to the agent.
Two tools:
- kubernetes.searchTools - Discover API methods, type definitions, cached scripts, and Prometheus methods
- kubernetes.runSandbox - Execute TypeScript code in a sandboxed VM environment
Why Progressive Disclosure Matters
Anthropic's latest guidance explains why MCP servers should progressively reveal capabilities instead of dumping every tool definition into the model context. When agents explore a filesystem of TypeScript modules, they only load what they need and process data inside the execution environment, then return a concise result to the chat. This keeps token usage low, improves latency, and avoids copying large intermediate payloads through the model (source).
ProDisco goes a step further: instead of exposing custom TypeScript modules, it provides a structured parameter search tool that dynamically extracts methods from upstream libraries using TypeScript AST parsing. This means:
- Zero maintenance - Methods are extracted directly from library
.d.tsfiles - Always current - Upgrading a dependency automatically exposes new methods
- Type-safe - Full parameter types and return types included
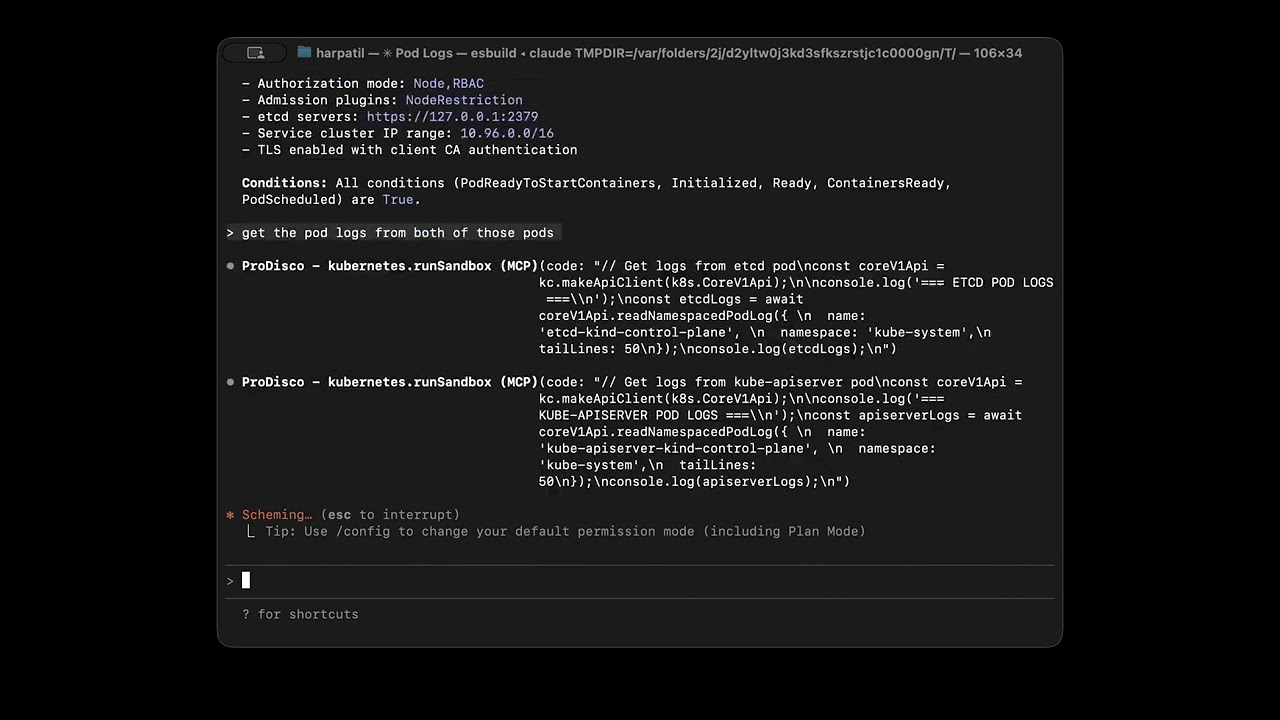
Demo
Quick Start
Add to Claude Code
Add ProDisco to Claude Code:
# Set environment variables first (--env flag may not work reliably)
export KUBECONFIG="${HOME}/.kube/config"

# Then add the MCP server
claude mcp add ProDisco -- npx -y @prodisco/k8s-mcp
With Prometheus (optional):
export KUBECONFIG="${HOME}/.kube/config"
export PROMETHEUS_URL="http://localhost:9090"
claude mcp add ProDisco -- npx -y @prodisco/k8s-mcp
Remove if needed:
claude mcp remove ProDiscoEnvironment variables:
| Variable | Required | Description |
|----------|----------|-------------|
| KUBECONFIG | No | Path to kubeconfig (defaults to ~/.kube/config) |
| K8S_CONTEXT | No | Kubernetes context (defaults to current context) |
| PROMETHEUS_URL | No | Prometheus server URL for metrics queries |
Important: Export environment variables before running
claude mcp add. The--envflag may not reliably pass variables to the MCP server process.
Tip: If you're using a kind cluster for local testing, you can port-forward to Prometheus:
kubectl port-forward -n monitoring svc/prometheus-server 9090:80Then set
PROMETHEUS_URL="http://localhost:9090"
Container Isolation (Advanced)
For stronger isolation, you can run the sandbox server in a Kubernetes cluster and connect to it via TCP instead of using the local subprocess.
1. Deploy the sandbox server to your cluster:
# Build and load the image (for kind clusters)
docker build -f packages/sandbox-server/Dockerfile -t prodisco/sandbox-server:latest .
kind load docker-image prodisco/sandbox-server:latest

# Deploy
kubectl apply -f packages/sandbox-server/k8s/deployment.yaml

# Port-forward to access locally
kubectl -n prodisco port-forward service/sandbox-server 50051:50051
2. Configure the MCP server to use TCP transport:
export KUBECONFIG="${HOME}/.kube/config"
export SANDBOX_USE_TCP=true
export SANDBOX_TCP_HOST=localhost
export SANDBOX_TCP_PORT=50051
claude mcp add ProDisco -- npx -y @prodisco/k8s-mcp
Sandbox transport environment variables:
| Variable | Default | Description |
|----------|---------|-------------|
| SANDBOX_USE_TCP | false | Use TCP instead of local subprocess |
| SANDBOX_TCP_HOST | localhost | Sandbox server host |
| SANDBOX_TCP_PORT | 50051 | Sandbox server port |
See docs/grpc-sandbox-architecture.md for full architecture details.
Development Setup
For local development:
git clone https://github.com/harche/ProDisco.git
cd ProDisco
npm install
npm run build
claude mcp add --transport stdio prodisco -- node dist/server.js
claude mcp remove prodisco # remove when you're done
Startup Options
| Flag | Description |
|------|-------------|
| --clear-cache | Clear the scripts cache before starting |
Example:
node dist/server.js --clear-cacheAvailable Tools
ProDisco exposes two tools:
kubernetes.runSandbox
Execute TypeScript code in a sandboxed environment for Kubernetes and Prometheus operations. Supports multiple execution modes for different use cases.
Execution Modes:
| Mode | Purpose | Key Parameters |
|------|---------|----------------|
| execute (default) | Blocking execution, waits for completion | code or cached, timeout |
| stream | Real-time output streaming | code or cached, timeout |
| async | Start execution, return immediately | code or cached, timeout |
| status | Get status/output of async execution | executionId, wait, outputOffset |
| cancel | Cancel a running execution | executionId |
| list | List active and recent executions | states, limit, includeCompletedWithinMs |
Input:
{
  // Mode selection (default: 'execute')
  mode?: 'execute' | 'stream' | 'async' | 'status' | 'cancel' | 'list';

  // Execute/Stream/Async mode parameters
  code?: string;     // TypeScript code to execute directly
  cached?: string;   // Name of a cached script to run (from searchTools results)
  timeout?: number;  // Execution timeout in ms (default: 30000, max: 120000)

  // Status/Cancel mode parameters
  executionId?: string;   // ID from async mode response
  wait?: boolean;         // Long-poll until completion (status mode)
  outputOffset?: number;  // Offset for incremental reads (status mode)

  // List mode parameters
  states?: ('pending' | 'running' | 'completed' | 'failed' | 'cancelled' | 'timeout')[];
  limit?: number;                  // Max results (default: 10)
  includeCompletedWithinMs?: number;  // Include recent completions
}
Sandbox Environment:
k8s- Full@kubernetes/client-nodelibrarykc- Pre-configured KubeConfig instanceconsole- Captured output (log, error, warn, info)require()- Whitelisted modules:@kubernetes/client-node,prometheus-queryprocess.env- Environment variables (PROMETHEUS_URL, etc.)
Examples:
// Execute mode (default) - blocking execution
{
  code: `
    const api = kc.makeApiClient(k8s.CoreV1Api);
    const pods = await api.listNamespacedPod({ namespace: 'default' });
    console.log(\`Found \${pods.items.length} pods\`);
  `
}

// Run a cached script
{ cached: "script-2025-01-01T12-00-00-abc123.ts" }

// Stream mode - real-time output
{ mode: "stream", code: "for(let i=0; i<5; i++) console.log(i)" }

// Async mode - start long-running task
{ mode: "async", code: "longRunningTask()" }
// Returns: { executionId: "abc-123", state: "running", ... }

// Status mode - check async execution progress
{ mode: "status", executionId: "abc-123", wait: true }

// Cancel mode - stop a running execution
{ mode: "cancel", executionId: "abc-123" }

// List mode - show running executions
{ mode: "list", states: ["running"], limit: 5 }
kubernetes.searchTools
A unified search interface with four modes:
| Mode | Purpose | Example |
|------|---------|---------|
| methods | Find Kubernetes API methods | { resourceType: "Pod", action: "list" } |
| types | Get TypeScript type definitions | { mode: "types", types: ["V1Pod.spec"] } |
| scripts | Search cached scripts | { mode: "scripts", searchTerm: "logs" } |
| prometheus | Find Prometheus API methods | { mode: "prometheus", category: "query" } |
For comprehensive documentation including architecture details and example workflows, see docs/search-tools.md.
Input:
{
  // Mode selection
  mode?: 'methods' | 'types' | 'scripts' | 'prometheus';  // default: 'methods'

  // Methods mode - Kubernetes API discovery
  resourceType?: string;  // e.g., "Pod", "Deployment", "Service"
  action?: string;        // e.g., "list", "read", "create", "delete", "patch"
  scope?: 'namespaced' | 'cluster' | 'all';
  exclude?: { actions?: string[]; apiClasses?: string[] };

  // Types mode - TypeScript definitions
  types?: string[];       // e.g., ["V1Pod", "V1Deployment.spec"]
  depth?: number;         // Nested type depth (1-2)

  // Scripts mode - Cached script discovery
  searchTerm?: string;    // Search term (omit to list all)

  // Prometheus mode - Prometheus API discovery and metrics
  category?: 'query' | 'metadata' | 'alerts' | 'metrics' | 'all';
  methodPattern?: string; // e.g., "query", "labels", "pod", "gpu"

  // Shared parameters
  limit?: number;         // Max results (default: 10)
  offset?: number;        // Pagination offset
}
Methods Mode Examples:
// List all Pod-related methods
{ resourceType: "Pod" }

// List namespaced Pods
{ resourceType: "Pod", action: "list", scope: "namespaced" }

// Create Deployment
{ resourceType: "Deployment", action: "create" }

// Pod methods excluding delete actions
{ resourceType: "Pod", exclude: { actions: ["delete"] } }

// Pod methods excluding CoreV1Api (shows only PolicyV1Api, AutoscalingV1Api, etc.)
{ resourceType: "Pod", exclude: { apiClasses: ["CoreV1Api"] } }
Types Mode Examples:
// Get V1Pod type definition
{ mode: "types", types: ["V1Pod"] }

// Get multiple types
{ mode: "types", types: ["V1Pod", "V1Deployment", "V1Service"] }

// Navigate to nested types using dot notation
{ mode: "types", types: ["V1Deployment.spec"] }  // Returns V1DeploymentSpec
{ mode: "types", types: ["V1Pod.spec.containers"] }  // Returns V1Container (array element)
{ mode: "types", types: ["V1Pod.status.conditions"] }  // Returns V1PodCondition

// Include nested types at depth 2
{ mode: "types", types: ["V1Pod"], depth: 2 }
Scripts Mode Examples:
// List all cached scripts
{ mode: "scripts" }

// Search for pod-related scripts
{ mode: "scripts", searchTerm: "pod" }
Prometheus Mode Examples:
// List all available methods
{ mode: "prometheus" }

// Find PromQL query methods
{ mode: "prometheus", category: "query" }

// Find metadata methods (labels, series, targets)
{ mode: "prometheus", category: "metadata" }

// Search for specific methods
{ mode: "prometheus", methodPattern: "query" }

// Discover actual metrics from your cluster
{ mode: "prometheus", category: "metrics", methodPattern: "pod" }

// Find GPU metrics
{ mode: "prometheus", category: "metrics", methodPattern: "gpu" }
Available Categories (Prometheus Mode):
| Category | Methods | Use Case |
|----------|---------|----------|
| query | instantQuery, rangeQuery | Execute PromQL queries |
| metadata | series, labelNames, labelValues, targets | Explore metrics metadata |
| alerts | rules, alerts, alertmanagers | Access alerting information |
| metrics | (dynamic from cluster) | Discover actual metrics with descriptions |
Integration Tests
End-to-end testing instructions (KIND cluster + Claude Agent SDK driver) now live in docs/integration-testing.md. The workflow is manual-only for now and assumes your Anthropic credentials are already configured. Run it locally with:
npm run test:integrationLicense
MIT