
@profullstack/hqtui-demo
v0.6.3
Published
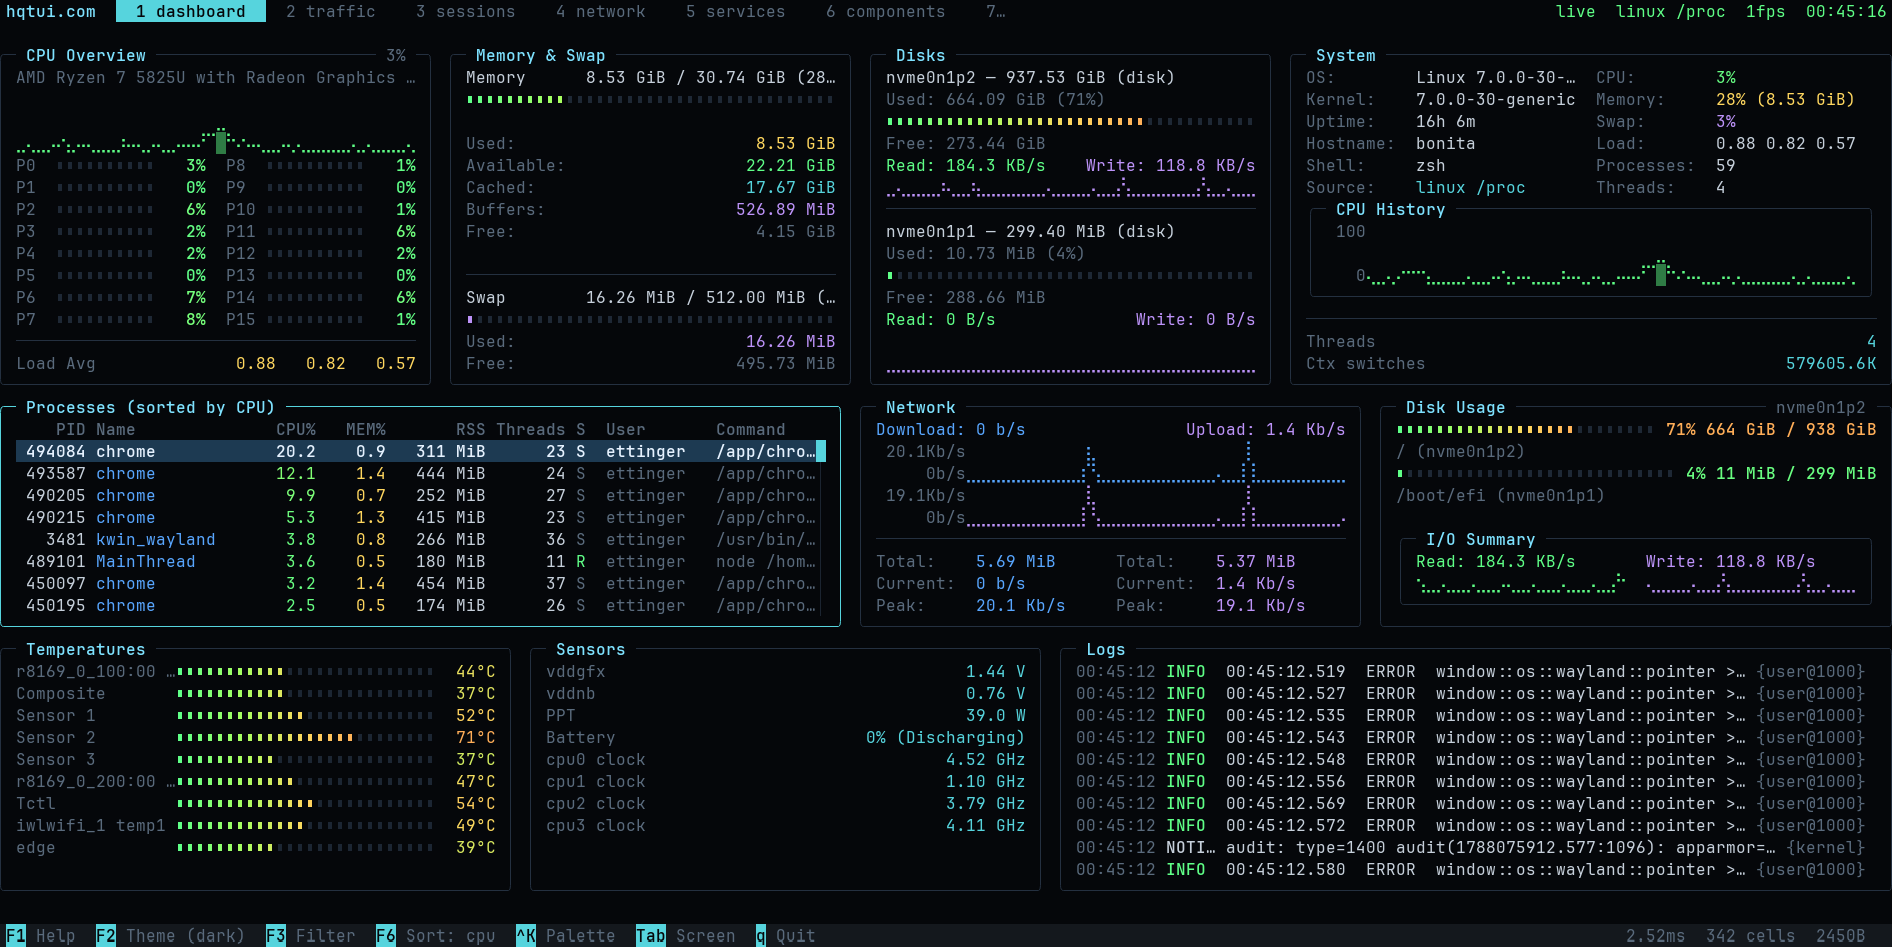
The HQTUI reference dashboard: a btop-grade terminal system monitor. Runs on real system metrics or a deterministic simulation.


Readme
@profullstack/hqtui-demo
The HQTUI reference dashboard: a btop-grade terminal system monitor built entirely
in TypeScript with @profullstack/hqtui.
It runs on real system metrics on Linux, macOS and Windows — with no native dependencies — or on a deterministic simulation so screenshots and benchmarks are reproducible.
Run it
To automatically fetch latest main, build it and run it on every invocation:
# Vanilla — uses your installed toolchain (Bun for TypeScript)
curl -fsSL https://hqtui.com/demo.sh | sh -s -- --system typescript
curl -fsSL https://hqtui.com/demo.sh | sh -s -- --system rust

# Mise — installs/uses the selected pinned toolchain
curl -fsSL https://hqtui.com/demo.sh | sh -s -- --mise typescript
curl -fsSL https://hqtui.com/demo.sh | sh -s -- --mise rust
Replace the language with go, python or zig for the other native demos.
Append --sim directly; native headless previews use --snapshot. Git and curl
are required. Review the launcher before executing it.
The launcher prints the exact commit, fetches before every run, caches sources
and optimized builds under $XDG_CACHE_HOME/hqtui-demo (default
~/.cache/hqtui-demo), and never modifies your own checkout. A failed update
does not silently run an old copy. Set HQTUI_DEMO_CACHE to a dedicated absolute
directory to choose another cache. Old revisions are retained so running demos
are not disrupted. --check before the language prints the fetched commit without
building or entering a terminal. First builds are slower; unchanged revisions
reuse completed builds. C/C++ demos are not available yet.
For the latest published npm release instead of latest source:
bunx @profullstack/hqtui-demo@latest          # your real machine
bunx @profullstack/hqtui-demo@latest --sim    # deterministic simulation

npx --yes @profullstack/hqtui-demo@latest     # Node 22.6+ works too
Options
--sim              Use the deterministic simulation instead of real metrics
--real             Read real system metrics (default)
--seed <n>         Simulation seed (default 1337)
--fps <n>          Frame cap (default 30, 15 over SSH)
--theme <name>     dark, dracula, nord, tokyoNight, gruvbox, matrix,
                   monochrome, highContrast, light
--screen <name>    dashboard, components, graphics, themes, input, stress, world
--interval <ms>    Metric refresh interval (default 1000)
-h, --help         Show help
-v, --version      Show the version
Keys
| Key | Action |
|---|---|
| 1–0, w | Switch screens |
| Tab, Shift+Tab | Focus controls; Enter / Space copies a focused summary |
| F1 | Help |
| F2 | Cycle theme |
| F3 | Filter processes |
| F6 | Change sort |
| Ctrl+K | Command palette |
| Space | Pause updates |
| ↑ ↓ PgUp PgDn Home End | Move selection |
| Enter | Terminate the selected dashboard process |
| q, Ctrl+C | Quit |
Mouse works too: click the tabs and buttons, scroll the process list.
Click ⧉ MD in a summary pane to copy its facts as Markdown, with the host, screen, metric source and update state. Process and journal rows are excluded. The terminal must support OSC 52 clipboard writes (also usable over SSH).
The termination dialog sends SIGTERM by default, allowing the process to
clean up. Force kill (-9 / SIGKILL) starts unchecked each time. Use Tab,
Shift+Tab or the arrow keys to move between Yes, No and the checkbox; Space
toggles the checkbox and Enter activates the focused control. y confirms;
n, Escape or a click outside the dialog cancels. The selected PID stays fixed
while metrics refresh. Signal errors appear in the dialog, and simulation mode
never signals a real process.
Screens
dashboard
CPU with per-core meters, memory and swap, disks with throughput history, network graphs, the process table, temperatures, sensors and a tailing journal.
traffic
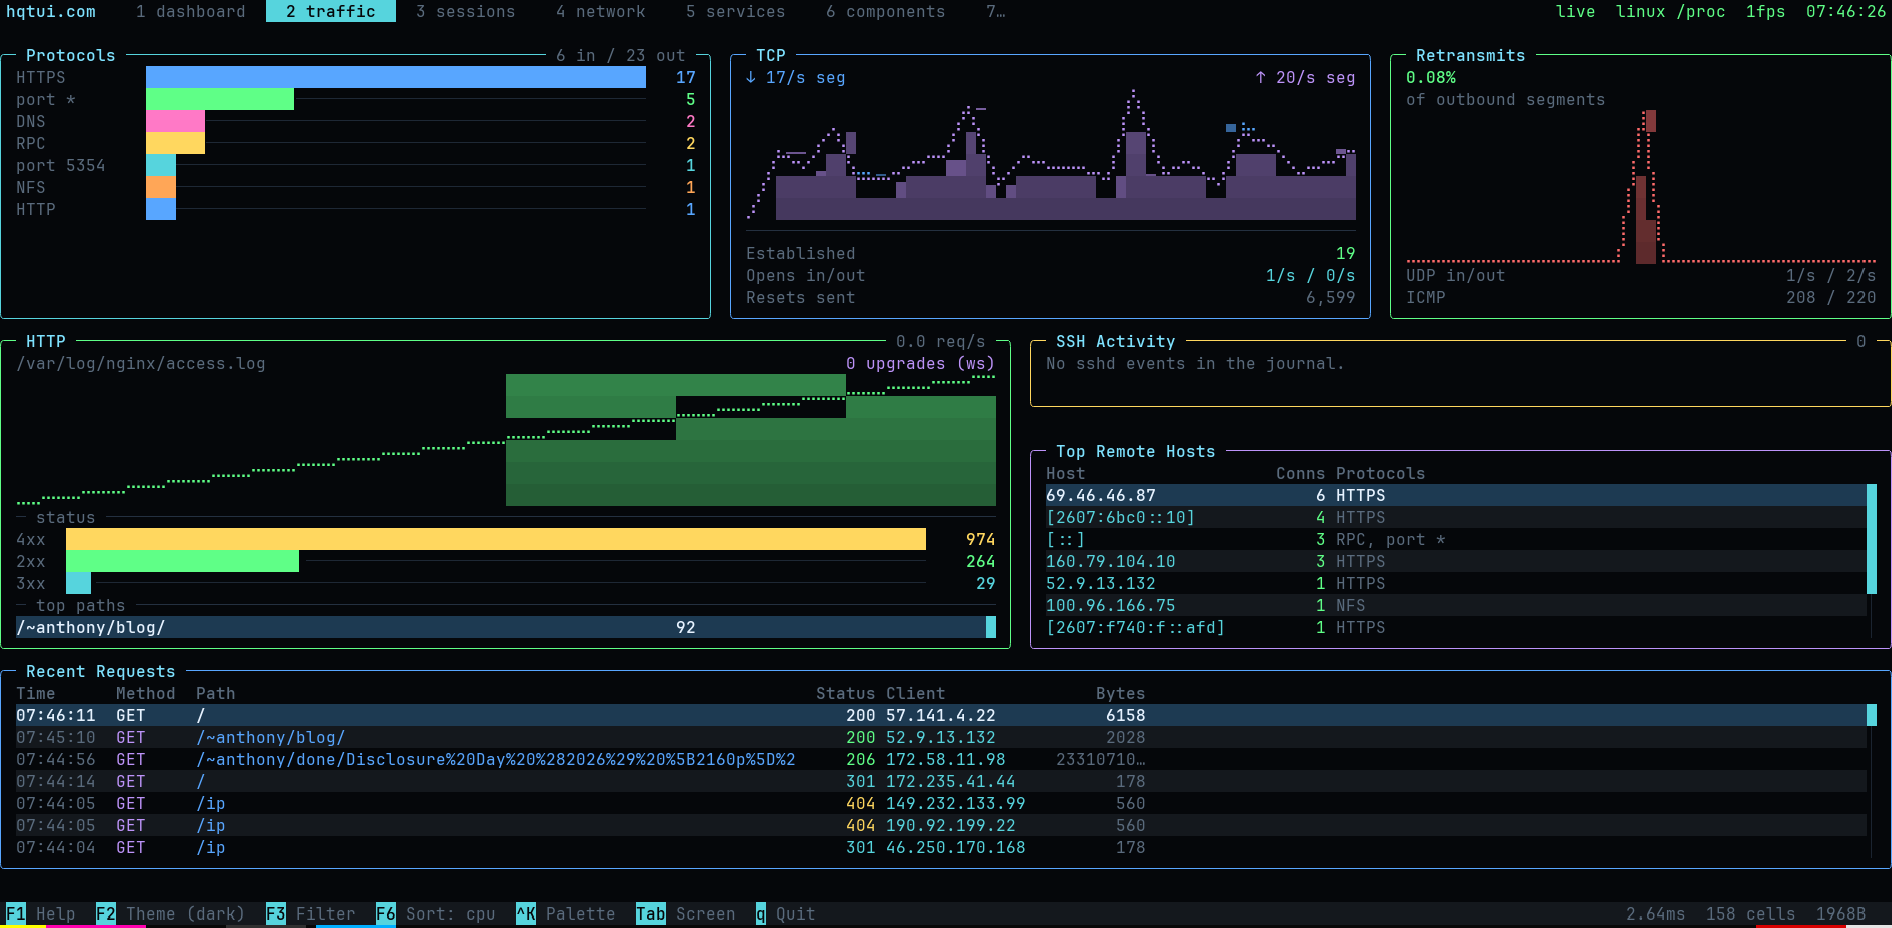
Every protocol in and out of the host. Live sockets grouped by service, TCP/UDP/ICMP counters with retransmit rate, HTTP request tracking parsed from access logs (req/s, status mix, top paths, top clients, WebSocket upgrades), and sshd authentication events.
network
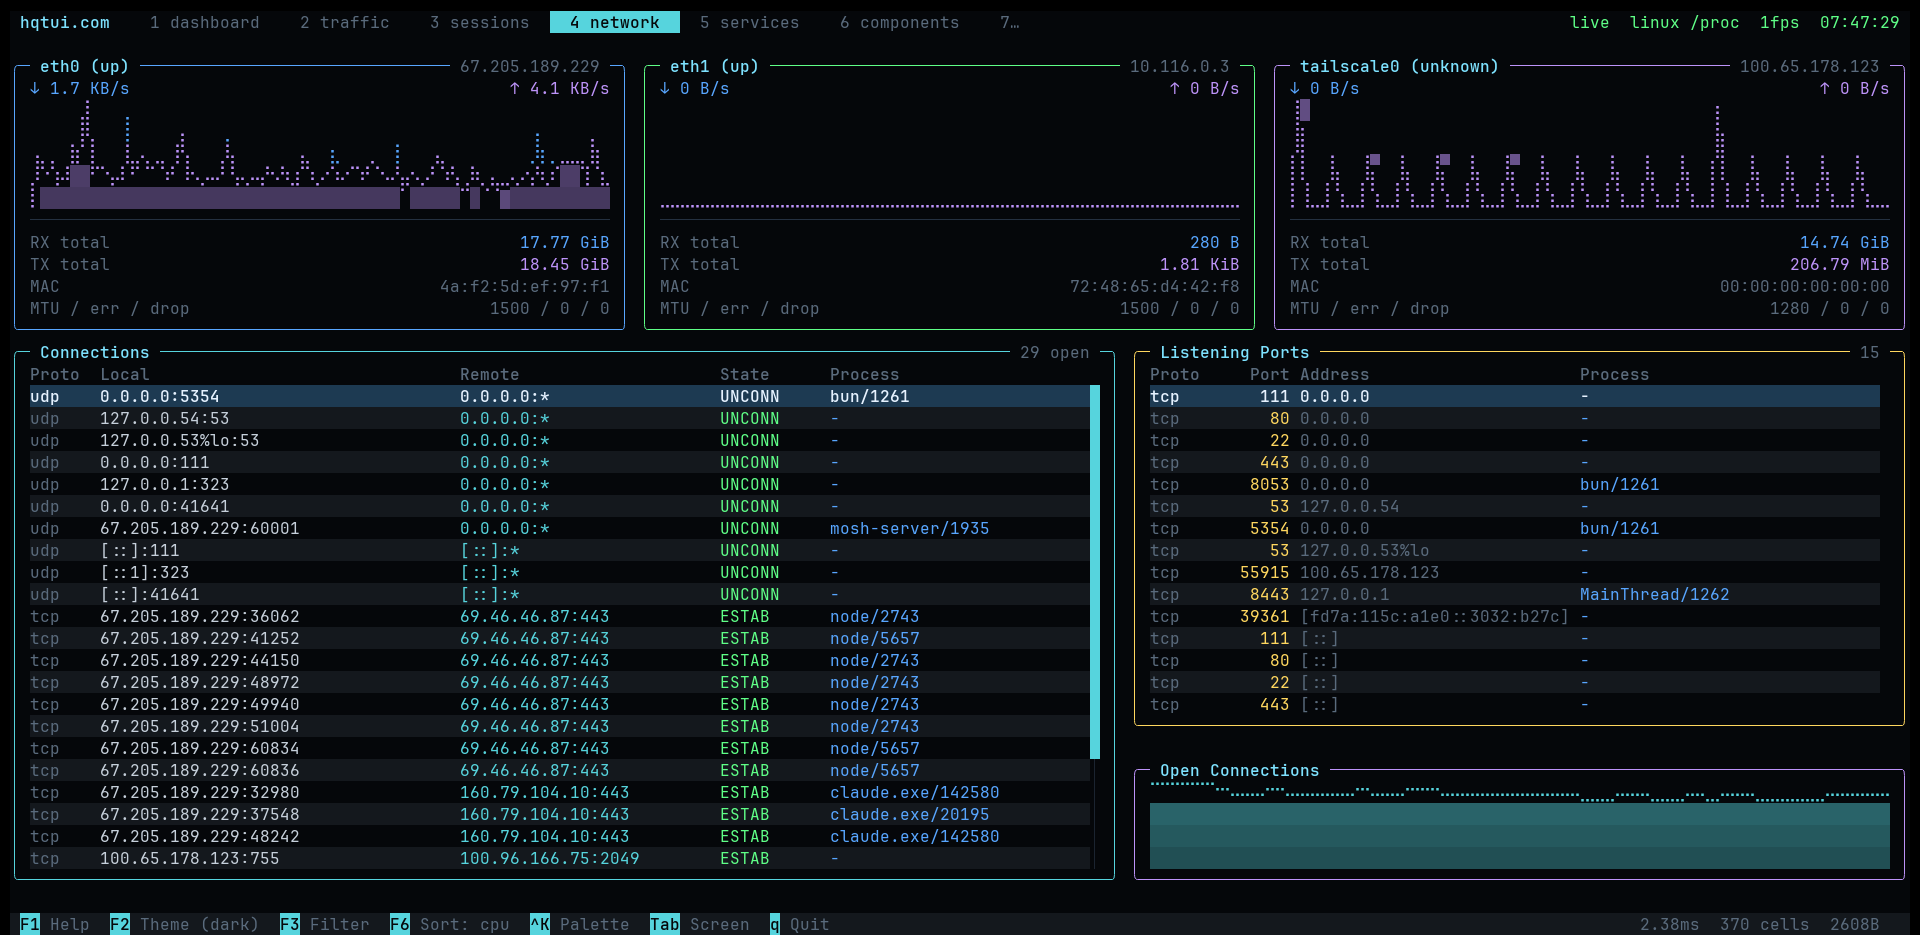
Per-interface throughput graphs with totals, MTU, errors and drops; open connections with the owning process; and every listening port.
sessions
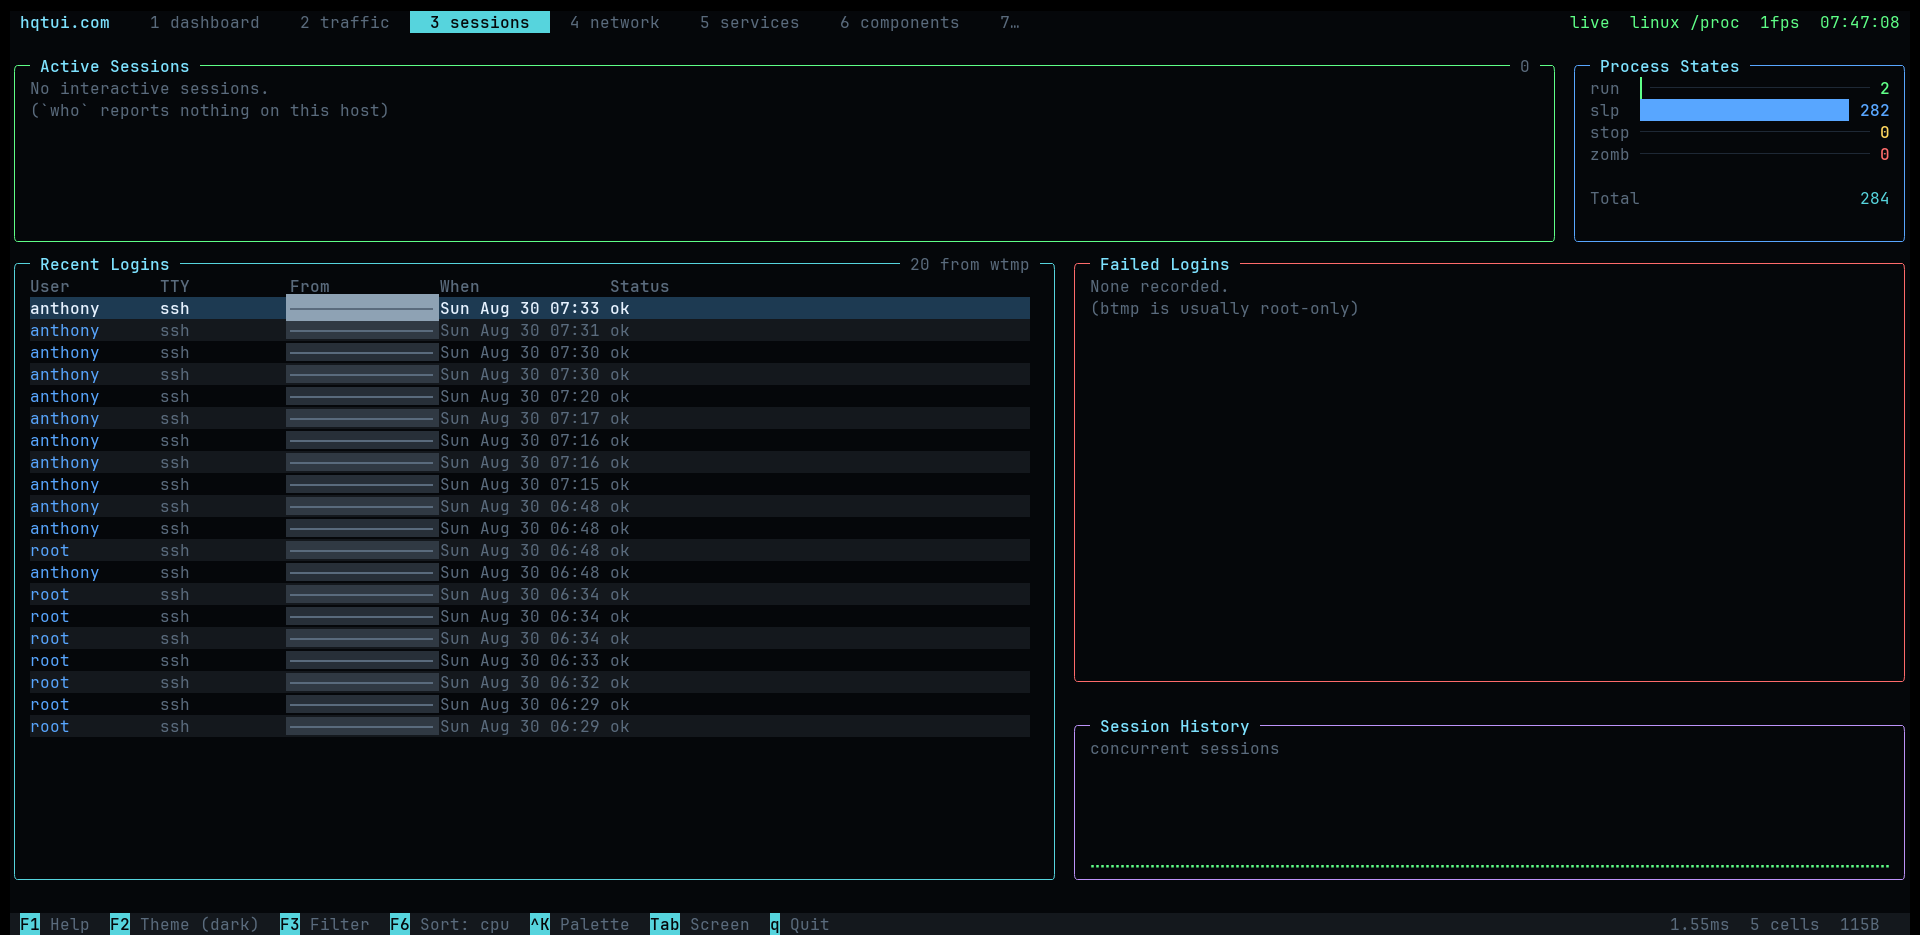
Who is logged in (who), login history (wtmp), failed attempts (btmp), and process
states.
services
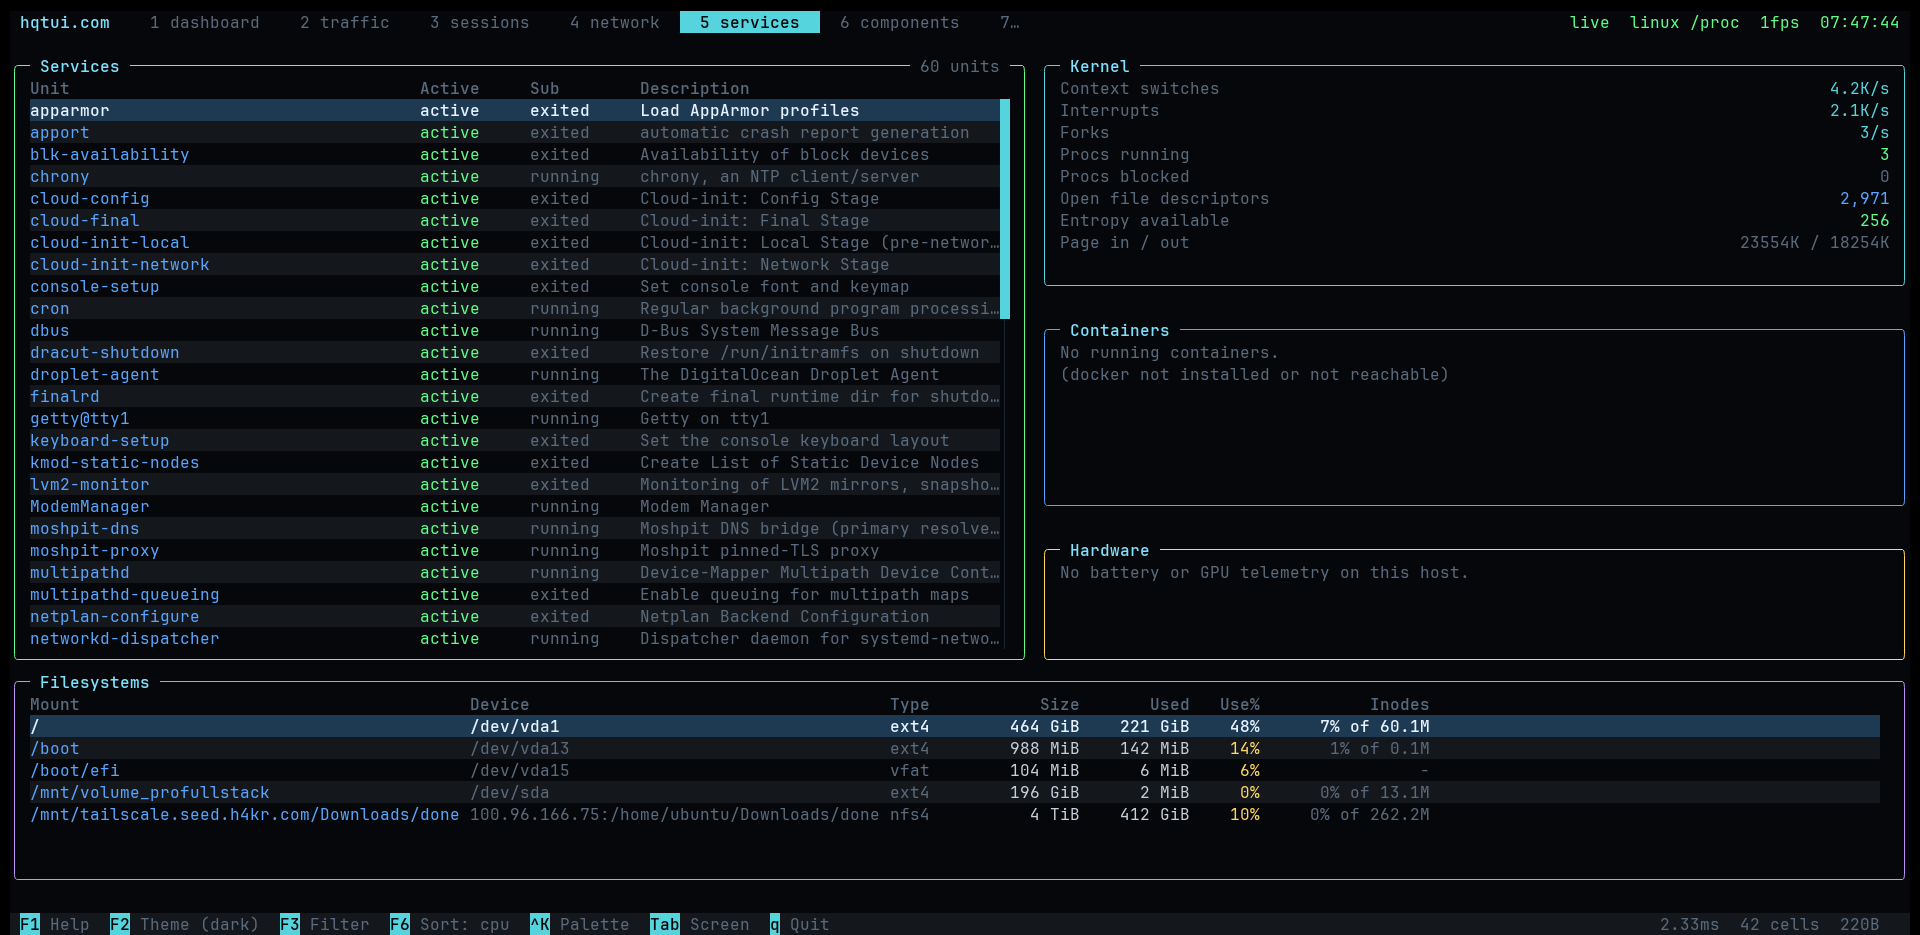
systemd units with failures first, docker containers, kernel counters and filesystems with inode usage.
components
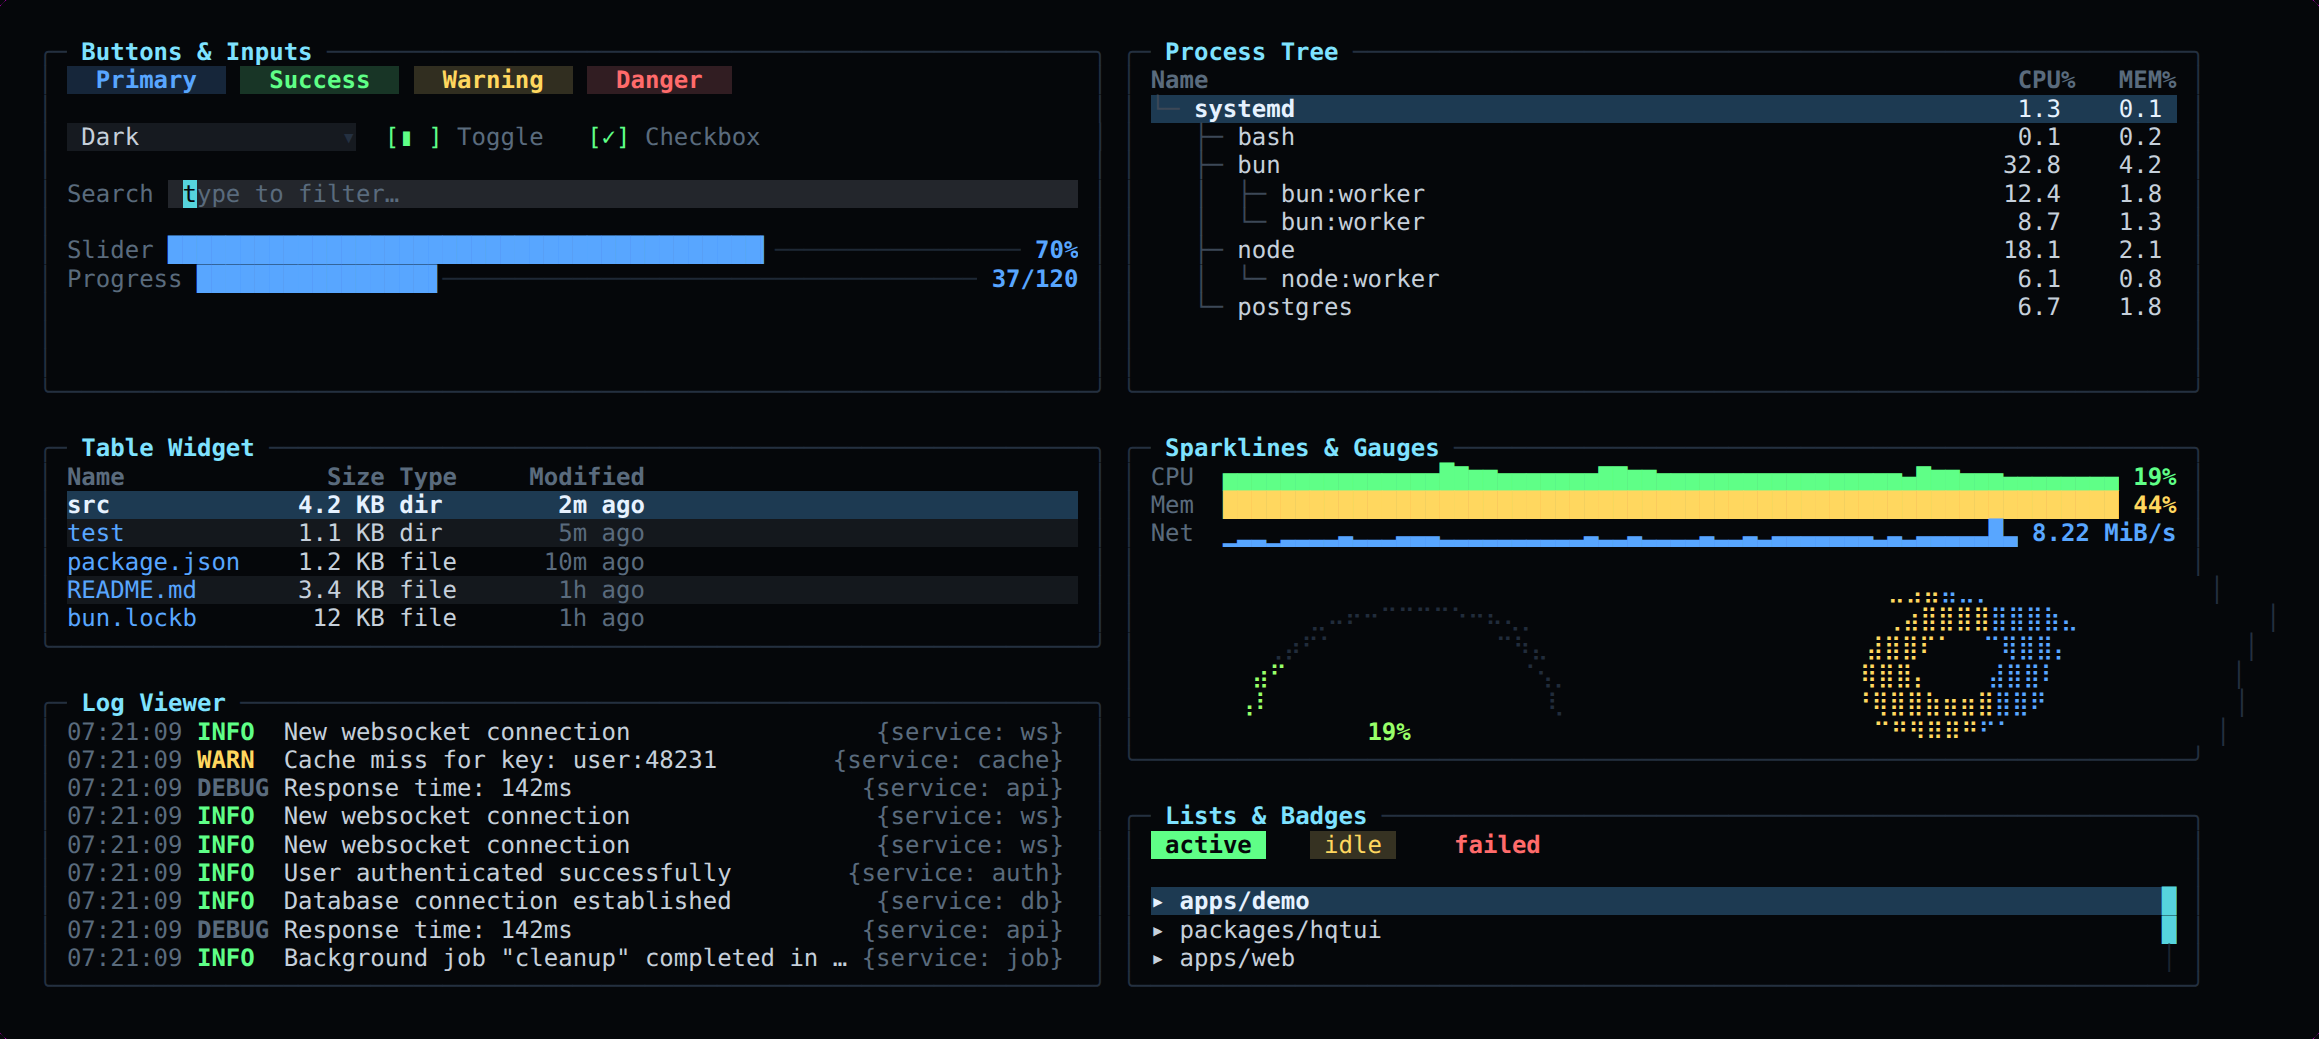
Every widget in the library, interactive.
world
A clickable world map. Hover to see what is under the cursor, click to select a
country, z to zoom to the selection and r to go back to the whole globe. The
country list and the map are two views of one selection, so the arrows move the
highlight too.
graphics, themes, input, stress
Braille vs block vs ASCII rendering, all nine themes side by side, a keyboard and mouse event visualizer, and a full-screen churn test with live render statistics.
Where the metrics come from
| Platform | Source | Notes |
|---|---|---|
| Linux | /proc, /sys, ps, df, ss, who, last, systemctl, journalctl | Everything: per-core CPU, temperatures (hwmon and thermal zones), sockets by protocol, sessions, services, kernel counters, journal |
| macOS | sysctl, vm_stat, top, netstat, iostat, ps | Temperatures and fan speed need privileges, so they are reported as unavailable |
| Windows | PowerShell CIM (Win32_*), Get-Process | Temperatures are not exposed by CIM |
Anything a platform cannot provide is reported as unavailable rather than
fabricated — press F1 to see the list for your machine. Run with --sim to see every
widget populated.
Temperatures and hardware sensors
Temperatures come from /sys/class/hwmon, then /sys/class/thermal, then
lm-sensors. Fan speeds, voltage rails, power draw, current, battery and GPU are
read independently of temperature, so a machine with no thermal probes can
still report fans, and the reverse.
On a virtual machine there is nothing to read. A KVM, Xen or Hyper-V guest is
not shown the host's thermal hardware, so no package will make CPU temperature
appear inside a Droplet or an EC2 instance — sensors-detect there prints
"Sorry, no sensors were detected." The demo says which case you are in rather
than leaving the panel blank.
On bare metal, if the panels are empty:
sudo apt install lm-sensors
sudo sensors-detect --auto     # loads coretemp, k10temp, nct6775, ...
Drive temperatures additionally need smartmontools, and reading SMART needs
root.
Running as root
sudo bunx ... fails with sudo: 'bunx': command not found on most setups.
That is not a problem with this package: sudo replaces PATH with the
secure_path from /etc/sudoers, and bun usually lives under your home
directory (mise, ~/.bun/bin), which is not on that list. Keep your PATH:
sudo -E env "PATH=$PATH" bunx @profullstack/hqtui-demoor point at the binary directly:
sudo "$(command -v bunx)" @profullstack/hqtui-demoWhat sudo adds
Everything above works unprivileged. Running as root additionally exposes:
- process names on sockets — unprivileged, listeners show
-; as root the same rows readnginx/1337,sshd/1305,rpcbind/876 - failed logins (
btmpis root-only) - HTTP access logs (
/var/log/nginx/*is usually root oradm) - per-process disk I/O, SMART disk health, and the full journal
Root does not add temperatures. If the hardware is not there — a virtual machine, say — no privilege level invents it.
Packet-level inspection is deliberately out of scope — it would need CAP_NET_RAW.
The demo reads only. It never writes files, makes network requests, or passes input to a shell. The library it is built on has zero runtime dependencies and touches nothing.
Build your own
bun add @profullstack/hqtuiimport { createApp } from "@profullstack/hqtui";
const app = await createApp();
app.render(({ ui }) => {
ui.panel({ title: "Hello" }, (panel) => panel.text("Hello, terminal."));
});
await app.start();Docs at hqtui.com · source at github.com/profullstack/hqtui · MIT.