
@quickstat/fastify
v0.0.4
Published
Effortlessly monitor fastify rest metrics and export them to Prometheus for visualization in Grafana
Maintainers
 dxloop
Readme
QuickStat Fastify Plugin
The QuickStat Fastify Plugin provides seamless integration for monitoring REST metrics in Fastify applications. It exports these metrics to Prometheus, enabling visualization in Grafana dashboards.
If you are new to QuickStat and its components, feel free to check the official documentation for a detailed breakdown.
If one of the following frameworks is being used, the dedicated plugins should be used instead of the Fastify plugin:
Installation
Install the QuickStat core package, the Prometheus data source, and the Fastify plugin:
npm install @quickstat/core
npm install @quickstat/prometheus
npm install @quickstat/fastify
Getting Started
If you use Docker and want to get started quickly, check out the docker-setup for a streamlined setup. Once Docker is configured, proceed to Step 3.
For manual setup or if you are unfamiliar with QuickStat's plugins, follow these steps:
1. Setup Prometheus and Grafana
- Install Prometheus: Follow the official documentation to install Prometheus.
- Install Grafana: Refer to the official documentation for Grafana installation.
- Configure Prometheus Data Source in Grafana: After installing Grafana, add Prometheus as a data source by specifying its URL.
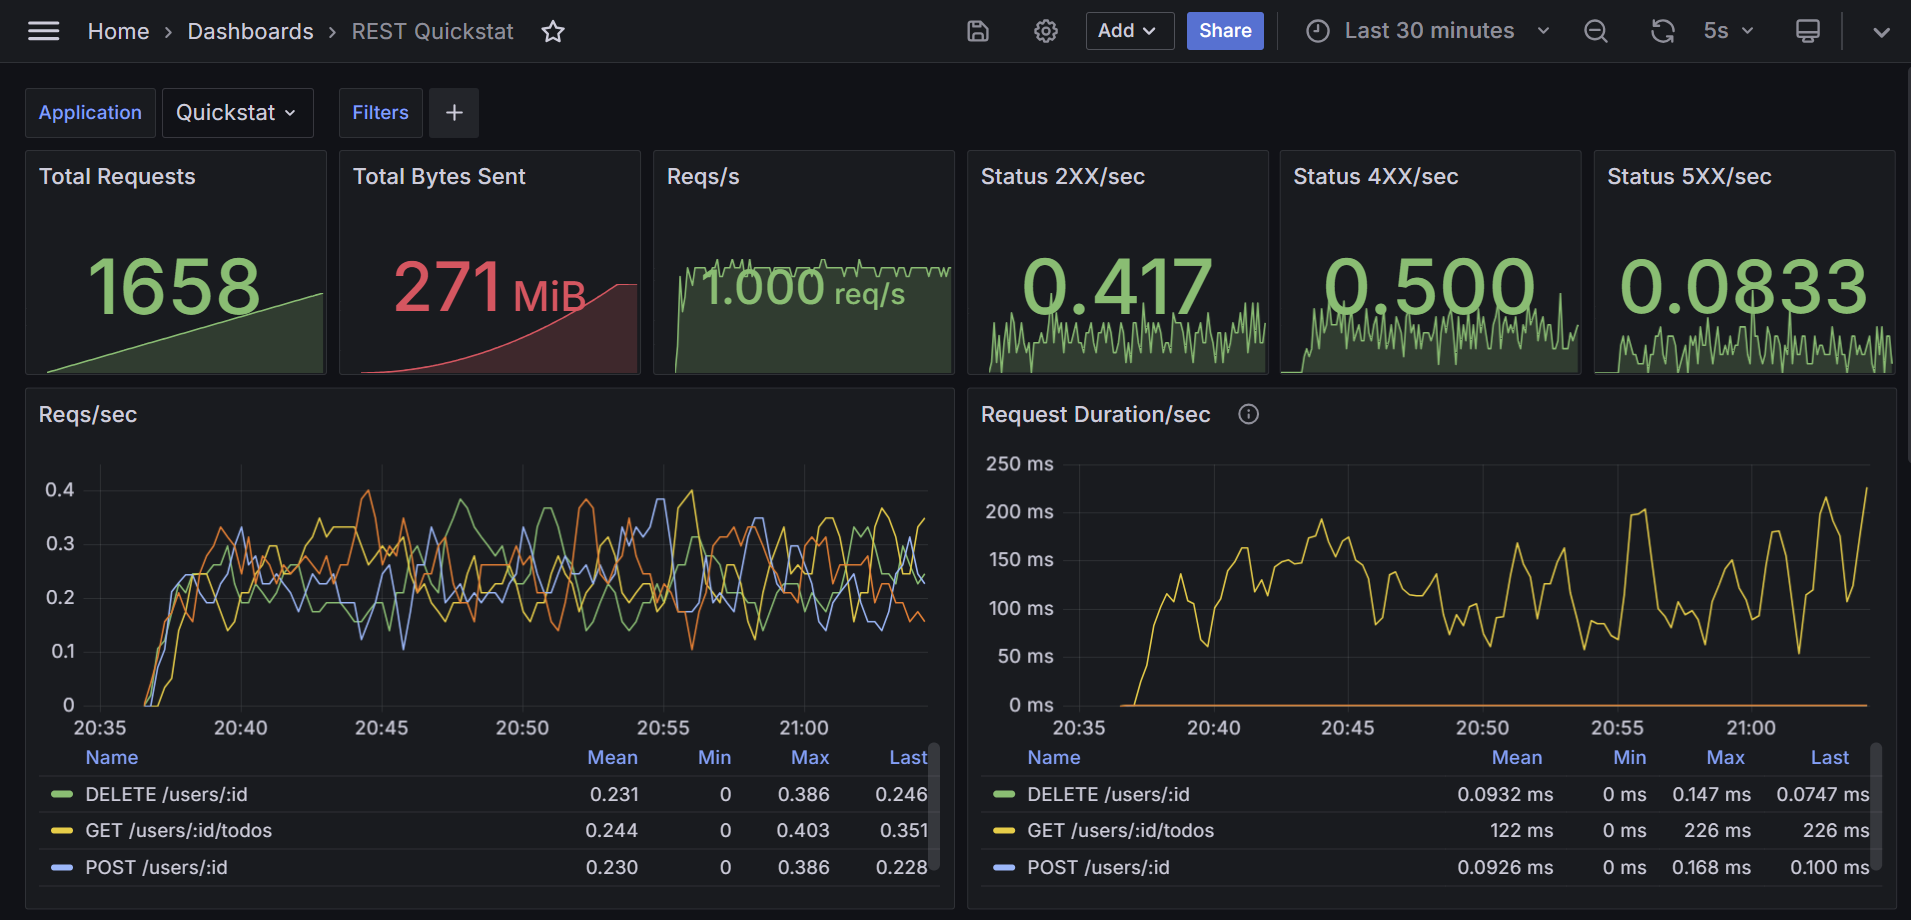
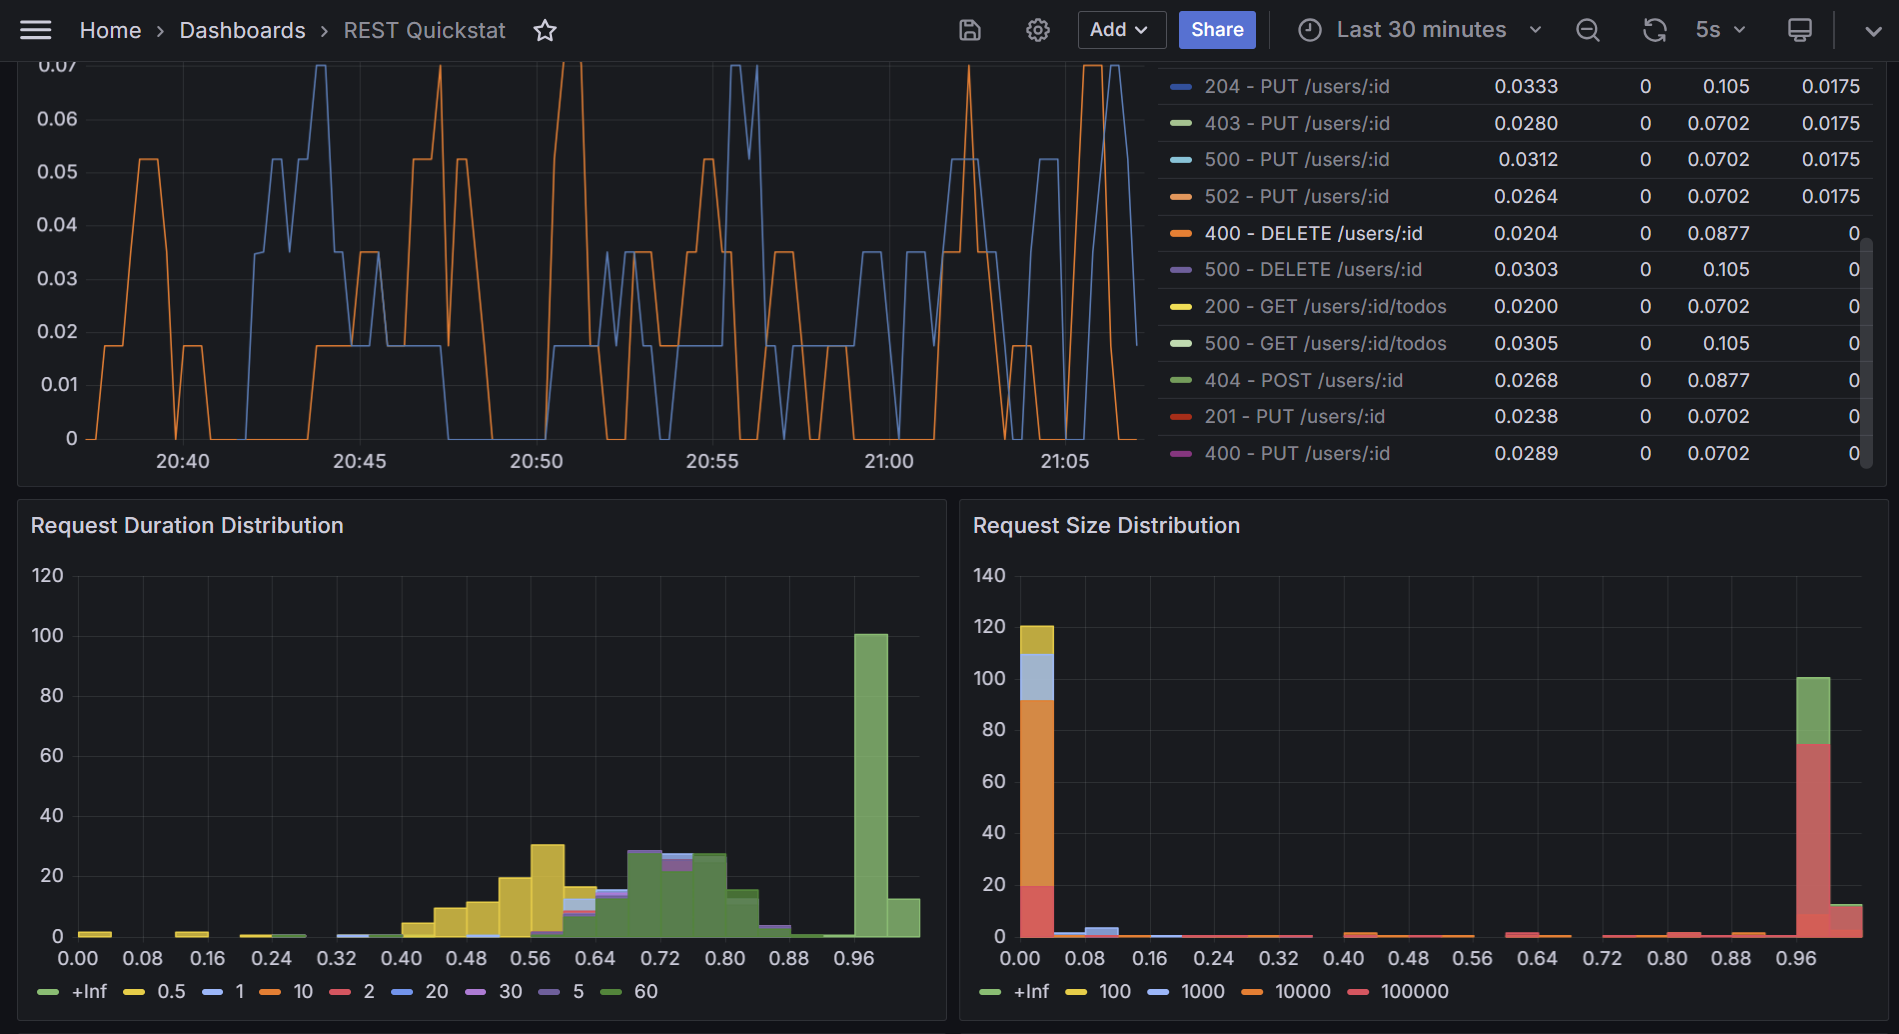
2. Import Dashboard to Grafana
Add the dashboard to Grafana by navigating to the dashboard page, clicking "Import" and pasting the dashboard template URL. Customize the dashboard based on your needs.
3. Expose Fastify Metrics
To expose metrics to Prometheus using the QuickStat Fastify Plugin, use the following code snippet:
import fastify from 'fastify'
import { Client as QuickStatClient } from '@quickstat/core'
import { FastifyPlugin } from '@quickstat/fastify'
import { PrometheusDataSource, ScrapeStrategy } from '@quickstat/prometheus'
import http from 'http'

const app = fastify()

// Create QuickStat Client
const quickStatClient = new QuickStatClient<PrometheusDataSource<ScrapeStrategy>>({
  metrics: [],
  plugins: [
    // Register Fastify Plugin
    new FastifyPlugin({
      app: app,
    }),
  ],
  // Register the data source
  dataSource: new PrometheusDataSource({
    strategy: new ScrapeStrategy(),
  }),
})

// Fastify Routes Handling
app.put('/users/:id', async (request, reply) => {
  reply.code(204).send('User updated')
})

app.listen({ port: 3034 }, () => {
  console.log('Server started at http://localhost:3034')
})

// Let Prometheus scrape the metrics at http://localhost:3242
// WARNING: On production, properly secure the endpoint (if open)
http.createServer(async (req, res) => {
  const response = await quickStatClient.dataSource?.strategy?.getResponse()

  // Write the Prometheus response file
  if (response) {
    res.writeHead(200, response.headers)
    res.end(response.file)
  }
}).listen(3242)
4. Start the Application
After setting up the code, start the application. The metrics will be available at http://localhost:3242 in Prometheus format and will be scraped by Prometheus, which will then be used for visualization in Grafana.
Configuration
DataSource
The example uses the PrometheusDataSource with the ScrapeStrategy. This strategy exposes the Prometheus file on a specified endpoint for scraping by Prometheus. Alternatively, use the PushGatewayStrategy to push metrics to the Prometheus PushGateway.
For other data sources, refer to the available options in the @quickstat/core package.
Plugin Options
| Option | Description | Default | | -------------- | --------------------------- | -------- | | app | Fastify application | required | | excludeMetrics | Array of metrics to exclude | [] |
Contributing and Issues
For issues or feature requests, feel free to open an issue on the GitHub repository.