
@rgrueneis/rxjs-visualizer
v1.3.6
Published
plugin to graphically visualize RxJs observables
Maintainers
 rgrueneis
Readme
RxJsVisualizer
This plugin is intended to illustrate streaming with RxJs.
For this purpose, the resulting values/objects are displayed on a timeline by making special observer objects available.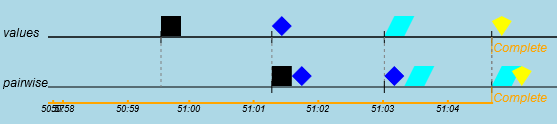
You can configure whether the elements are displayed as graphic symbols or as texts/values.
List of features
- Display values of observables on various timeplines
- Operator
drawto be used within a pipe - Various generation functions
- UMD module that can be used in plain Javascript as well as in Angular/Ionic
Download & Installation
node
$ npm i @rgrueneis/rxjs-visualizer yarn
$ yarn add @rgrueneis/rxjs-visualizer Usage Plain HTML
To use RxVis the following is required:
- RxJs 7.x
- rxjs.visualizer.min.js
- a
<canvas>-Element - optionally a
<div>for displaying the logs
A minimal setup could look like this:
HTML
<html>
<head>
  <meta charset="UTF-8" />
  <title>Hello RxJs</title>
  <!-- <script src="https://unpkg.com/rxjs/bundles/rxjs.umd.min.js"></script>  -->
  <script src="node_modules/rxjs/dist/bundles/rxjs.umd.min.js"></script>
  <script src="node_modules/@rgrueneis/rxjs-visualizer/rxjs.visualizer.umd.min.js"></script>
  <script src="index.js"></script>
  <link rel="stylesheet" type="text/css" href="index.css">
</head>
<body>
  <canvas id="canvas" width="700" height="300"></canvas>
  <div id="logs">Output comes here</div>
</body>
</html>
Javscript
window.onload = () => {
  RxJsVisualizer.init({
    canvasId: 'canvas',
    logDivId: 'logs'
  });

  RxJsVisualizer.prepareCanvas(['values']);
  RxJsVisualizer.startVisualize();
  RxJsVisualizer.createStreamFromArraySequence([10, 11, 12, 13, 14])
    .subscribe(RxJsVisualizer.observerForLine(0, 'value', true));
};
CSS
.clock {
  color: blue;
}
.msg, .error {
  margin-left: 1em;
}
.error {
  color: red;
}
.completed {
  color: green;
}
#logs {
  margin-top: 1em;
  font-family: 'Courier New', Courier, monospace;
  font-size: 0.75em;
}
#canvas {
  background-color: lightblue;
}
References Plain Javascript
The following references have to be added to a Javascript file to be able to use RxJs visualization:
  const { DrawingSymbol } = RxJsVisualizer;
  const { draw } = RxJsVisualizer.operators;
Angular/Ionic
For Angular or Ionic a <canvas> tag has to be positioned, usually in app.component.html:
<router-outlet></router-outlet>
<canvas id="canvas" width="680" height="150"
        style="background-color:skyblue;z-index: 999;position: absolute;bottom: 55px;"></canvas>
References Angular/Ionic
The following imports have to be added to app.component.ts:
import { init, draw, prepareCanvas, startVisualize } from '@rgrueneis/rxjs-visualizer';Core concepts
The following chapters show the core concepts of RxJsVisualizer. They are shown for plain Javascript. Next to that chapter the code snippet for Angular/Ionic is shown.
init
Before using RxJsVisualizer the RxVis-object has to be initialized. This is done with an options object, which in the minimal version looks like this.
RxJsVisualizer.init({
    canvasId: 'canvas',
    logDivId: 'logs'
});
The Ids correspond to the Ids of a <canvas> and a <div>, respectively, given in the HTML file.
startVisualize
To start the visual animation the function startVisualize() has to be called. This will clear the canvas and (re)start the timer.
RxJsVisualizer.prepareCanvas(['values']);
RxJsVisualizer.startVisualize();
RxJsVisualizer.createStreamFromArraySequence([10, 11, 12, 13, 14])
    .subscribe(RxJsVisualizer.observerForLine(0, 'value', true));
Observer
Two functions are required:
prepareCanvas: the array given as parameter specifies the number and headings of the various timelinesobserverForLine: specifies the line index, where the objects of the stream are written/drawn.
RxJsVisualizer.prepareCanvas(['Val']);
RxJsVisualizer.startVisualize();
Rx.timer(1000, 2000)
      .pipe(take(3))
      .subscribe(RxJsVisualizer.observerForLine(0));
This will result in the following output:
pipeable operator draw
Another possibility to draw to the timeline is using the pipeable operator draw.
Example:
RxJsVisualizer.prepareCanvas(['values', 'times10']);
RxJsVisualizer.startVisualize();
RxJsVisualizer.createStreamFromArraySequence([10, 11, 12, 13, 14])
    .pipe(
        draw(0, '', true),
        map(x => x * 10)
    )
    .subscribe(RxJsVisualizer.observerForLine(1, '*10:', true));
Result: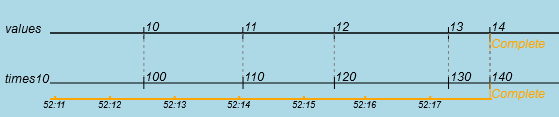
Angular/Ionic
For Angular/Ionic the init routine is best placed in app.component.ts at the end of ngOnInit():
init({
  canvasId: 'canvas',
  blockHeight: 50,
  shapeSize: 20,
  autoExpandCanvasWidth: false
});
prepareCanvas(['A', 'B', 'C']);
startVisualize();
// next lines for testing:
// prepareCanvas(['values', 'times10']);
// createStreamFromArraySequence([10, 11, 12, 13, 14])
//   .pipe(
//     draw(0, '', true),
//     map(x => x*10)
//   )
//   .subscribe(observerForLine(1, '*10:', true));
Symbols
Instead of writing text to the timeline it is often more vivid to display symbols instead.
To do so, for any text a symbol can be registered (details to class DrawingSymbolsee below).
const symbols = {};
symbols['[object MouseEvent]'] = new DrawingSymbol({ color: 'blue', shape: 'circle' });
symbols['0'] = new DrawingSymbol({color:  'white', shape:'circle'});
symbols['1'] = new DrawingSymbol({color:  'black', shape:'square'});
symbols['2'] = new DrawingSymbol({color:  'red', shape:'triangle'});
RxJsVisualizer.init({
    canvasId: 'canvas',
    logDivId: 'logs',
    symbolMap: symbols
});
RxJsVisualizer.useRandomSymbolsForNumbers(100);
With these symbols the above RxJs-stream will be displayed like this: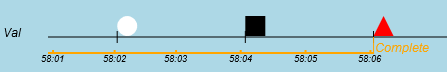
useRandomSymbolsForNumber
As marble diagrams are used quite often, a helper function is available to generate standard symbols for numbers. The following code generates symbols for all numbers 0-99:
RxJsVisualizer.useRandomSymbolsForNumbers(100);API
The plugin essentially consists of the object RxJsVisualizer.
Various shape objects are registered in the class ShapeFactory, which is not accessible to the user.
Any of the registered shapes can be used by creating and mapping an instance of class DrawingSymbol to a text.
The elapsed time is indicated as a growing orange line below the last timeline.
Shapes
The following shapes are available: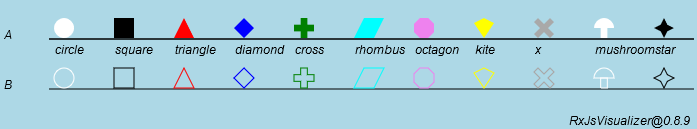
RxJsVisualizer
This class is responsible for drawing objects to the timeline. The number of timelines can configured by the user. The general setup is configured with the init method.
init
Before using any other functions of RxVis this method has to be called once. The only parameter is an options object with the following properties.
|key |type |Default |description|
|:----------------------|:---------:|:---------:|-----------|
|headerWidth |number |50 |Number of pixels used for the header on each line|
|marginHorizontal |number |5 |Margin in pixels left and right|
|marginVertical |number |40 |Margin top and bottom in pixels.|
|blockHeight |number |50 |Height of a timline-block in pixels.|
|shapeSize |number |20 |Size of a shape symbol in pixels|
|centerShapes |boolean |false |Specifies if the shapes are drawn centered on the time tick or next (=right) to the timetick.|
|autoExpandCanvasWidth |boolean |false |If true, stretches the canvas width so that the whole browser window is used horizontally.|
|Font |string |'italic 12px sans-serif' |With this font any text is drawn to the timeline.|
|guidelineColor |string |'gray' |Color of the guideline (the dotted line down to the last timeline)|
|tickColor |string |'black' |Color of the ticks|
|colors |array |['white', 'black', 'red', 'blue', 'green', 'cyan', 'violet', 'yellow', 'darkgray'] |The standard colors used when generating random symbols.|
|canvasId |string |'canvas' |Id of the -Element. Here the visualization is displayed.|
|logDivId |string |'logs' |Id of the -Element that should show the logs.|
|maxPeriod |number |10000 |Maximum period of the timeline [milliseconds].|
|tickPeriod |number |1000 |Number of milliseconds when a timestamp is drawn.|
|symbolMap |object |{} |Map that defines, which text should be replaced by which symbol. Format: {string:DrawingSymbol}|
|guidelineColor |string |'gray' |Color of the dotted vertical guidelines|
|showTimeTicks |boolean |true |Indicates if a time tick is drawn every second to the timeline|
|tickColor |string |'black' |Color of the ticks on the timelines.|
|addNavigationButtons |boolean |false |Add buttons to the canvas to be able to stop scrolling and navigate back and forth 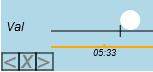 |
|maxLogLength |number |-1 |used to limit the output strings in the log div (<=0) ==> do not lmit|
|
|maxLogLength |number |-1 |used to limit the output strings in the log div (<=0) ==> do not lmit|
Example:
RxJsVisualizer.init({
    canvasId: 'canvas',
    logDivId: 'logs',
    blockHeight: 50,
    shapeSize: 20,
    centerShapes: false,
    symbolMap: {
      '[object MouseEvent]': new DrawingSymbol({ color: 'blue', shape: 'circle' })
    }
});
prepareCanvas
This method specifies the number of lines and the headers shown for each line. |parameter |type |Default |description| | --------------------- |:---------:|:---------:| --------- | |headerNames |array |['A','B'] |Number names of the header of each line|
Example:
RxJsVisualizer.prepareCanvas(['A', 'B']);observerForLine
With this function an observer is created for a given timeline. All next, error or complete values are then drawn at the timeline.
|parameter |type |Default |description|
| --------------------- |:---------:|:---------:|:--------- |
|lineNr |number |- |Number of the timeline where this observer shall draw its values (zero-based).|
|header |string |'' |This header is only used for the log output to identify the source of the output. For the graphical display this value is ignored.|
|shouldIgnoreSymbols |boolean |false |If set to true, no symbols are used for this timeline, no matter if there is a symbol defined for the text or not.|
|valueMapper |function |- |If set, this function is called for each value before it is written/drawn to the timeline. Example: observerForLine(0, 'name', false, x => x.substr(0, 2))
It has to be imported from RxJsVIsualizer.operators.
Example:
RxJsVisualizer.prepareCanvas(['Val']);
RxJsVisualizer.startVisualize();
Rx.timer(1000, 2000)
  .pipe(take(3))
  .subscribe(RxJsVisualizer.observerForLine(0));
startVisualize
When starting a new RxJs stream, this method has to be called before. It clears the display as well as the logs and starts the timer.
Example:
RxJsVisualizer.prepareCanvas(['Val']);
RxJsVisualizer.startVisualize();
Rx.timer(1000, 2000)
  .pipe(take(3))
  .subscribe(RxJsVisualizer.observerForLine(0));
useRandomSymbolsForNumbers
As often numbers are produced for RxJs demos with this function random symbols are generated for a range of numbers. So the symbolMap is automatically extended for the given numbers. |parameter |type |Default |description| | --------------------- |:---------:|:---------:|:--------- | |maxNr |number |100 |Numbers [0..maxNr] are mapped to random colored symbols.
Example:
RxJsVisualizer.useRandomSymbolsForNumbers(100);writeToLine
Some additional text can be drawn at the current time-position to the given timeline. It will be shown below the timeline. |parameter |type |Default |description| | --------------------- |:---------:|:---------:|:--------- | |lineNr |number |- |Numbers of the timeline |Text |string |- |String to be written to the timeline.
Example:
RxJsVisualizer.prepareCanvas(['produce', 'A', 'B']);
const observable = Rx.interval(1000).pipe(take(3));
observable.subscribe(RxJsVisualizer.observerForLine(0, 'produce'));
const connectable = observable.pipe(publish());
RxJsVisualizer.writeToLine(1, 'Subscribing now A');
connectable.subscribe(RxJsVisualizer.observerForLine(1, 'subscriber A'));
RxJsVisualizer.writeToLine(2, 'Subscribing now B');
connectable.subscribe(RxJsVisualizer.observerForLine(2, 'subscriber B'));
setTimeout(_ => {
    RxJsVisualizer.writeToLine(0, 'Connect');
    connectable.connect();
}, 2500);
rnd
Helper function to create random numbers in a given range. |parameter |type |Default |description| | --------------------- |:---------:|:---------:|:--------- | |to |number |- |Upper limit (inclusive) |from |number |- |Lower limit (inclusive)
createStreamFromArrayRandom
Creates a stream that randomly produces a number of values from a given array in randomly delayed periods. |parameter |type |Default |description| | --------------------- |:---------:|:---------:|:--------- | |array |array |- |Array to take the values from |totalNr |number |- |Total number of values to produce |minDelay |number |500 |Minimum delay (milliseconds) |maxDelay |number |2000 |Maximum delay (milliseconds)
Example:
RxJsVisualizer.prepareCanvas(['random']);
RxJsVisualizer.startVisualize();
RxJsVisualizer.createStreamFromArrayRandom(['a', 'b', 'c'], 5)
    .subscribe(RxJsVisualizer.observerForLine(0, 'random'));
createStreamFromArraySequence
Creates a stream that produces all values in sequence from a given array in randomly delayed periods. |parameter |type |Default |description| | --------------------- |:---------:|:---------:|:--------- | |array |array |- |Array to take the values from |minDelay |number |500 |Minimum delay (milliseconds) |maxDelay |number |2000 |Maximum delay (milliseconds)
Example:
RxJsVisualizer.prepareCanvas(['seq']);
RxJsVisualizer.startVisualize();
RxJsVisualizer.createStreamFromArraySequence(['a', 'b', 'c'])
    .subscribe(RxJsVisualizer.observerForLine(0, 'seq'));
createStreamFromArrayOnClick
Creates a stream that randomly produces values from at button clicks. With additional buttons also an error and complete can be triggered. |parameter |type |Default |description| | --------------------- |:---------:|:---------:|:--------- | |array |array |- |Array to take the values from |buttonProduceId |string |- |Id of the element that triggers production of a value |buttonCompleteId |string |- |Id of the element that triggers completion of the observable |buttonErrorId |string |- |Id of the element that triggers an error for the observable
Example:
RxJsVisualizer.prepareCanvas(['click']);
RxJsVisualizer.startVisualize();
RxJsVisualizer.createStreamFromArrayOnClick(['a', 'b', 'c'], 'btnNext', 'btnComplete', 'btnError')
    .subscribe(RxJsVisualizer.observerForLine(0));
createStreamFromSubjectOnClick
Same as createStreamFromArrayOnClick, but the values are produced at the subject that is given as the first parameter. |parameter |type |Default |description| | --------------------- |:---------:|:---------:|:--------- | |array |Subject |- |Subject that will receive the produced values |buttonProduceId |string |- |Id of the element that triggers production of a value |buttonCompleteId |string |- |Id of the element that triggers completion of the observable |buttonErrorId |string |- |Id of the element that triggers an error for the observable
Example:
RxJsVisualizer.prepareCanvas(['Event']);
RxJsVisualizer.startVisualize();
const obs = new Subject();
RxJsVisualizer.createStreamFromSubjectOnClick(obs, 'btnNext', 'btnComplete', 'btnError')
    .subscribe(RxJsVisualizer.observerForLine(0));
obs.next('Started');
setInterval(() => obs.next(new Date().getSeconds()), 1000);
operators
One operator is available to draw produced items to a timeline.
draw
This pipeable operator works similar to observerForLine, but it can used inside a pipe().
|parameter |type |Default |description|
| --------------------- |:---------:|:---------:|:--------- |
|lineNr |number |- |Number of the timeline where this observer shall draw its values (zero-based).
|header |String |'' |This header is only used for the log output to identify the source of the output. For the graphical display this value is ignored.
|shouldIgnoreSymbols |boolean |false |If set to true, no symbols are used for this timeline, no matter if there is a symbol defined for the text or not.
|valueMapper |function |- |If set, this function is called for each value before it is written/drawn to the timeline. Example: observerForLine(0, 'name', false, x => x.substr(0, 2))
It has to be imported from RxJsVIsualizer.opertors:
const { draw } = RxJsVisualizer.operators;or for Angular/Ionic
import { draw } from '@rgrueneis/rxjs-visualizer';Example:
RxJsVisualizer.prepareCanvas(['values', 'times10']);
RxJsVisualizer.createStreamFromArraySequence([10, 11, 12, 13, 14])
    .pipe(
        draw(0, '', true),
        map(x => x * 10)
    )
    .subscribe(RxJsVisualizer.observerForLine(1, '*10:', true));
DrawingSymbol
This class represents a symbol (marble) that can be used to be drawn instead of a specific text. The constructor takes an option object with the following properties |parameter |type |Default |description| | --------------------- |:---------:|:---------:|:--------- | |text |string |- |Text to be displayed |color |string |'black' |Color used for the symbol |shape |string |'' |Shape of the symbol |imageUrl |string |'' |Path to an image file |strokeOnly |boolean |false |If the symbol is a shape, this flag specifies, if the shape is filled or only stroked.
What is actually drawn?
- if the imageUrl is set, the image is drawn
- if imageUrl is not set and a shape is given, the shape is drawn filled with the given color
- if neither imageUrl nor shape is given, the text is written in the given color
Example shape:
symbols['[object MouseEvent]'] = new DrawingSymbol({ color: 'blue', shape: 'circle' });Example image:
symbols['[object MouseEvent]'] = new DrawingSymbol({ imageUrl: 'images/flash.png' });