
@satyadip28/isoform
v0.8.3
Published
Machined 3D system architecture diagrams for the browser — part catalog, document model, router, renderer and a mountable editor
Downloads
1,374

Maintainers
 satyadip28
Readme
Isoform
Machined 3D system architecture diagrams for the browser. Parts are modelled as the objects they represent — a rack chassis, a shipping container, a bucket with a handle, a signpost — under one locked studio rig.
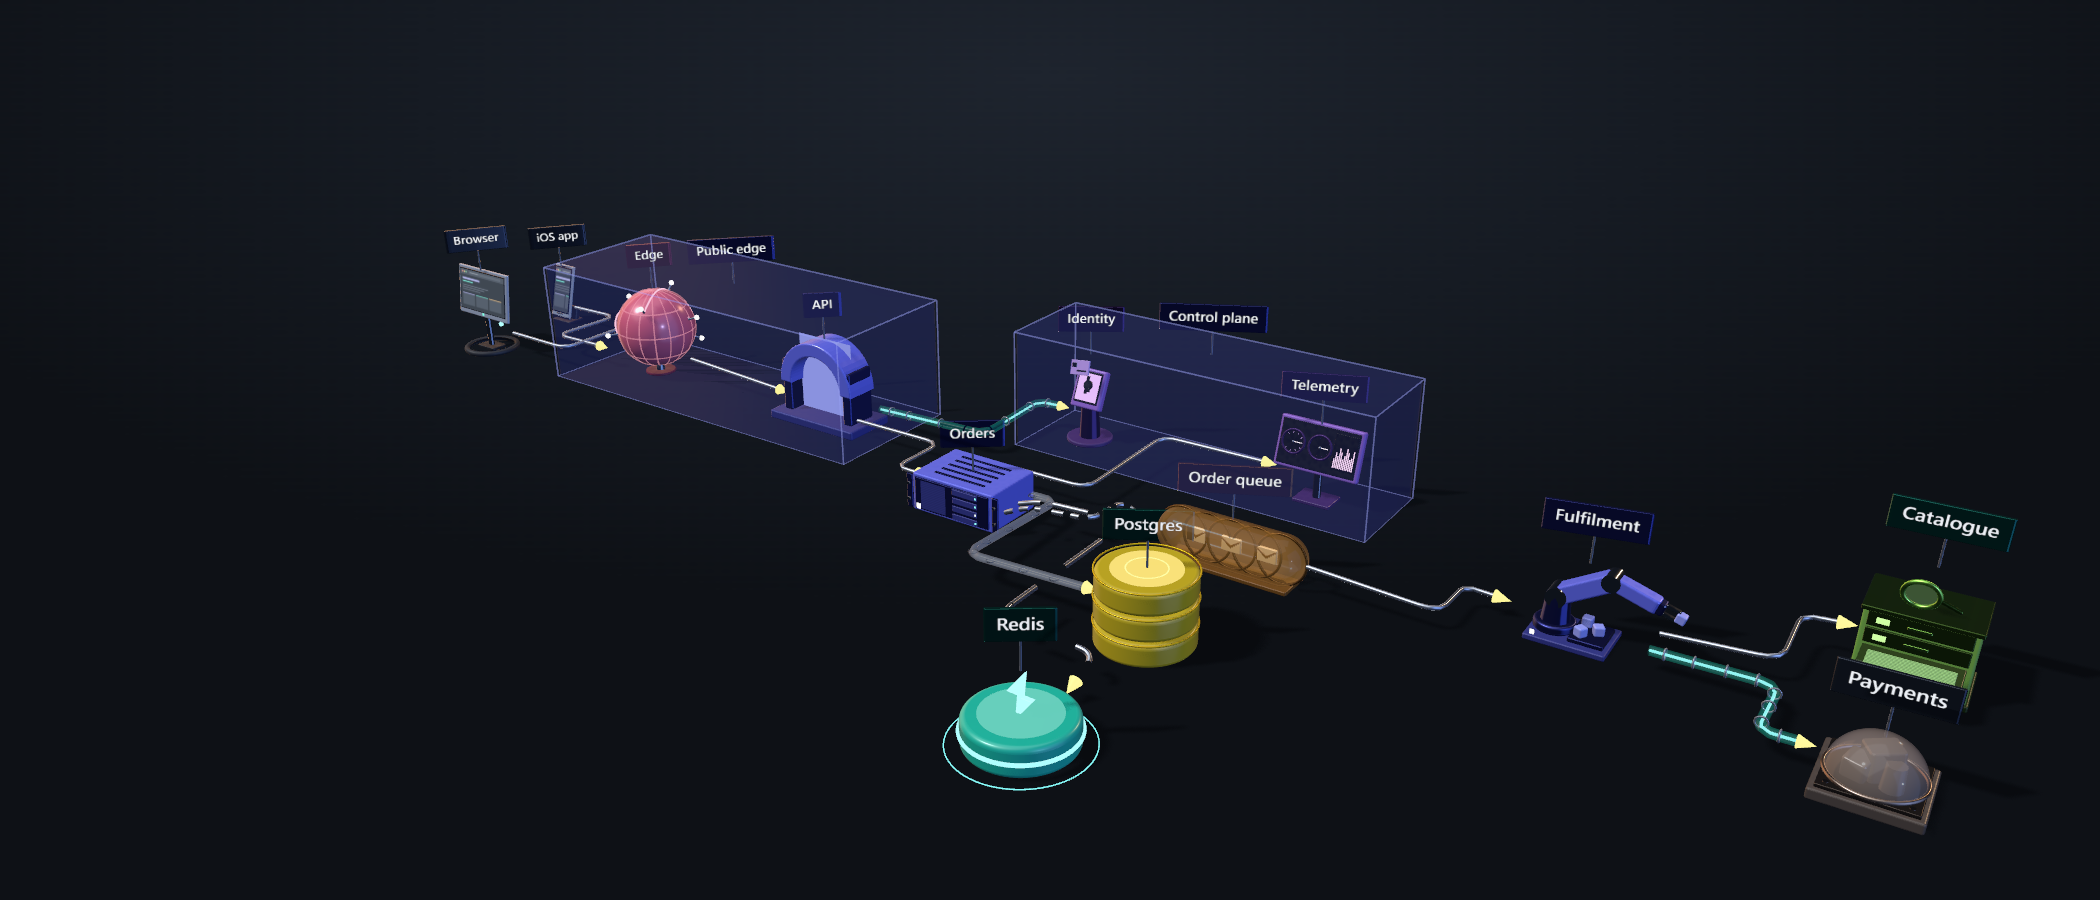
One package: a part catalog, a document model, an orthogonal router, a renderer, and an editor you mount with a single call.
Install
npm install @satyadip28/isoform threethree is a peer dependency, deliberately. An app that already uses three
must not end up with two copies — that breaks instanceof across the boundary
and ships the runtime twice.
Requires WebGL2 and three >= 0.180.
Scoped because npm refused the bare name: "Package name too similar to existing package iso-form". Scoped packages skip that similarity check.
Quick start
import { createEditor } from '@satyadip28/isoform'

const editor = createEditor(document.getElementById('app')!)
<div id="app" style="width: 100vw; height: 100vh"></div>That is the whole of it. The editor builds its own DOM and injects its own styles — there is no markup to copy and no stylesheet to remember to import. It fills the element you give it rather than positioning against the viewport, so it works just as well in a panel, a split view or a modal.
Recipes
Open with a diagram written as text
Text carries no positions, so run layout over it before showing it — that is
the point of describing a system rather than placing it.
import { createEditor, parseDsl, layout, fitGroups } from '@satyadip28/isoform'

const { doc, issues } = parseDsl(`
  web    client   "Browser"
  api    gateway  "API"
  svc    service  "Orders"
  pg     database "Postgres"
  mq     queue    "Jobs"
  w      worker   "Fulfilment"

  web -> api
  api -> svc
  svc => pg
  svc ~> mq
  mq  -> w

  group "Backend" { svc, pg }
`)
if (issues.length) console.warn(issues)   // { line, message }[]

const { positions } = layout(doc)
for (const node of doc.nodes) node.pos = positions.get(node.id) ?? node.pos
doc.groups = fitGroups(doc)

createEditor(el, { doc })
Connector kinds: -> sync, ~> async, => flow, +> secure, <->
duplex. A trailing # starts a comment; a trailing #rrggbb is a tint, and a
trailing state name is a state — either order, both optional:
pg     database "Postgres"  down
cache  cache    "Redis"     #b45309  degraded
Name the connectors too. A quoted string after the target labels the line, and the tag is drawn at the middle of the route it names:
user -> alb "Access via dynamic port"
alb  -> app "Dynamic port mapping via target group"
Most architecture diagrams are mostly verbs — creates, reads from, falls back to — and a diagram that can only draw the nouns is drawing half the system. A second quoted string on a node line is its sublabel:
ecs service "Amazon ECS" "cluster"Text is also an output. toDsl(doc) writes the document back out, and
dslGaps(doc) lists what the format cannot carry — positions are derived by
layout, so they are never written, and anything else that would be lost is
emitted as a comment beside the declaration it belongs to rather than dropped
silently.
Build a document in code
import { createEditor, emptyDoc, type Doc } from '@satyadip28/isoform'

const doc: Doc = emptyDoc()
doc.nodes = [
  { id: 'web', type: 'client',   label: 'Browser',  pos: [-4, 0], rot: 0 },
  { id: 'api', type: 'gateway',  label: 'API',      pos: [0, 0],  rot: 0 },
  { id: 'db',  type: 'database', label: 'Postgres', pos: [4, 0],  rot: 0, tint: '#3ED8BC' },
]
doc.edges = [
  { id: 'e1', from: { node: 'web' }, to: { node: 'api' }, kind: 'sync', route: 'auto' },
  { id: 'e2', from: { node: 'api' }, to: { node: 'db'  }, kind: 'flow', route: 'auto' },
]

createEditor(el, { doc })
pos is [x, z] on the ground plane in grid units; rot is yaw in radians.
Positions snap to 0.5u in the editor, but any value is legal.
Persist what the user draws
import { createEditor, serialize, deserialize } from '@satyadip28/isoform'

const saved = localStorage.getItem('diagram')
const editor = createEditor(el, { doc: saved ? deserialize(saved) : undefined })

const stop = editor.onChange((doc) => {
  localStorage.setItem('diagram', serialize(doc))
})
onChange returns an unsubscribe. editor.save() gives you the document
directly if you would rather pull than subscribe.
Render an image with no editor
For a thumbnail service, a CI artefact, or a docs build. Needs a WebGL context — a headless browser will do — but no visible canvas and no user.
import { parseDsl, layout, fitGroups, renderDocument } from '@satyadip28/isoform'

const { doc } = parseDsl(source)
const { positions } = layout(doc)
for (const node of doc.nodes) node.pos = positions.get(node.id) ?? node.pos
doc.groups = fitGroups(doc)

const png = renderDocument(doc, { width: 1920, preset: 'hero' })
// a data: URL. preset is 'hero' | 'iso' | 'top'
Measured at roughly 850ms per render; the first call pays about 3s more to warm the geometry and texture caches. The document is not modified.
Show a request travelling the system
A trace is a path through the diagram, stored in the document and played as motion. The packet runs the actual routed connectors, hop by hop.
web    client   "Browser"
api    gateway  "API"
orders service  "Orders"
pg     database "Postgres"

web -> api
api -> orders
orders => pg

trace "Checkout" { web -8-> api -14-> orders -310-> pg }
The numbers are milliseconds per hop and they are the difference between decoration and information. Without them the packet moves at constant speed and shows only the route; with them, playback is divided by duration rather than distance — so a 310 ms query visibly dominates, which is usually the whole point of showing the trace.
Each duration sits on the hop it belongs to. A trailing array would have to be paired positionally, and a mispairing animates perfectly while lying about which hop is slow.
Render a still of it:
const { doc } = parseDsl(text)
renderDocument(doc, { trace: doc.traces[0].id, traceAt: 0.5 })
Traces parsed from text are given generated ids; the quoted string is the label. Build the document in code if you want to choose the id yourself.
A hop naming two parts with no connector between them is reported rather than thrown — the hops that exist are drawn and the gaps are named.
Mark what is healthy, degraded or planned
tint is a colour and means whatever you decide. state is a fixed vocabulary
rendered identically everywhere, so a reader learns it once:
{ id: 'pg', type: 'database', label: 'Postgres', state: 'degraded' }healthy · degraded · down · new · deprecated · planned
healthy looks exactly like an unset state. They differ only as a claim — one
says nothing, the other says someone checked — and a diagram where everything is
fine must not read as one where everything is flagged.
Show what a part talks to
Click a part in a viewer and its connectors light up by direction — incoming cool, outgoing warm, each with a shine running the way it carries.
const viewer = createViewer(el, { doc })
viewer.emphasise('orders')   // or let a click do it; null clears
Three cues doing three jobs. Direction by hue carries the information, and the two are opposed rather than merely different so the classification survives a glance, peripheral vision, and a red/green deficiency. A travelling shine makes the direction unambiguous where a static arrowhead is a few pixels and is regularly hidden by the geometry it points into. A pulse keeps a short connector reading as live rather than as a stray dot.
Point at part of a diagram
Emphasise a subset; everything else recedes toward the backdrop, connectors and nameplates included.
renderDocument(doc, { focus: ['orders', 'pg'] })Focus is view state, not document state: one diagram supports as many arguments as there are subsets worth pointing at, and none of them is a property of the system being drawn.
Wire a whole tier as one thing
A boundary can terminate a connector, so a line into "Backend" lands on the tier rather than on whichever member happens to sit nearest its edge.
group backend "Backend tier" { orders, pg }

api     -> backend
backend -> metrics
Give the group an id and either end of an edge may name it. In the editor, hovering a boundary reveals its four anchors and a drag lands on them.
Put a diagram on a page people can look around
A picture throws away the one thing that makes this library different — the parts are modelled, and the reason to model them is that you can move around them. There are three exports, in descending fidelity, and which one you use is decided by what the destination allows.
Live, self-contained HTML. One file: three.js, the viewer and the document inlined. No network, so it survives a corporate proxy, an air-gapped wiki and being double-clicked out of an email.
import { exportHtml, downloadHtml } from '@satyadip28/isoform'

downloadHtml(await exportHtml(doc, { title: 'Checkout', autoplay: 'checkout' }))
~670 kB — routinely smaller than a 3840px PNG of the same diagram. The exported
page exposes window.isoform (focus, playTrace, setView, on('select'))
and mirrors it over postMessage, so a host page can drive it inside an iframe.
The document is embedded as readable JSON, so the file doubles as a data file.
On Confluence: Cloud removed the HTML macro and Data Center ships it disabled, so pasting this into page content generally will not work. Attaching the file and linking it does, and an iframe does where hosting exists.
An animated GIF, with a planned camera move. Renders inline anywhere, with no macro permission at all.
import { exportGif, turntable } from '@satyadip28/isoform'

const gif = await exportGif(doc, { ...turntable({ turns: 1, duration: 6 }), width: 900 })
Or author the move, composing camera, focus and a trace on one clock:
await exportGif(doc, {
  from: { az: 0.6, el: 0.5, zoom: 1.2 },
  shots: [
    { camera: 'iso', duration: 2 },
    { camera: { az: 1.1, el: 0.34, zoom: 0.85 }, duration: 5,
      trace: 'checkout', focus: ['web', 'api', 'pg'], traceTo: 1 },
  ],
  fps: 20, width: 900,
})
Sizes are real: 6 s at 900 px is ~2.5 MB. For a moving camera, 700–900 px at
12–20 fps is the sweet spot. fps values dividing 100 (10, 20, 25) are exact —
GIF stores frame time in centiseconds, so 15 fps is really 14.3.
A still PNG, as before — now with transparent: true for a light-themed page.
Embed a viewer without the editor
import { createViewer } from '@satyadip28/isoform'

const viewer = createViewer(el, { doc, autoRotate: 0.1 })
viewer.on('select', (id) => console.log('clicked', id))
viewer.playTrace('checkout')
Orbit, focus, traces and selection events — and none of the palette, inspector, undo stack or gizmos a reader has no use for.
Mount it in React
import { useEffect, useRef } from 'react'
import { createEditor, type Doc } from '@satyadip28/isoform'

export function DiagramEditor({ doc, onChange }: {
  doc?: Doc
  onChange?: (doc: Doc) => void
}) {
  const host = useRef<HTMLDivElement>(null)

  useEffect(() => {
    const editor = createEditor(host.current!, { doc })
    const stop = onChange ? editor.onChange(onChange) : undefined
    return () => {
      stop?.()
      editor.destroy()     // DOM, window listeners and the render loop
    }
  }, [])

  return <div ref={host} style={{ width: '100%', height: '100%' }} />
}
destroy() is required, not optional — an editor that outlives its container
keeps a WebGL context and a render loop alive.
Trim the chrome
createEditor(el, {
  chrome: {
    title: 'Architecture',  // '' drops the wordmark entirely
    help: false,            // the keyboard-shortcut strip
    dsl: false,             // the Text button and its sheet
    files: false,           // PNG / Save / Load
  },
})
Use the engine without the editor
Everything below the editor is exported: the part registry, the document model
and its undo stack, the router, the layout pass and the whole geometry foundry.
createEditor is one consumer of that, not a wrapper around it.
import { Stage, Reconciler, History, palette } from '@satyadip28/isoform'

const stage = new Stage({ canvas })
const reconciler = new Reconciler(stage.scene, {
  anchorIdle: palette('link').lit('lit', 0.9),
})
const history = new History(doc)

history.subscribe((doc) => reconciler.sync(doc))
The document model, layout, routing and serialisation are pure and run in Node with no DOM — useful for validating or generating diagrams server-side.
The catalog — 25 parts
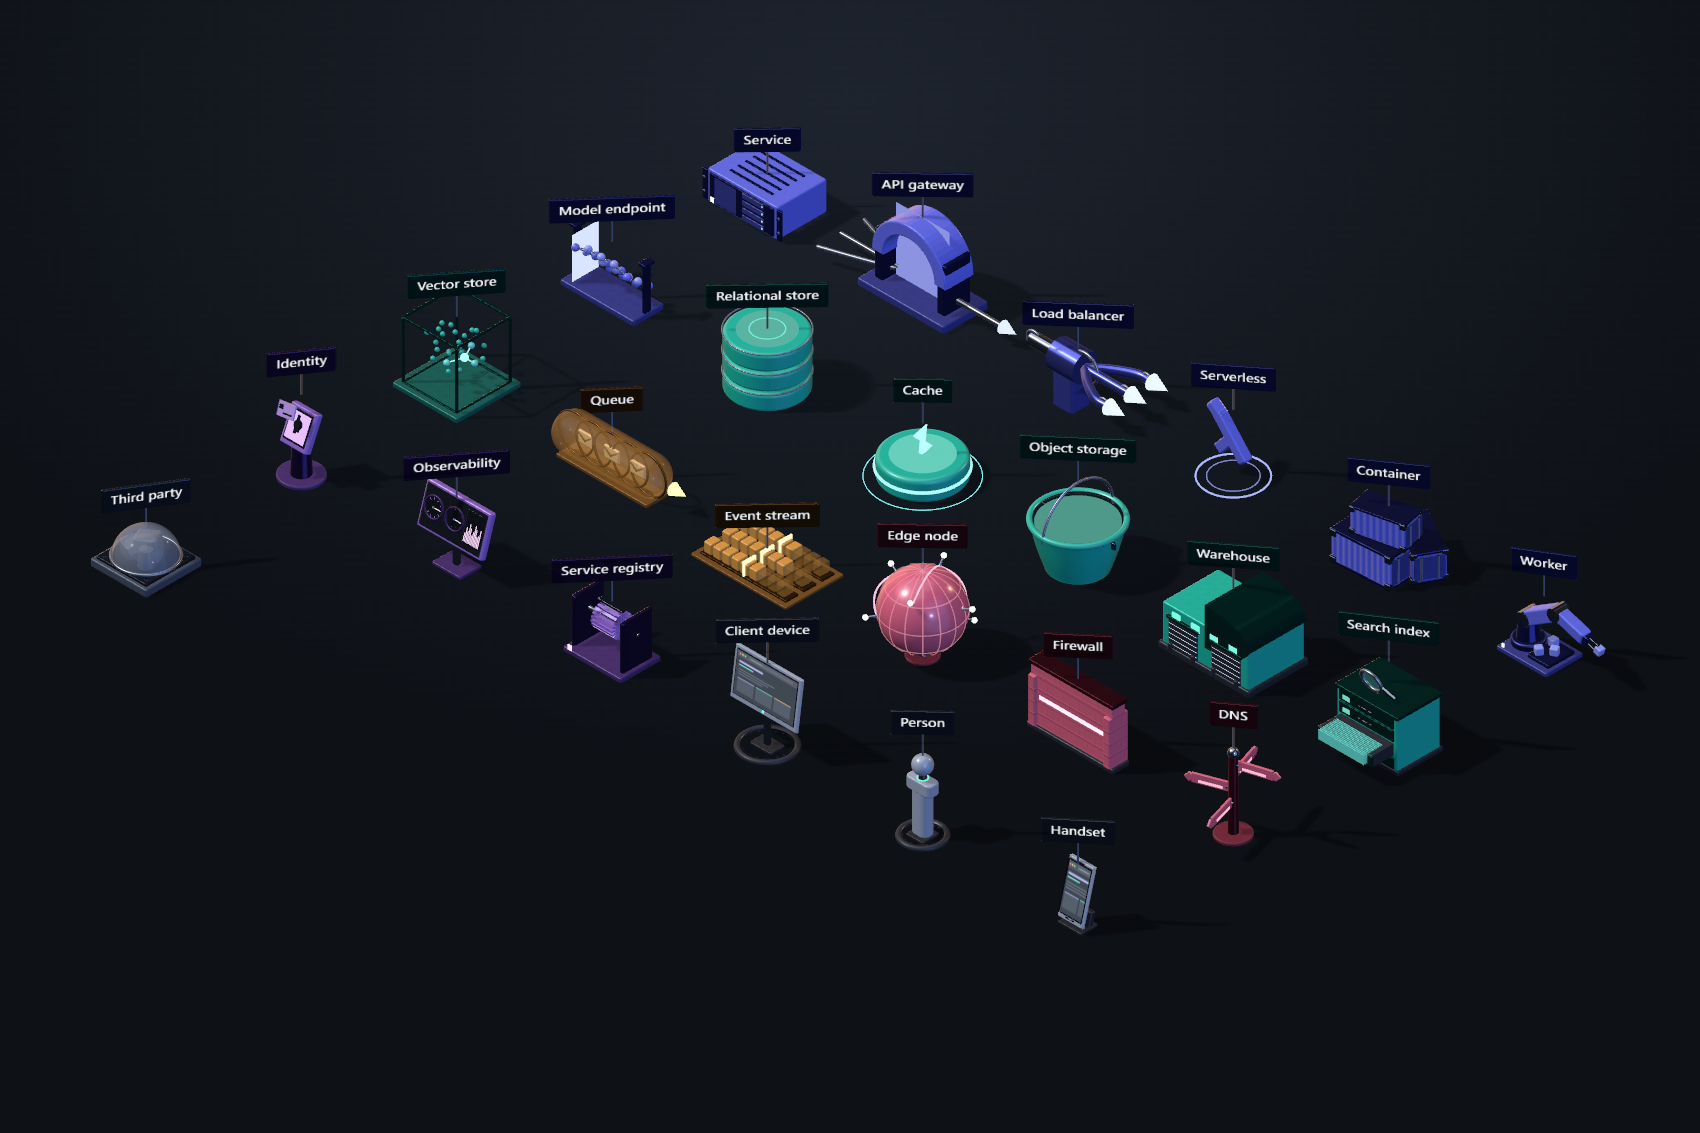
| Group | Parts | |---|---| | Compute | Service · API gateway · Load balancer · Serverless · Container · Worker · Model endpoint | | Data | Relational store · Cache · Object storage · Warehouse · Search index · Vector store | | Messaging | Queue · Event stream | | Edge & network | Edge node · Firewall · DNS | | Control plane | Identity · Observability · Service registry | | Client & external | Client device · Handset · Third party |
Ten of these were added after auditing the catalog against the AWS, Kubernetes and network-diagram icon vocabularies. The gap that audit found was not breadth — it was that the operational plane was entirely missing: a queue shipped with nothing to consume it, and there was nowhere to put the thing that authenticates, the thing that watches, or the thing that knows where everything is. Those were being drawn as tinted services, which is as informative as not drawing them.
The target is deliberately not parity with AWS's 900 icons. Twenty-four parts that look like they came from one factory beat two hundred that look like a clip-art folder, so each addition is modelled as the object it represents and has to survive the catalog's own rule: recognisable at 40px with no label.
ops is a sixth category with its own colour — violet, between compute's indigo
and edge's rose — so a control plane reads as its own layer rather than
dissolving into the services it governs. Category is exported, and both the
DSL's accepted-category set and the editor's boundary-colour dropdown derive
from it rather than repeating the list.
Two parts sit in client that are not clients: Handset and Third party.
That category means outside the system you are drawing, and neutral slate is
right for all three — a third-party service is not yours to colour.
Vector store is data and Model endpoint is compute. A vector store is a database and an inference endpoint runs computation; giving them a bespoke hue would be marketing rather than information design.
API
createEditor(container, options?) → Editor
| Option | Type | Default | |
|---|---|---|---|
| doc | Doc | sample diagram | Document to open with |
| chrome | ChromeOptions | all shown | Which chrome to build |
| debug | boolean | false | Expose internals as editor.debug |
| Member | |
|---|---|
| doc | The document as it stands. Structurally shared — treat as read-only |
| load(doc) | Replace the document, discarding undo history |
| save() | Snapshot of the current document |
| onChange(fn) | Fires after any change. Returns an unsubscribe |
| fit() | Re-frame the camera on the diagram |
| toPNG(width?) | Data URL, without the editing scaffolding |
| destroy() | Remove the DOM, drop listeners, stop the render loop |
Other entry points
| | |
|---|---|
| parseDsl(text) | { doc, issues } — text to document |
| layout(doc) | { positions, ranks } — layered auto-layout |
| fitGroups(doc) | Boundary boxes refitted to their members |
| renderDocument(doc, opts?) | PNG data URL, no editor |
| serialize / deserialize | Document to and from a JSON string |
| MANIFESTS / PART_IDS | The part catalog, as data |
| NODE_STATES | The semantic state vocabulary, as data |
| resolveEdges(doc) | Every connector's resolved anchors and polyline |
| createViewer(el, opts) | Read-only mount: orbit, focus, traces, selection |
| exportHtml(doc, opts?) | One self-contained live HTML file |
| exportGif(doc, opts?) | Animated GIF of a camera move |
| renderFrames(doc, opts) | Raw RGBA frames, for your own encoder |
| turntable(opts?) | A slow orbit, as a storyboard |
| toDsl(doc) / dslGaps(doc) | Document back to text, and what text cannot carry |
| critique(doc, opts?) | Measured findings about the picture it would render |
| suggestPose(doc, opts?) | The camera that shows this diagram best, and why |
| renderSheet(doc, opts?) | One diagram from several angles, as one image |
| renderStory(doc, opts) | A camera move as a strip of stills |
| renderDiff(a, b, opts?) / diffDocs(a, b) | What changed, drawn and as data |
renderDocument options beyond width and camera:
| Option | |
|---|---|
| focus | Ids to emphasise; everything else dims toward the backdrop |
| trace | Id of a trace to draw, paused partway through |
| traceAt | How far through that trace, 0–1. Defaults to the midpoint |
| transparent | Drop the studio backdrop, for a light-themed page |
| depthCue | Fade distant parts toward the backdrop, 0–1. Off by default |
| plate | Draw a finite plate under the diagram. Off by default |
Ask the renderer what is wrong with the picture
critique measures the image renderDocument would produce — through the same
scene and the same camera, so a number moving means the picture moved. Pass the
options you intend to export with, or the answer is about a different picture.
const c = critique(doc, { aspect: 16 / 9, padding: 0.4, labels: true })

c.labelCollisions   // nameplate pairs that overlap on screen
c.clipped           // nameplates crossing the frame edge
c.occludedIds       // parts hidden behind other geometry, by id
c.frameUse          // share of the frame the diagram spans
c.notes             // the same findings in words, worst first
Written for a caller that cannot look at the result — an agent, or CI. Asserting
critique(doc).labelCollisions === 0 in a test catches a diagram going
unreadable in a way no snapshot hash will.
Let it pick the camera
The hero preset frames anything acceptably and nothing perfectly, because the right angle is a property of the diagram: a system laid out along one axis lands diagonally, fills half its frame, and hides its own clients behind other parts.
const { pose, critique } = suggestPose(doc)
renderDocument(doc, { pose, width: 2000 })
Sweeps a ring of cameras, scores each with the same ruler critique uses, and
returns the best — faults first (a hidden part, a clipped label), then framing,
then a preference for staying near the house angle. It builds the scene once and
re-aims, so 48 candidates cost about 400 ms rather than 48 full renders.
It optimises what it can measure. It has no notion of a part having a front, so it will happily choose a camera behind the client monitor if the numbers come out level — which is why ties break toward the hero azimuth.
Three ways to show more than one moment
await renderSheet(doc)                                  // four azimuths, captioned
await renderStory(doc, { ...turntable(), frames: 6 })   // a camera move, as stills
await renderDiff(before, after)                         // side by side, changes lit
Each returns a PNG data URL. renderDiff emphasises only what changed
semantically — added, removed, re-labelled, re-stated. Movement is reported in
the caption but deliberately not lit: inserting one node re-runs the layout and
shifts most of the rest, and highlighting all of them highlights nothing.
diffDocs(a, b) is the same comparison without the render, and is pure — useful
in a commit hook.
Keyboard
| | |
|---|---|
| Place | drag from the palette, snaps to 0.5u, Alt frees the snap |
| Select | click a part, connector or boundary; Shift+click to extend |
| Move | drag — one gesture is one undo step |
| Rotate | drag the ring, or [ / ]; snaps to 15°, Alt frees it |
| Group | Ctrl+G, Ctrl+Shift+G to ungroup; boundaries nest |
| Connect | hover for anchors, drag an anchor onto another part or onto a boundary |
| Play a trace | pick one in the strip along the bottom, then scrub or play |
| Delete / duplicate | Del · Ctrl+D |
| Undo / redo | Ctrl+Z · Ctrl+Shift+Z or Ctrl+Y |
| Views | Hero · Iso · Top · F to fit |
Contributing
Source, design notes and the full engineering record: https://github.com/SatyadipPaul/isoform.