
@schedulespark/observability
v0.0.2-beta-1-0-1
Published
Self-hosted, Sentry-style error tracking and dashboard that stores captured events in your own Postgres database.

Maintainers
 mstephenn
Readme
@schedulespark/observability
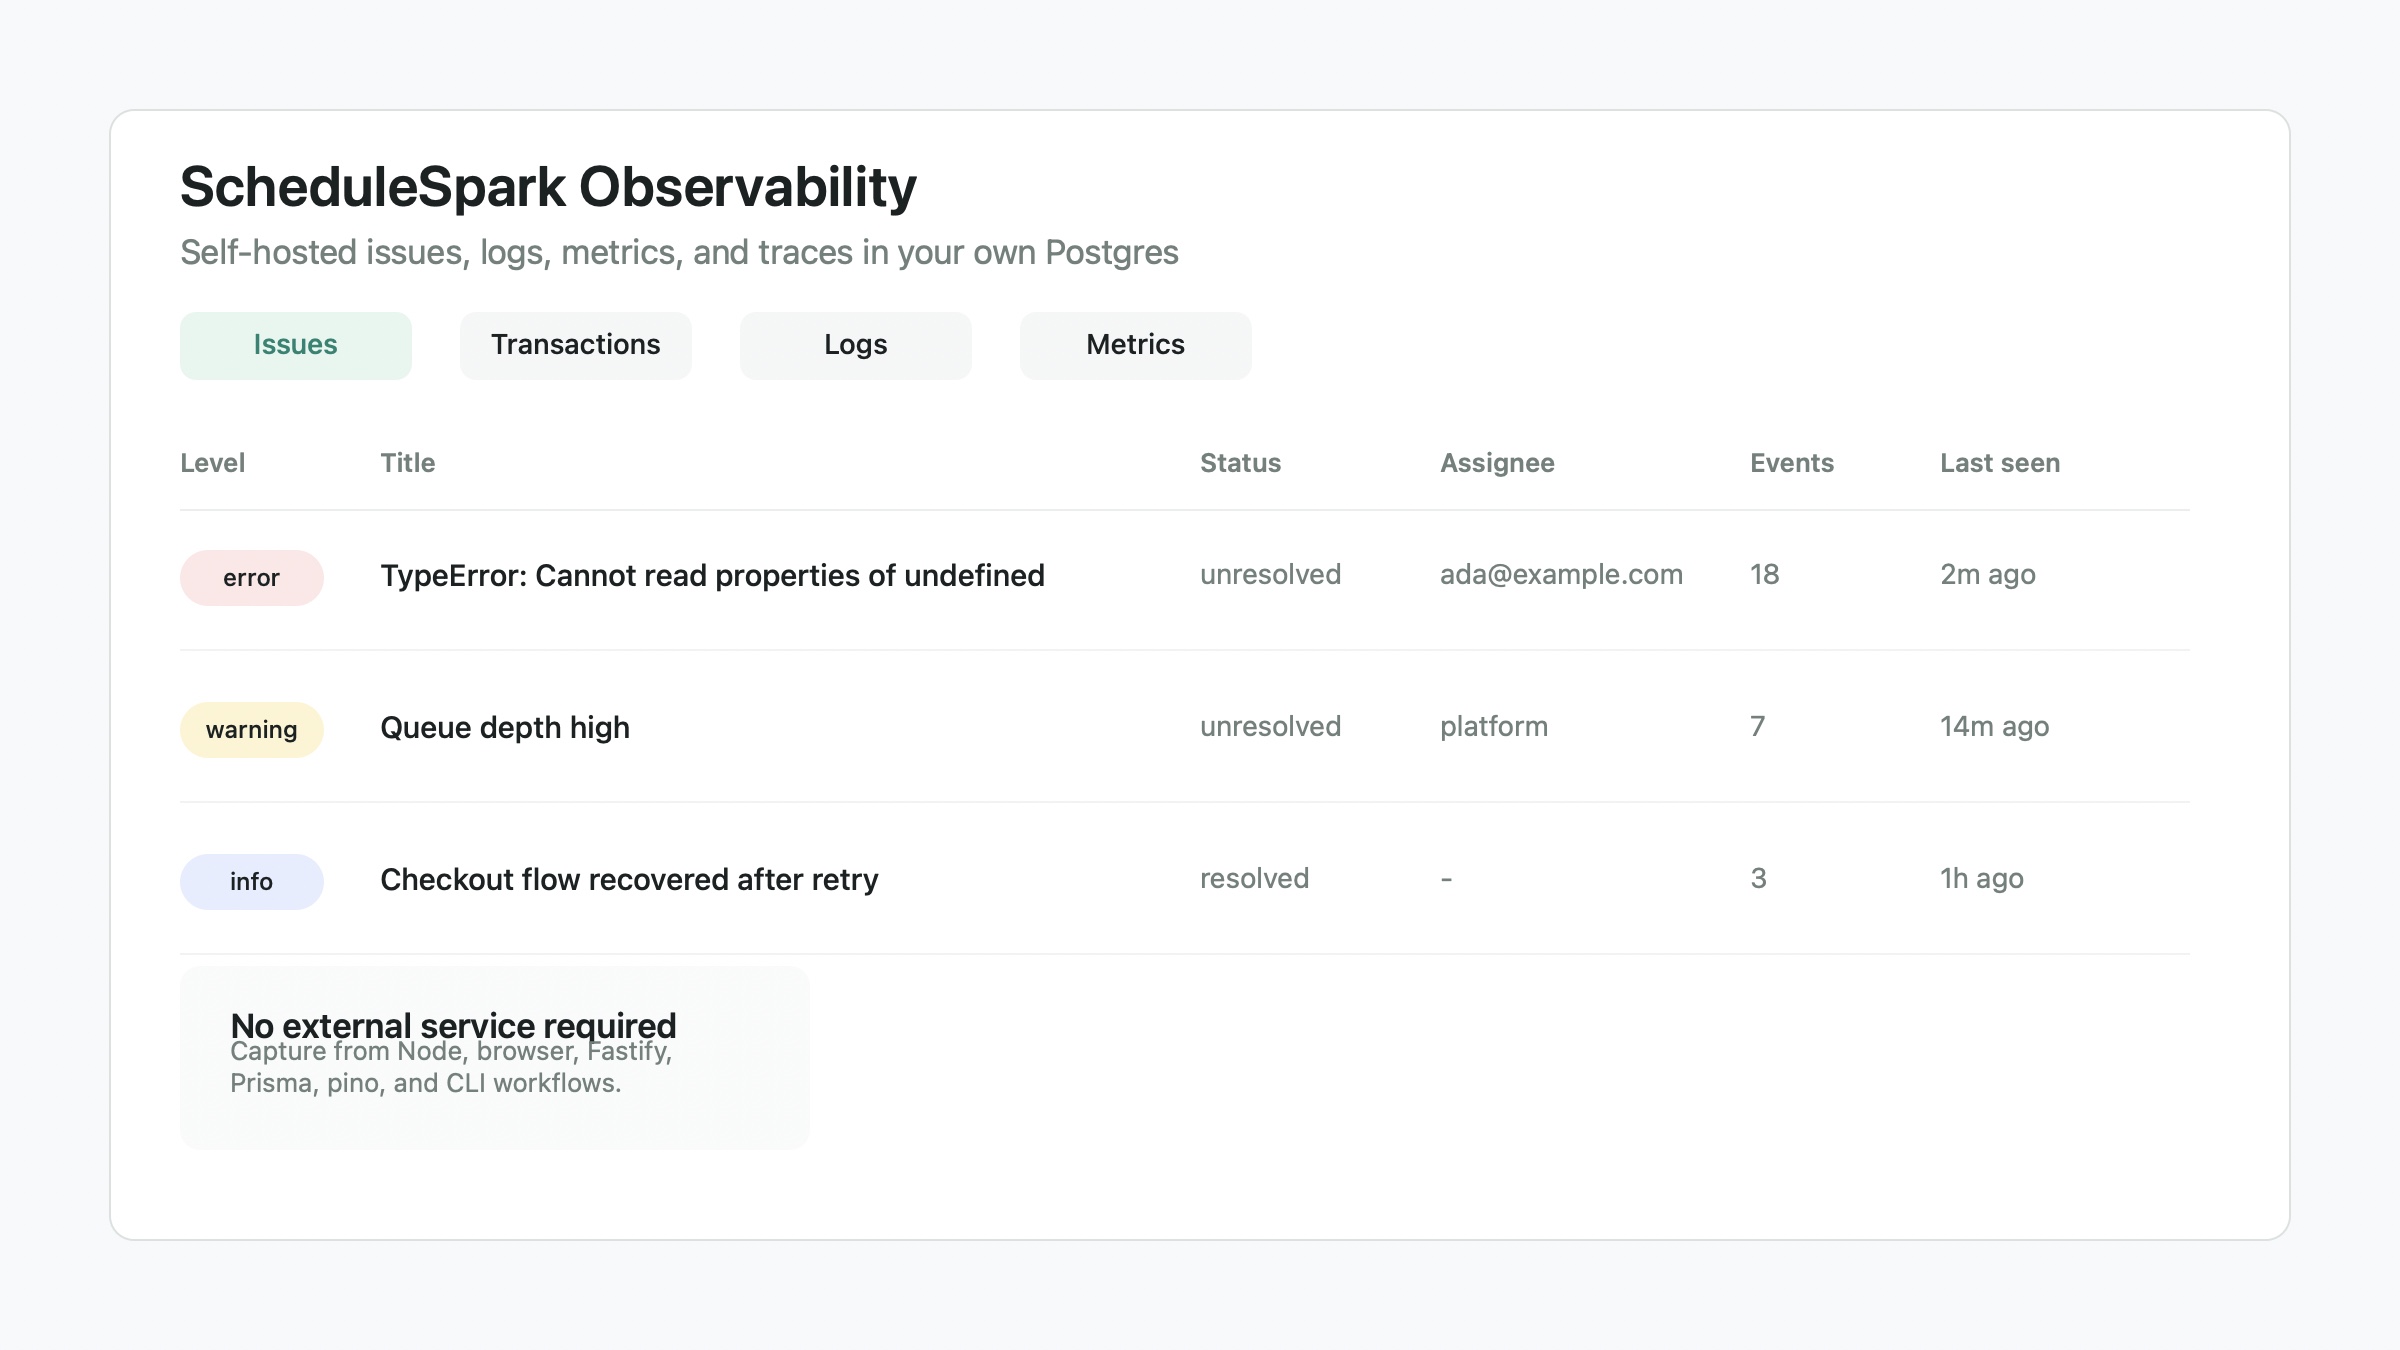
A self-hosted, Sentry-style error tracking and dashboard package. You bring your own Postgres connection string; it owns a dedicated schema inside that database and never phones home.
Full documentation: https://docs.schedulespark.com/docs/observability
Screenshot
Quickstart
The smallest possible setup — capture errors in a Node/Fastify app and view them at
/observability inside that same app:
import { init, captureFastifyErrors } from "@schedulespark/observability/node";
import { createDashboard, registerDashboard } from "@schedulespark/observability/dashboard";
import { initStorage } from "@schedulespark/observability/storage";

const client = init({ connectionString: process.env.OBSERVABILITY_DATABASE_URL! });
captureFastifyErrors(app, client);

const storage = await initStorage({ connectionString: process.env.OBSERVABILITY_DATABASE_URL! });
registerDashboard(app, createDashboard(storage), { prefix: "/observability" });
That's it — no separate service to deploy, no external database to provision beyond the one you already have. Everything below (tRPC, alerts, retention, standalone mode, access control) is opt-in on top of this. See docs/standalone-example.md for the same walkthrough framed as a service outside this monorepo.
Node SDK
import { init, captureFastifyErrors } from "@schedulespark/observability/node";

const client = init({
  connectionString: process.env.OBSERVABILITY_DATABASE_URL!,
  environment: process.env.NODE_ENV,
  // Optional: also reports crashes outside request handling (startup, a cron job, a
  // background task). Node stops auto-exiting on uncaught exceptions once a listener
  // is attached, so this captures, flushes, then exits — preserving the normal
  // crash-on-uncaught-exception behavior instead of leaving the process running.
  captureUncaughtExceptions: true
});

captureFastifyErrors(app, client); // auto-captures request-lifecycle errors
client.captureException(new Error("manual capture"));
If you're using tRPC, captureFastifyErrors alone won't see procedure errors — tRPC's
Fastify adapter formats them itself before they'd reach Fastify's onError hook. Wire
trpcOptions.onError too, filtering to unexpected failures so expected business-logic
errors (NOT_FOUND, UNAUTHORIZED, etc.) don't flood the dashboard:
app.register(fastifyTRPCPlugin, {
  trpcOptions: {
    router: appRouter,
    createContext,
    onError({ error, path }) {
      if (error.code === "INTERNAL_SERVER_ERROR") {
        client.captureException(error.cause ?? error, { route: path });
      }
    }
  }
});
Dashboard
Mount it inside your own server ("same portal"):
import { createDashboard, registerDashboard } from "@schedulespark/observability/dashboard";
import { initStorage } from "@schedulespark/observability/storage";

const storage = await initStorage({ connectionString: process.env.OBSERVABILITY_DATABASE_URL! });
registerDashboard(app, createDashboard(storage), {
  prefix: "/observability",
  authorize: (request) => isMyExistingAdminSession(request),
  // Optional: requires "Authorization: Bearer <key>" on POST /ingest. Without it, the
  // endpoint accepts unauthenticated writes — fine for a same-origin dogfood setup,
  // worth setting once other services or public clients can reach it.
  ingestKey: process.env.OBSERVABILITY_INGEST_KEY
});
...or run it as a standalone server ("separate page"):
npx @schedulespark/observability serve --db "$OBSERVABILITY_DATABASE_URL" --port 4318 \
  --token "$OBSERVABILITY_TOKEN" --ingest-key "$OBSERVABILITY_INGEST_KEY"
Each issue's detail page supports assigning it to someone (free-text, no user
directory built in) and a comment thread, and the issues list has a search box
(?q= — case-insensitive substring match on the title), a ?status= filter, and,
once more than one project exists, a ?project= filter. All available
programmatically too: assignIssue, addComment, listComments from
@schedulespark/observability/storage, and listIssues(storage, { q, status, projectId }).
Any combination of those filters can be saved under a name ("Save this search…" on
the issues list) and reapplied later — a saved view is just a link to
{prefix}?q=&status=&project= built from the stored filters, shared across everyone
with dashboard access (no per-user scoping, matching the rest of the dashboard).
Programmatically: createSavedView, listSavedViews, deleteSavedView from
@schedulespark/observability/storage.
Browser SDK
import { init } from "@schedulespark/observability/browser";

init({
  ingestUrl: "https://your-app.example.com/observability/ingest",
  apiKey: "..." // matches the dashboard's ingestKey, sent as "Authorization: Bearer <apiKey>"
});
// window.onerror / unhandledrejection are captured automatically
Like a Sentry DSN, an ingest key shipped in browser JS is inherently public — it deters casual spam/abuse, not a determined attacker. Rate limiting is tracked for a later phase.
Breadcrumbs
A rolling buffer (last 25, oldest dropped) of recent actions attached to the next captured error or message — snapshotted, not cleared, so a burst of related errors keeps overlapping context:
client.addBreadcrumb({ category: "nav", message: "loaded /dashboard" });
client.addBreadcrumb({ category: "db", message: "SELECT shifts", data: { rows: 12 } });
client.captureException(new Error("boom")); // both breadcrumbs are attached
The browser SDK auto-records a "fetch" breadcrumb for every request (its own
ingestion POSTs excluded) unless you pass autoBreadcrumbs: false to init().
Breadcrumb data is redacted the same way context is — secret-looking keys
(password, token, authorization, ...) never reach storage.
Source maps
Minified browser stack traces are hard to read. Build with sourcemap: true (Vite:
build.sourcemap), then resolve a stack trace's frames back to original source:
npx @schedulespark/observability sourcemap --maps ./dist/assets --stack-file trace.txt
# or fetch the latest event straight from an issue:
npx @schedulespark/observability sourcemap --maps ./dist/assets --issue <id> --db "$OBSERVABILITY_DATABASE_URL"
CLI-only for now — there's no dashboard-side automatic resolution (that needs a
release-to-map mapping this package doesn't have yet), and no source-map upload
endpoint; run it locally or as a CI step, keeping .map files wherever your build
already produces them.
Tracing
One level of nesting — a transaction and its direct spans, no grandchildren:
const tx = client.startTransaction("shift.create", { route: "shift.create" });
const span = tx.startSpan("db.query");
// ... do the work ...
span.finish("ok");
tx.finish("ok");
Finished transactions are queued and flushed the same fire-and-forget way events are.
View them at {prefix}/transactions in the dashboard (name/status/duration/timestamp;
no drill-down page yet).
Prisma query instrumentation
Optional — wraps a Prisma client with a $extends query extension that records a
"db" breadcrumb for every query, plus a child span for slow (≥100ms by default) or
failed queries when a transaction is supplied:
import { instrumentPrismaClient } from "@schedulespark/observability/node";

const instrumentedPrisma = instrumentPrismaClient(prisma, {
  getActiveTransaction: () => currentTransaction, // however your app tracks it
  addBreadcrumb: client.addBreadcrumb
});
@prisma/client is an optional peer dependency — this package never imports it
directly, so it isn't required unless you use this function. instrumentPrismaClient
returns a new client (Prisma extensions can't mutate one in place); use the
returned value, not the original. There's no automatic request-scoped context
propagation here (no AsyncLocalStorage) — you're responsible for tracking "the
active transaction" yourself via getActiveTransaction; breadcrumbs are recorded for
every query regardless.
Multi-project support
A single self-hosted instance can serve more than one app/service, each with its own
API key. A fresh install needs none of this — every schema already has an
auto-created "default" project, and everything above behaves identically with zero
configuration.
npx @schedulespark/observability projects create --db "$OBSERVABILITY_DATABASE_URL" --name "Mobile app"
npx @schedulespark/observability projects list --db "$OBSERVABILITY_DATABASE_URL"
Give a Node SDK client its own project so its captures are tagged accordingly:
const client = init({ connectionString: process.env.OBSERVABILITY_DATABASE_URL!, project: "mobile-app" });For HTTP ingestion (the browser SDK, or any other client), send the project's own API
key as the ingest request's bearer token — the same Authorization: Bearer <key>
header the browser SDK's apiKey option already sends. It's resolved independently of
the dashboard's optional ingestKey gate: ingestKey, when set, still authenticates
every request the same way it always has; the bearer token is separately looked up
against each project's API key to decide which project the event belongs to, falling
back to "default" when it doesn't match one. The issues list also gains a ?project=
filter (a dropdown once more than one project exists).
Structured logs
A dedicated logs table, separate from events/issues — log lines don't share the
"same bug, many occurrences" fingerprint-grouping semantics errors do. Forward pino
logs into it with createPinoLogStream, a plain Writable usable as pino's
destination:
import pino from "pino";
import { createPinoLogStream } from "@schedulespark/observability/node";

const stream = createPinoLogStream(storage, { minLevel: "warn" }); // default "warn"
const logger = pino(stream);
Only lines at/above minLevel are forwarded ("trace" | "debug" | "info" | "warn" |
"error" | "fatal", pino's own level names) — call stream.end() to flush any
buffered lines before shutdown, the same way ObservabilityClient.close() does for
other captures. View them at {prefix}/logs, filterable by ?level=.
Logs are typically much higher-volume than errors, so they get their own retention
window (default 14 days vs. pruneEvents's 90):
npx @schedulespark/observability prune --db "$OBSERVABILITY_DATABASE_URL" --logs-older-than-days 14Metrics
StatsD-shaped counters/gauges/histograms, via client.metrics:
client.metrics.increment("shift.create.count", 1, { route: "shift.create" }); // value defaults to 1
client.metrics.gauge("queue.depth", 42);
client.metrics.histogram("request.duration_ms", 120, { route: "shift.create" });
Raw points land in a metric_points_raw table. Since nothing prunes it automatically,
schedule a rollup job (a daily/hourly cron job, Render cron service, etc.) to aggregate
raw points into hourly/daily buckets and prune old raw points in one step:
npx @schedulespark/observability rollup --db "$OBSERVABILITY_DATABASE_URL" --raw-older-than-days 3Or programmatically: rollupMetrics(storage, { rawRetentionDays: 3 }) from
@schedulespark/observability/storage. Rollups are a full replace (not additive) of
each bucket's sum/count/min/max from the current raw data, so rerunning the job
is always safe — it never double-counts a point already rolled up in a previous run.
Histogram buckets store sum/count/min/max/avg only, not true percentiles — a
sketch algorithm (t-digest, etc.) is real complexity not justified for the current
table-view-only dashboard.
View the latest bucket per metric at {basePath}/metrics, filterable by ?bucket=hour
or ?bucket=day. Keep tags to bounded-cardinality dimensions (e.g. route,
statusCode); a free-form value like a user ID or request ID directly multiplies row
count in both the raw and rollup tables.
Alerts
Three kinds of alerts, each delivered to the same channels:
new_issue— the first time a fingerprint is ever seen.regression— aresolvedissue gets a new event; it's automatically reopened (statusflips back tounresolved) and flagged distinctly from a brand-new issue.ignoredissues are left alone — that status means "don't tell me about this," not "this is fixed."spike— the error rate over a rolling window crosses a threshold. Checked in-memory on an interval per process/instance (no shared state across instances), with a cooldown of one window's length between repeat notifications.
Repeat occurrences of an already-unresolved issue notify nothing. Works the same whether the event arrived via the Node SDK or the HTTP ingestion endpoint:
import { emailChannel, slackWebhookChannel, webhookChannel } from "@schedulespark/observability/alerts";

const channels = [
  slackWebhookChannel(process.env.SLACK_WEBHOOK_URL!, { dashboardUrl: "https://your-app.example.com/observability" }),
  webhookChannel("https://your-app.example.com/internal/observability-hook"),
  emailChannel({
    to: ["[email protected]"],
    from: "[email protected]",
    transport: { host: "smtp.example.com", port: 587, auth: { user: "...", pass: "..." } },
    dashboardUrl: "https://your-app.example.com/observability"
  })
];

init({ connectionString, channels }); // Node SDK
createDashboard(storage, { channels }); // HTTP ingestion path
emailChannel sends over plain SMTP via nodemailer — not tied to any mail vendor —
so transport accepts either connection options or a custom nodemailer Transport.
The CLI's serve command supports the same via flags or environment variables:
npx @schedulespark/observability serve --db "$OBSERVABILITY_DATABASE_URL" \
  --slack-webhook "$OBSERVABILITY_SLACK_WEBHOOK_URL" --webhook "$OBSERVABILITY_WEBHOOK_URL"
A failing channel is logged and skipped — it never blocks event capture or other channels.
Enable spike detection via the Node SDK (defaults: 20 errors in 5 minutes, checked every 60 seconds):
init({ connectionString, channels, spikeMonitor: {} });
// or tune it: spikeMonitor: { thresholdCount: 50, windowMinutes: 10 }
Production migrations
Run migrations explicitly during deploy instead of relying on the SDK's implicit
on-init() migration:
npx @schedulespark/observability migrate --db "$OBSERVABILITY_DATABASE_URL"Retention
The events table grows without bound otherwise — nothing prunes it automatically,
since this writes into your own database. Schedule this (a daily cron job, Render cron
service, etc.) to delete event detail older than a retention window; issues and their
aggregate counts are kept, only the individual event rows are dropped:
npx @schedulespark/observability prune --db "$OBSERVABILITY_DATABASE_URL" --older-than-days 90Or programmatically: pruneEvents(storage, 90) from @schedulespark/observability/storage
(and pruneLogs(storage, 14) for the separate, shorter-retention logs table — the
same CLI prune command handles both, see Structured logs).
If you'd rather not run a separate CLI process, expose an internal HTTP endpoint on
your existing server and point a cron job at it instead — that's how apps/api in
this repo does it (POST /internal/prune-observability, guarded by a shared secret
header, called daily by a Render cron job).
Status
Phase 1 (MVP) plus alerting, retention, the browser SDK, basic tracing,
multi-project support, breadcrumbs, an SMTP alert channel, optional Prisma query
instrumentation, source-map resolution, saved views, structured log ingestion, and a
metrics API (ingestion, rollups, and a dashboard view) are built and dogfooded on this
repo's own apps/api/apps/web. See SECURITY_REVIEW.md for a
point-in-time audit of the ingestion/storage attack surface. See the repo's
observability platform plan for the remaining roadmap (public OSS release).
This package is part of the public ScheduleSpark npm package set. It is designed to be installed as a self-hosted observability layer inside an existing Node/Fastify service or run as a standalone dashboard process.
License
MIT — see LICENSE.