
@shinjinseop/page-dep-map
v1.0.0
Published
Frontend page dependency analyzer — CLI & dashboard for React/Next.js codebases
Maintainers
 shinjinseop
Readme
page-dep-map
React/Next.js codebase analyzer for page-level complexity, dependency structure, prop flow, and component relationships.
page-dep-map statically analyzes React pages, writes JSON results, generates dependency reports, and serves an interactive dashboard for code review and refactoring decisions.
What It Is For
Use this when you want to answer questions like:
- Which pages are structurally risky?
- Which page is acting as a data orchestrator?
- Where are props being drilled too deeply?
- Which components are hidden under a page-level child component?
- Which pages have many effects, queries, store usages, conditions, or shared dependencies?
- What should be reviewed first before refactoring?
This project currently targets React-family frontend applications. NestJS, ExpressJS, and backend dependency graphs should be implemented as separate presets later.
Supported React Targets
The analyzer is designed for:
- Vite React
- CRA / plain React
- Next.js Pages Router
- Next.js App Router
- React Router based SPAs
- TanStack Router style
routesdirectories - Monorepo app packages such as
apps/web,apps/dashboard - TypeScript path aliases through
tsconfig.json - Common page directories:
appsrc/apppagessrc/pagesroutessrc/routes
Current stable page discovery is pattern-based. For best results, provide pagePatterns in page-dep-map.config.json or page-dep-map.config.ts.
Install
For npm package usage:
npm install -D @shinjinseop/page-dep-map
# or
pnpm add -D @shinjinseop/page-dep-map
or run directly without installing:
npx @shinjinseop/page-dep-map run .After install, the binary is exposed as page-dep-map (unscoped), so:
page-dep-map run .For this monorepo while developing locally:
pnpm install
pnpm build
node packages/cli/dist/index.js run fixtures/app-router-project
Quick Start
Analyze a React app and open the dashboard:
page-dep-map run .Analyze a specific app inside a monorepo:
page-dep-map run apps/webGenerate the dashboard plus dependency reports:
page-dep-map run apps/web --reportUse a config file and custom output directory:
page-dep-map run apps/web \
  --config page-dep-map.config.json \
  --output page-dep-map-output \
  --report \
  --report-output page-dep-map-reports
The dashboard defaults to:
http://localhost:3399Commands
run
Analyze a project and start the dashboard server.
page-dep-map run [dir]Options:
--output <dir>          Analysis output directory, default: ./page-dep-map-output
--config <path>         Config file path
--port <number>         Dashboard port, default: 3399
--report                Also generate dependency reports
--report-output <dir>   Dependency report output directory, default: ./page-dep-map-reports
--no-open               Do not open the browser automatically
Example:
page-dep-map run apps/dashboard --output page-dep-map-output-dashboard --report --report-output page-dep-map-reportsanalyze
Generate JSON analysis results only.
page-dep-map analyze <dir> --output page-dep-map-outputreport
Generate dependency map reports only.
page-dep-map report <dir> --output page-dep-map-reportsThis writes:
page-dep-map-reports/pages-deps-report.json
page-dep-map-reports/interactive-dependency-map.html
page-dep-map-reports/full-dependency-graph.svg
serve
Serve an existing analysis output directory.
page-dep-map serve page-dep-map-output --port 3399Monorepo Usage
For a repository with multiple apps, keep separate outputs so results do not overwrite each other.
{
  "scripts": {
    "page-map:web": "page-dep-map run apps/web --config page-dep-map.config.json --output page-dep-map-output --report --report-output page-dep-map-reports",
    "page-map:dashboard": "page-dep-map run apps/dashboard --config page-dep-map.config.json --output page-dep-map-output-dashboard --report --report-output page-dep-map-reports",
    "page-map:dashboard:analyze": "page-dep-map analyze apps/dashboard --config page-dep-map.config.json --output page-dep-map-output-dashboard",
    "page-map:dashboard:serve": "page-dep-map serve page-dep-map-output-dashboard"
  }
}
Recommended .gitignore entries:
page-dep-map-output/
page-dep-map-output-dashboard/
page-dep-map-reports/
Configuration
Create page-dep-map.config.json:
{
  "pagePatterns": [
    "src/pages/**/*.tsx",
    "src/app/**/page.tsx",
    "src/routes/**/*.tsx"
  ],
  "excludePatterns": [
    "**/_app.*",
    "**/_document.*",
    "**/_error.*",
    "**/404.*",
    "**/api/**",
    "**/*.test.*",
    "**/*.spec.*",
    "**/*.stories.*",
    "**/__tests__/**",
    "**/__mocks__/**"
  ],
  "tsConfigPath": "tsconfig.json",
  "output": {
    "dir": "./page-dep-map-output"
  },
  "dashboard": {
    "port": 3399,
    "open": true
  }
}
Or use page-dep-map.config.ts for regex-based analyzer settings:
import type { PageDepMapConfig } from 'page-dep-map';

export default {
  pagePatterns: [
    'src/pages/**/*.tsx',
    'src/app/**/page.tsx',
    'src/routes/**/*.tsx',
  ],
  excludePatterns: [
    '**/_app.*',
    '**/_document.*',
    '**/_error.*',
    '**/404.*',
    '**/api/**',
    '**/*.test.*',
    '**/*.spec.*',
    '**/*.stories.*',
  ],
  tsConfigPath: 'tsconfig.json',
  analysis: {
    maxTraceDepth: 5,
    storePatterns: [/^use\w+Store$/, /^useAtom$/, /^useSelector$/, /^useDispatch$/],
    queryPatterns: [/^useQuery$/, /^useSuspenseQuery$/, /^useInfiniteQuery$/, /^use\w+Query$/],
  },
  scoring: {
    weights: {
      effectCount: 3,
      maxDrillingDepth: 3,
      passThroughPropsCount: 3,
      queryCount: 2,
    },
    thresholds: {
      moderate: 20,
      warning: 40,
      critical: 60,
    },
  },
  output: {
    dir: './page-dep-map-output',
  },
  dashboard: {
    port: 3399,
    open: true,
  },
} satisfies PageDepMapConfig;
Output Files
Analysis output:
page-dep-map-output/
  project-summary.json
  pages/
    <page-name>.json
Report output:
page-dep-map-reports/
  pages-deps-report.json
  interactive-dependency-map.html
  full-dependency-graph.svg
pages-deps-report.json is also used by the dashboard to make child component chips clickable and to render nested component dependency modals.
Dashboard
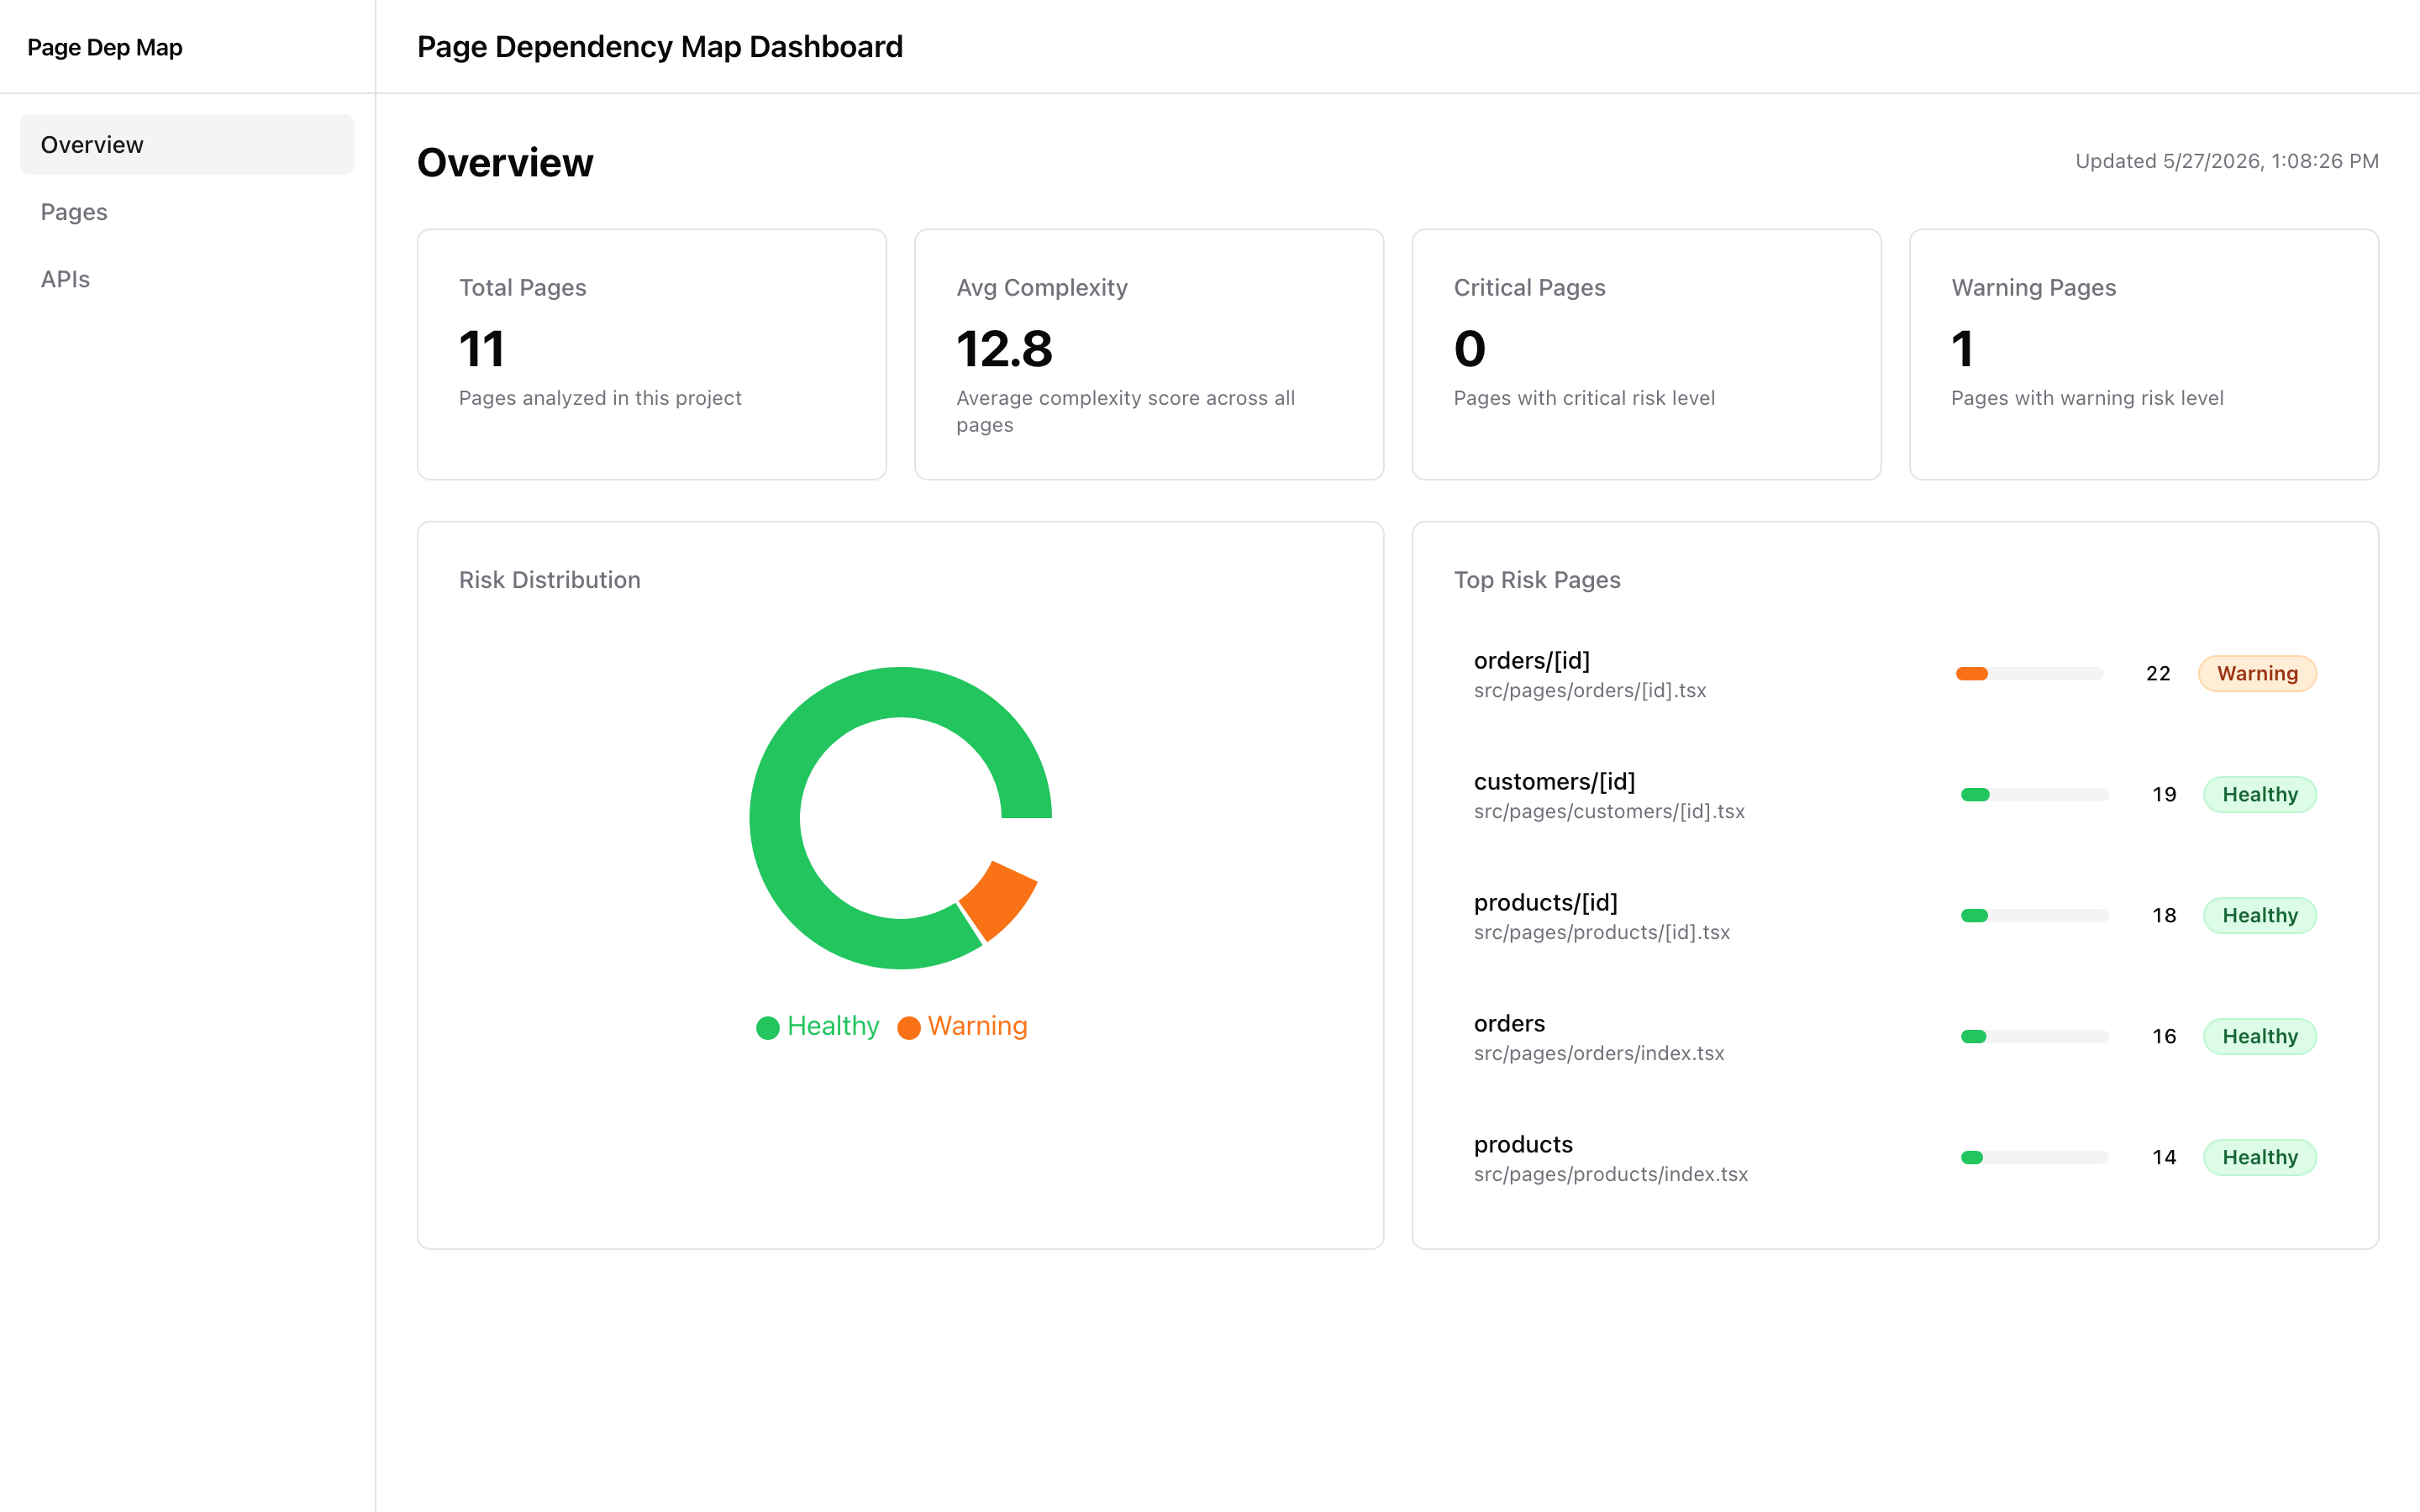
Overview
- Total page count
- Average score
- Warning and critical page counts
- Risk distribution
- Top risk pages
Page List
- Searchable page table
- Sortable score, risk, props, hooks, depth, and child count columns
- Risk filter
- Row click navigation into page detail
Page Detail
The detail page is optimized for triage:
- Hero section with score, risk badge, score bar, and top score contributors
- Likely issues near the top
- Issue metric chips linking directly to the metric cards
- Sticky section navigation on desktop
- Direct props table
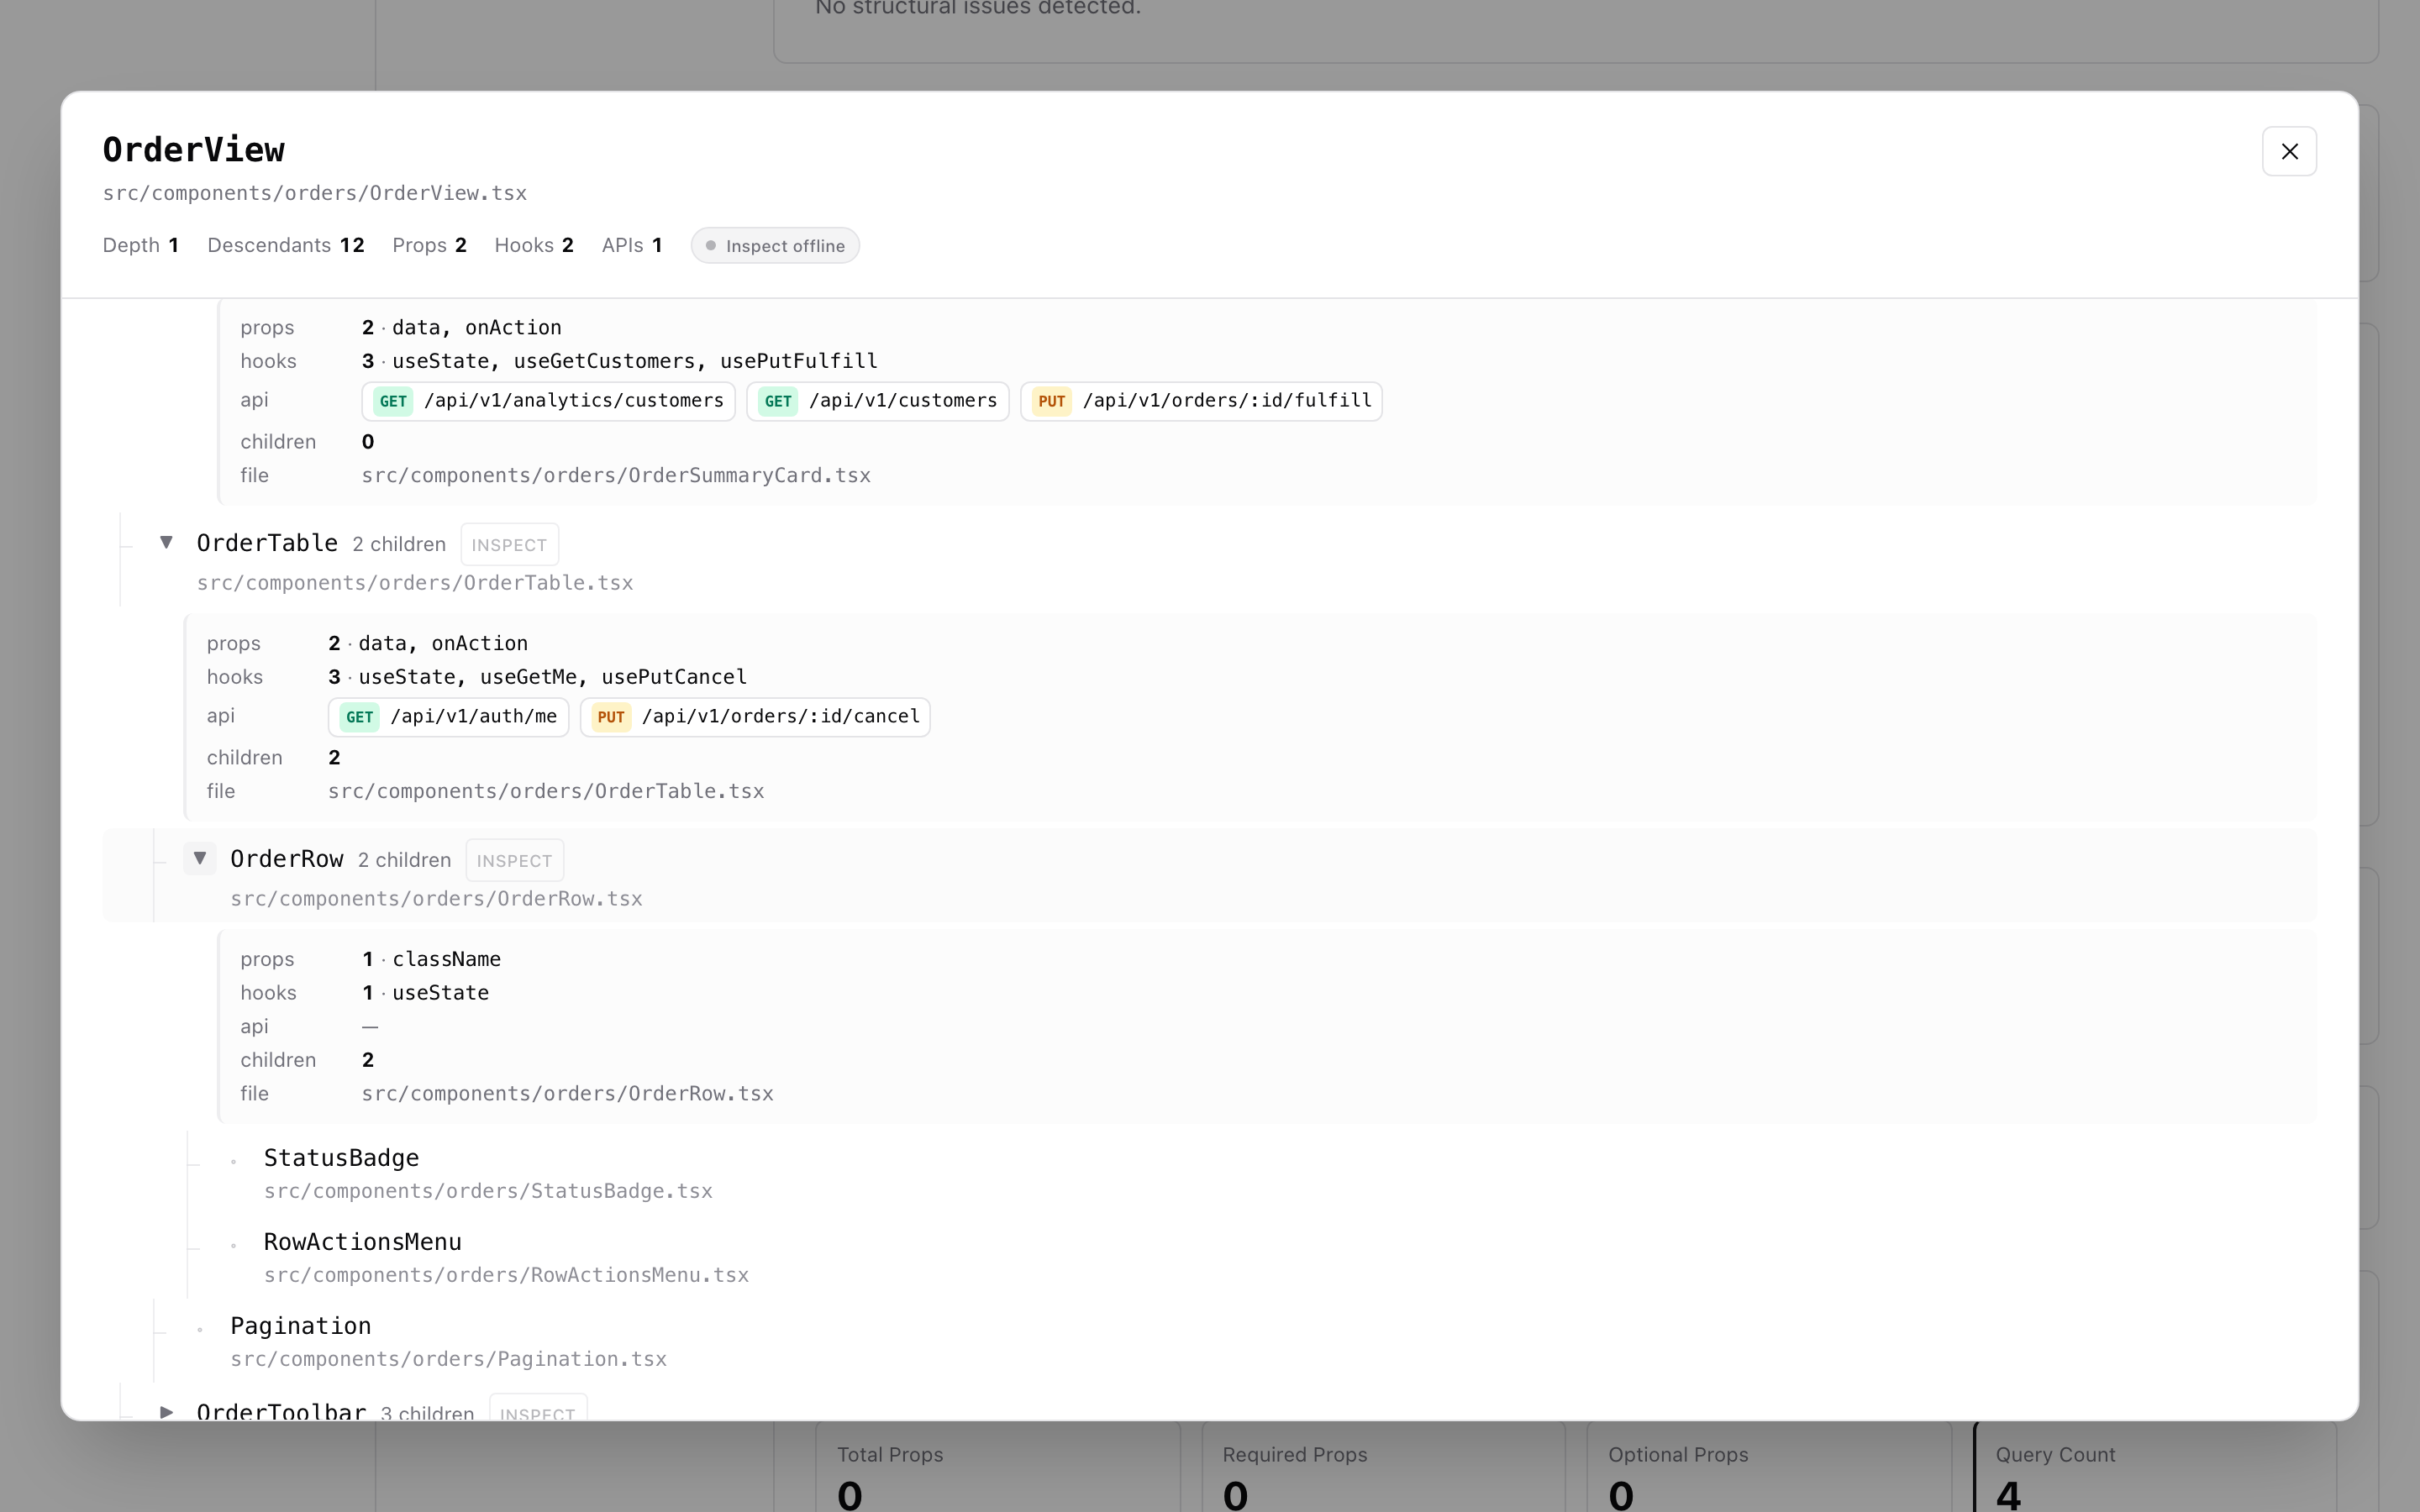
- Dependencies section with hooks, queries, stores, contexts, shared modules, and child components
- Clickable child component chips when dependency report data is available
- Component Dependency Map modal for nested child component structure
- Prop flow and deepest prop path sections
- Metrics card grid with anchor IDs such as
#metric-effectCount
APIs (new in 0.2)
A reverse index of every HTTP call site discovered in the project, keyed
by METHOD /path. Answers the question "if I change this endpoint, what
breaks on the frontend?".
The list view shows each endpoint with:
- Impact badge (
critical/high/medium/low) computed from the consumer chain + page-risk overlay — single colored pill that triages change risk at a glance. - Tier (
reached/orphan) — orphans are detected in source but unreached from any page, surfacing dead-code candidates. - Direct and Consumers counts — 1-hop wrappers vs the full transitive chain.
- Sortable headers, filter by impact / tier / HTTP method, free-text path search.
Clicking an endpoint opens a detail view organized by role:
- Direct callers — the immediate wrapper (typically a
useQuery/useMutationhook). - Intermediate hooks — additional hook layers between the wrapper and the first component.
- Used in component — the React component that actually invokes the hook in its body.
- Render path (collapsed by default) — parent components that include the active one in their JSX tree.
- Pages — entry-point pages whose render tree includes this endpoint.
Detection covers fetch, axios, ky, ofetch, useSWR,
useQuery({queryFn}), useMutation({mutationFn: foo}), template-literal
URLs (`${PREFIX}/${id}`), process.env.X base URLs,
axios.create() result variables auto-registered as wrapped clients,
re-exports (export { foo } from './bar'), default exports under any
local binding name, and object-literal wrappers
(export const userApi = { getById: ... } then userApi.getById()).
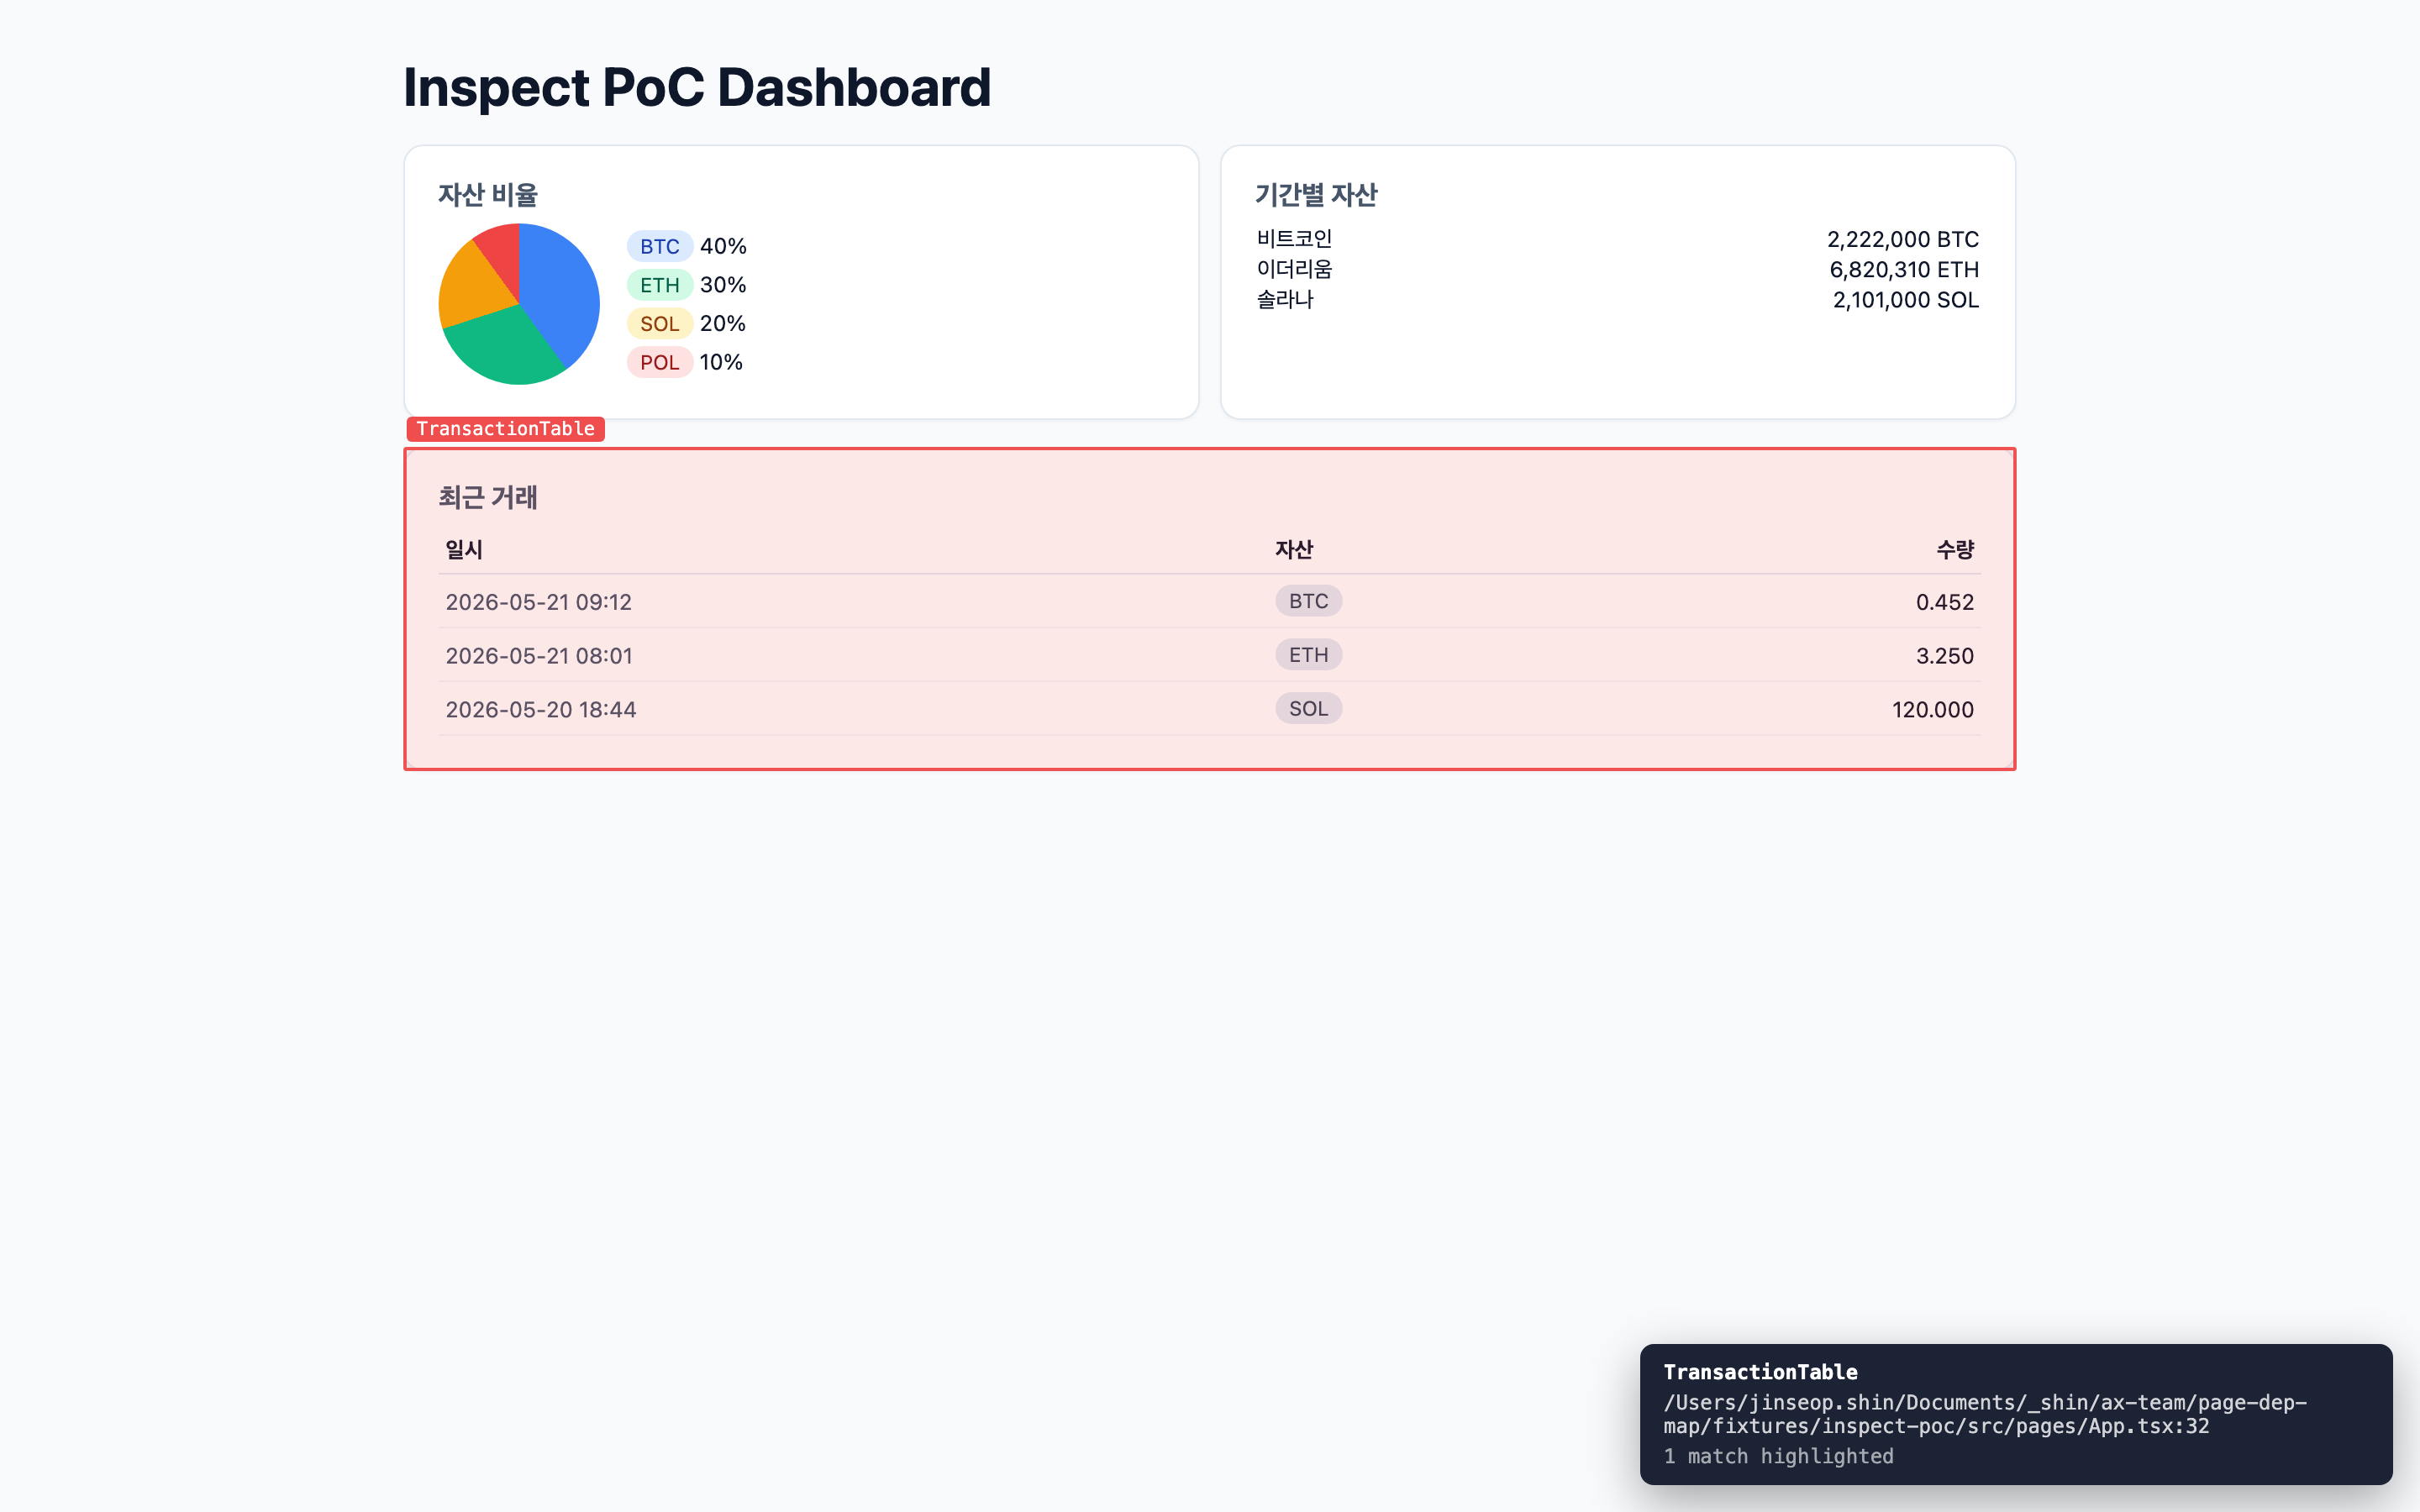
Live Component Inspect
⚡ Bridge the dashboard with your running dev app. Click a component in the dashboard subtree modal and it lights up on the page in real time.
⚡ 대시보드와 실행 중인 dev 앱을 양방향으로 연결합니다. 대시보드의 서브트리 모달에서 컴포넌트를 클릭하면 실제 화면의 해당 영역이 즉시 빨간 박스로 표시됩니다.
How it works / 동작 방식
EN. The dashboard ships an inspect button next to every parent component
in the subtree modal. Clicking it sends a focus message through the CLI
server's SSE broker (/api/inspect/stream + /api/inspect/send). A small
helper script — injected into your host app by
@shinjinseop/page-dep-map-vite-plugin
during dev — walks the React fiber tree to find the component instance and
draws a red overlay over it. Communication goes through HTTP so dashboard
(port 3399) and host app (port 3000) can be on different origins.
KO. 대시보드는 서브트리 모달의 각 부모 컴포넌트 옆에 inspect 버튼을
표시합니다. 클릭하면 CLI 서버의 SSE 브로커
(/api/inspect/stream + /api/inspect/send) 를 통해 focus 메시지가
전송되고, dev 앱에 주입된 helper 스크립트가 React fiber 트리를 탐색해
해당 컴포넌트 인스턴스 위에 빨간 오버레이를 그립니다. HTTP 기반이라
대시보드(3399)와 앱(3000)이 서로 다른 origin이어도 통신이 됩니다.
Install both packages / 두 패키지 모두 설치
npm install -D @shinjinseop/page-dep-map @shinjinseop/page-dep-map-vite-plugin
# or
pnpm add -D @shinjinseop/page-dep-map @shinjinseop/page-dep-map-vite-plugin
The CLI alone gives you analysis + dashboard. The Vite plugin is what lets the dashboard reach into a running app to highlight components — install both if you want the live inspect feature.
CLI 단독으로도 분석 + 대시보드는 동작합니다. 실행 중인 앱에서 컴포넌트 를 실시간으로 하이라이트하려면 두 패키지를 모두 설치하세요.
Configure Vite / Vite 설정
vite.config.ts of your host React app:
import { defineConfig } from 'vite';
import react from '@vitejs/plugin-react';
import pdmInspect from '@shinjinseop/page-dep-map-vite-plugin';

export default defineConfig({
  plugins: [
    react(),
    pdmInspect({
      // Dashboard URL — match the port you pass to `page-dep-map run`/`serve`.
      // 대시보드 URL — page-dep-map run/serve 에 넘기는 포트와 일치시켜 주세요.
      baseUrl: 'http://localhost:3399',
    }),
  ],
});
The plugin is dev-only by default and only injects the helper when Vite
runs in serve mode.
플러그인은 기본적으로 dev 전용이며 Vite가 serve 모드일 때만 helper를
주입합니다.
Two-terminal workflow / 두 터미널 워크플로우
# Terminal A — analysis + dashboard (port 3399)
# 터미널 A — 분석 + 대시보드 (포트 3399)
npx page-dep-map run .

# Terminal B — your normal dev server (port 3000, or whatever)
# 터미널 B — 평소 사용하는 dev 서버 (3000 등)
npm run dev
Open both URLs in the same browser. In the dashboard, navigate to a page detail, open the Child subtree modal, and click the red INSPECT button next to any parent component.
브라우저에서 두 URL을 모두 엽니다. 대시보드에서 페이지 상세로 이동해 Child subtree 모달을 연 뒤, 부모 컴포넌트 옆 빨간 INSPECT 버튼을 클릭하세요.
The host page instantly draws a red box around every instance of that component, with a tooltip showing the source file and line.
호스트 페이지에 즉시 해당 컴포넌트의 모든 인스턴스가 빨간 박스로 표시되며, 우하단 툴팁에 파일 경로와 라인 정보가 함께 나타납니다.
Inspect button visibility / Inspect 버튼 표시 규칙
- Shown for parent components (rows with the
▶expand chevron). External / library components and leaf primitives (Card, Button, etc.) are hidden to reduce visual noise. - 자식이 있는 부모 컴포넌트(▶ 펼치기 화살표가 있는 행)에만 표시 됩니다. 외부 라이브러리 컴포넌트와 leaf 프리미티브(Card, Button 등) 는 노이즈를 줄이기 위해 숨겨집니다.
Reverse direction: pick from the page / 역방향 — 페이지에서 컴포넌트 집기
While focused on the host page, press Alt + Shift + I to enter pick mode, then click any rendered element — the helper finds the nearest user component in the fiber owner chain and posts it back to the dashboard.
호스트 페이지에 포커스가 있는 상태에서 Alt + Shift + I 를 누르면 pick 모드가 켜집니다. 화면의 아무 요소나 클릭하면 helper가 가장 가까운 사용자 컴포넌트를 fiber owner chain에서 찾아 대시보드로 전송합니다.
What It Analyzes
For each page:
| Category | Metrics | | --- | --- | | Props | total, required, optional, type strings, spread detection | | Hooks | general hooks, effects, query hooks, store hooks, context hooks | | Dependencies | queries, stores, contexts, shared/common modules | | Prop Flow | drilling depth, pass-through props, deepest prop path | | Structure | child components, conditional branches, derived data props | | Score | weighted complexity score and risk level | | Issues | built-in structural issue rules | | Component Tree | imported child component dependency graph when reports are generated |
Score Breakdown
The score is a weighted sum of page metrics.
| Metric | Weight |
| --- | ---: |
| propsCount | 1 |
| requiredPropsCount | 1 |
| maxDrillingDepth | 3 |
| passThroughPropsCount | 3 |
| hookCount | 1 |
| queryCount | 2 |
| storeUsageCount | 2 |
| contextUsageCount | 2 |
| effectCount | 3 |
| conditionalBranchCount | 1 |
| childComponentCount | 1 |
| derivedDataPropCount | 2 |
| sharedDependencyCount | 1 |
Risk levels:
| Risk | Score | | --- | ---: | | healthy | 0-19 | | moderate | 20-39 | | warning | 40-59 | | critical | 60+ |
Built-in Issue Rules
| Rule ID | Trigger | Severity |
| --- | --- | --- |
| DRILL_DEEP | max drilling depth >= 3 | warning |
| PASS_THROUGH | pass-through props >= 2 | warning |
| EFFECT_HEAVY | effects >= 4 | warning |
| DATA_ORCHESTRATOR | queries >= 3 and child components >= 6 | critical |
| DERIVED_HEAVY | derived data props >= 2 | info |
| SHARED_HEAVY | shared dependencies >= 10 | info |
| MANY_PROPS | props >= 10 | warning |
| MANY_REQUIRED | required props >= 8 | warning |
| SPREAD_DETECTED | spread props used | info |
| MANY_CONDITIONS | conditions >= 8 | warning |
| EFFECT_NO_QUERY | effects >= 3 and queries = 0 | info |
| STORE_AND_PROPS | stores >= 2 and props >= 5 | info |
Child Component Dependency Map
Run with --report to enable nested component visibility in the dashboard:
page-dep-map run apps/dashboard --report --report-output page-dep-map-reportsThen open a page detail and click a child component chip. The modal shows:
- Root component
- Nested children
- Direct child count
- Component kind:
page,component, orexternal - File path
- Import source
- Circular reference markers when detected
This is useful for pages that only show a top-level child such as FundingAccounts, Account, or ActivityUser, but the actual implementation is split into many nested components.
Troubleshooting
Blank screen after refreshing /pages/<name>
Make sure the dashboard was built with absolute asset paths. In this repo the Vite config uses:
export default defineConfig({
  base: '/',
});
If you changed the dashboard build, rebuild the monorepo and restart the CLI server:
pnpm build
page-dep-map run apps/dashboard --report
Then hard-refresh the browser:
Cmd + Shift + RChild component chip is not clickable
The dashboard needs dependency report data. Run with --report:
page-dep-map run apps/web --report --report-output page-dep-map-reportsAlso confirm that the report file exists:
page-dep-map-reports/pages-deps-report.jsonPath aliases do not resolve
Set tsConfigPath in the config:
{
  "tsConfigPath": "tsconfig.json"
}
For monorepos, run the CLI with the app package as the target directory so the app-level tsconfig.json can be resolved:
page-dep-map run apps/dashboard --config page-dep-map.config.jsonPort is already in use
Use another port:
page-dep-map run apps/dashboard --port 3400Known Limitations
This tool uses heuristic static analysis. These patterns can reduce accuracy:
- Spread props such as
<Comp {...props} /> - Higher-order components such as
withAuth(Page) - Render props
- Highly dynamic component selection
- Dynamic imports with complex expressions
- Deep re-export chains
- Runtime route declarations that do not map to page files
- Component definitions hidden behind non-standard factory functions
The current backend presets for NestJS and ExpressJS are not implemented. They should use separate analyzer rules for controllers, routes, middleware, providers, services, and repositories.
Development
pnpm install
pnpm test
pnpm build
Run against a fixture:
node packages/cli/dist/index.js run fixtures/app-router-project --reportRun against an external app during local development:
page-dep-map run apps/dashboard \
  --config page-dep-map.config.json \
  --output page-dep-map-output-dashboard \
  --report \
  --report-output page-dep-map-reports
Tech Stack
- Analyzer: TypeScript + ts-morph + fast-glob
- Dashboard: React + Vite + TanStack Query/Table + Recharts + Tailwind CSS
- CLI server: Commander.js + Express
- Build: pnpm workspace + tsup
License
MIT