
@speajus/diblob-visualizer
v1.0.3
Published
Interactive dependency injection graph visualization for diblob

Readme
🎨 Diblob Visualizer
Interactive dependency injection graph visualization for diblob.
Visualize your dependency injection container as an interactive graph with nodes representing blobs and edges showing dependencies between them.
✨ Features
- 📊 Interactive Graph Visualization - Pan, zoom, and drag nodes
- 🔄 Real-time Updates - Watch the graph update as you modify your container
- 🎯 Lifecycle Indicators - Visual distinction between Singleton and Transient services
- 📈 Statistics Dashboard - See counts of nodes, edges, and lifecycle types
- 🎨 Clean UI - Modern, responsive design with clear visual hierarchy
- 🔌 Embeddable - Easy to integrate into any Svelte application
- 🏷️ Metadata Support - Display custom names, descriptions, and metadata for blobs
📸 Screenshots
Dependency Graph Visualization
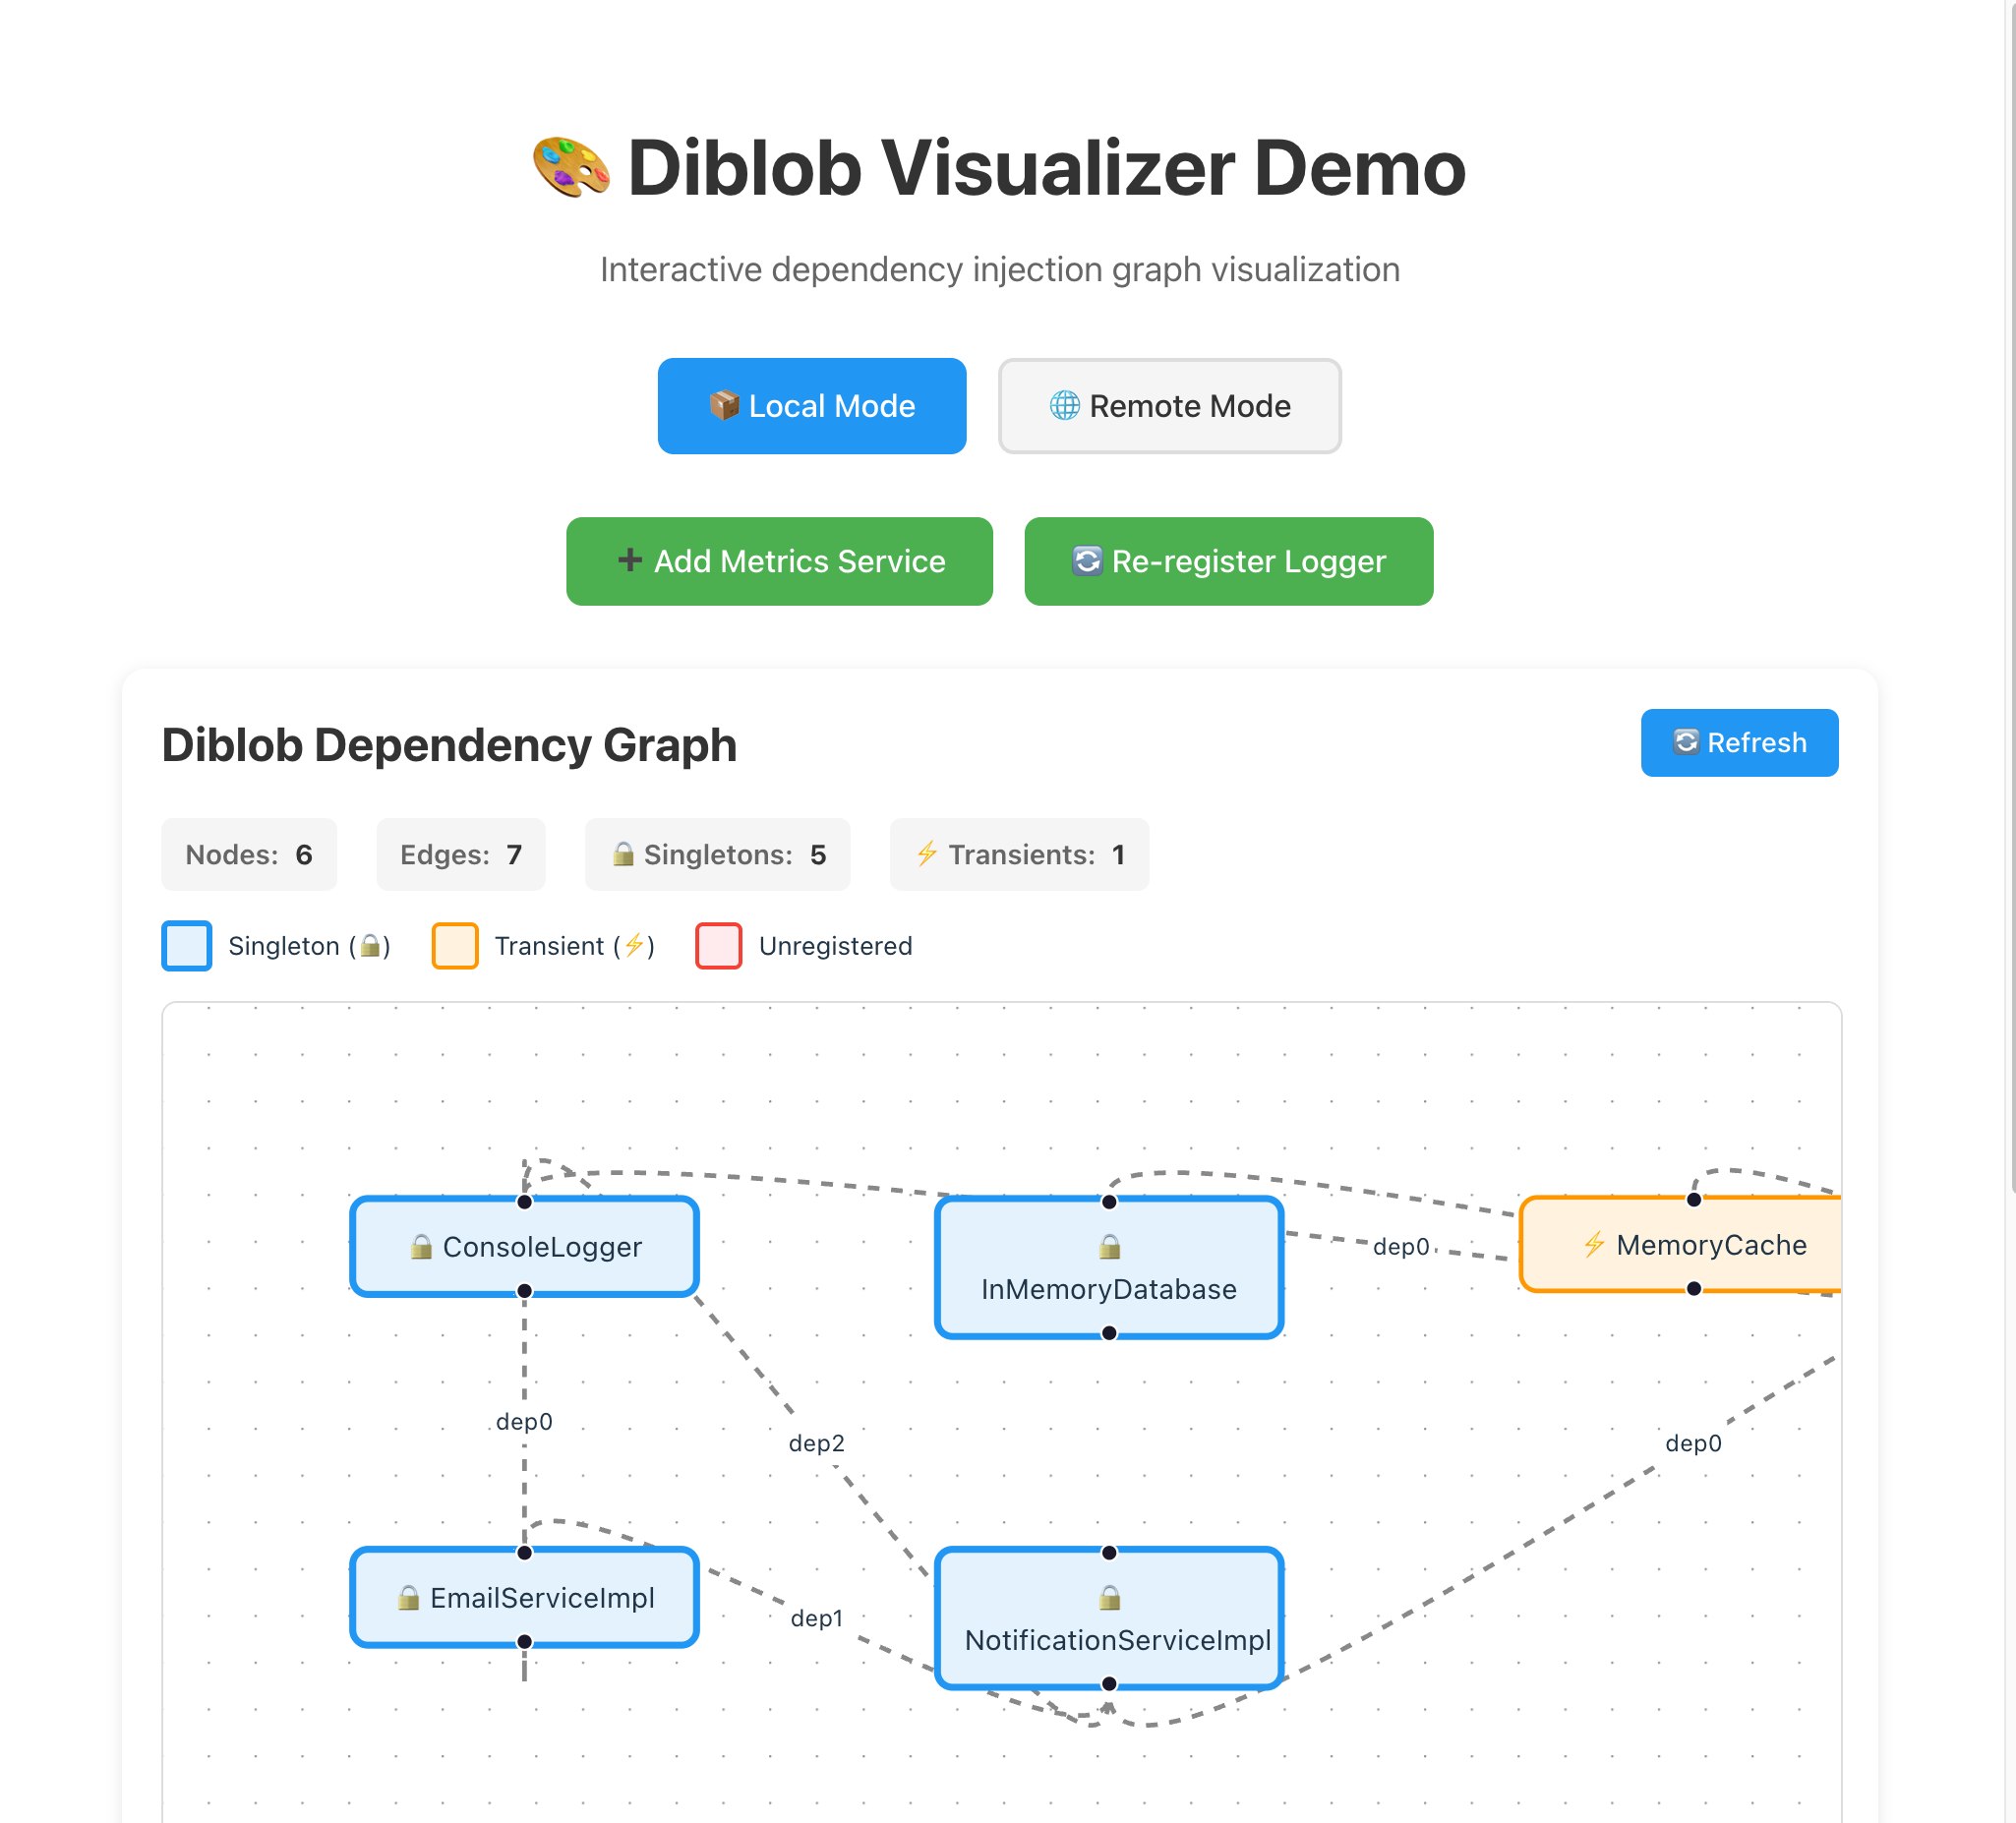
The visualizer displays your dependency injection container as an interactive graph, showing:
- Blob nodes with their metadata (name, description)
- Dependencies between services
- Lifecycle indicators (Singleton/Transient)
- Real-time statistics
Metadata Display

Blobs with metadata show rich information:
- Custom names instead of generic blob IDs
- Descriptions for better understanding
- Any custom metadata properties you define
📦 Installation
npm install @speajus/diblob-visualizer @speajus/diblob🚀 Quick Start
Standalone Demo
npm install
npm run dev
Open http://localhost:5173 to see the visualizer in action.
Embedding in Your Application
<script lang="ts">
  import { DiblobVisualizer } from '@speajus/diblob-visualizer';
  import { createContainer, createBlob } from '@speajus/diblob';

  const container = createContainer();
  const logger = createBlob<Logger>();
  container.register(logger, ConsoleLogger);
</script>

<DiblobVisualizer {container} />
📖 Usage Examples
See src/App.svelte for a complete working example with multiple services.
Using Metadata for Better Visualization
Add metadata to your blobs to make the visualizer more informative:
import { createBlob, createContainer } from '@speajus/diblob';

// Create blobs with metadata
const logger = createBlob<Logger>('logger', {
  name: 'Console Logger',
  description: 'Logs messages to the console'
});

const userService = createBlob<UserService>('userService', {
  name: 'User Service',
  description: 'Manages user data and operations',
  version: '1.0.0'
});

// Create container with metadata
const container = createContainer({
  name: 'Application Container',
  description: 'Main DI container'
});

// Register services
container.register(logger, ConsoleLogger);
container.register(userService, UserServiceImpl, logger);
The visualizer will display the metadata names and descriptions, making it much easier to understand your dependency graph at a glance.
Component Props
| Prop | Type | Default | Description |
|------|------|---------|-------------|
| container | Container | required | The diblob container to visualize |
| autoRefresh | boolean | false | Auto-refresh at intervals |
| refreshInterval | number | 1000 | Refresh interval (ms) |
Graph Legend
- 🔒 Blue nodes - Singleton services
- ⚡ Orange nodes - Transient services
- Red nodes - Unregistered dependencies
- Arrows - Dependencies between services
🏗️ Architecture
Built with Svelte 5, Svelte Flow, TypeScript, and Vite.
🔧 Development
npm install
npm run dev      # Start dev server
npm run build    # Build library
npm run check    # Type check
📝 License
MIT