
@stickyboard/mapbox
v0.1.1
Published
MapBox component for StickyBoard
Downloads
9
Maintainers
 soaple
Readme
stickyboard-mapbox
MapBox component for StickyBoard


Webpack watch
$ npm startBuild
$ npm run buildUsage examples
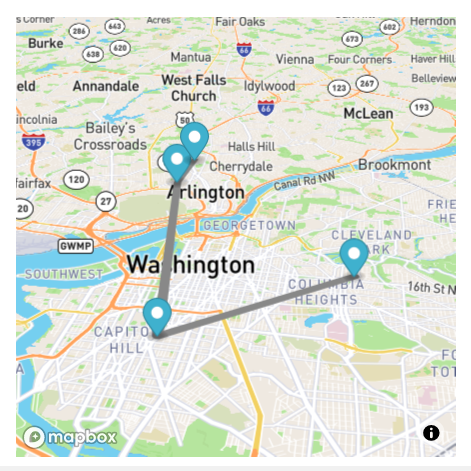
Basic marker and line sample

import React from 'react';
import { MapBox } from '@stickyboard/mapbox';

const sampleInputs = {
    data: {
        mapboxKey: 'YOUR MAPBOX KEY VALUE HERE!!!',
        title: 'Stickyboard-mapbox example',
        description: 'This component is one of stickers in Stickyboard',
    },
    map: {
        canvas: {},
        camera: {
            center: [-77.04, 38.907],
            zoom: 10,
        },

        marker: [
            {
                coordinates: [-77.038659, 38.931567],
                title: 'Mapbox Sticker Example#1',
                description: '<strong>Make it Mount Pleasant</strong>',
                display: true,
                closeOnClick: true,
            },
            {
                coordinates: [-77.003168, 38.894651],
                title: 'Mapbox Sticker Example#2',
                description:
                    '<strong>Mad Men Season Five Finale Watch Party</strong><p>Head to Lounge 201 (201 Massachusetts Avenue NE) Sunday for a Mad Men Season Five Finale Watch Party, complete with 60s costume contest, Mad Men trivia, and retro food and drink. 8:00-11:00 p.m. $10 general admission, $20 admission and two hour open bar.</p>',
                closeOnClick: true,
            },
            {
                coordinates: [-77.090372, 38.881189],
                title: 'Mapbox Sticker Example#3',
                description:
                    '<strong>Big Backyard Beach Bash and Wine Fest</strong><p>EatBar (2761 Washington Boulevard Arlington VA) is throwing a Big Backyard Beach Bash and Wine Fest on Saturday, serving up conch fritters, fish tacos and crab sliders, and Red Apron hot dogs. 12:00-3:00 p.m. $25.</p>',
                closeOnClick: true,
            },
            {
                coordinates: [-77.111561, 38.882342],
                title: 'Mapbox Sticker Example#4',
                description: '<strong>Ballston Arts & Crafts Market</strong>',
                display: true,
                closeOnClick: true,
            },
        ],

        line: [
            {
                paint: {
                    lineColor: '#888',
                    lineWidth: 8,
                },
                coordinates: [
                    [-77.038659, 38.931567],
                    [-77.003168, 38.894651],
                    [-77.090372, 38.881189],
                    [-77.111561, 38.882342],
                ],
                title: 'line#1',
                description: 'line#1 description here',
            },
            {
                paint: {
                    lineColor: '#222',
                    lineWidth: 8,
                },
                coordinates: [
                    [-112.48369693756104, 37.83381888486939],
                    [-112.48348236083984, 37.83317489144141],
                    [-112.48339653015138, 37.83270036637107],
                    [-112.48356819152832, 37.832056363179625],
                    [-112.48404026031496, 37.83114119107971],
                    [-112.48404026031496, 37.83049717427869],
                    [-112.48348236083984, 37.829920943955045],
                    [-112.48356819152832, 37.82954808664175],
                    [-112.48507022857666, 37.82944639795659],
                    [-112.48610019683838, 37.82880236636284],
                    [-112.48695850372314, 37.82931081282506],
                    [-112.48700141906738, 37.83080223556934],
                    [-112.48751640319824, 37.83168351665737],
                    [-112.48803138732912, 37.832158048267786],
                    [-112.48888969421387, 37.83297152392784],
                    [-112.48987674713133, 37.83263257682617],
                    [-112.49043464660643, 37.832937629287755],
                    [-112.49125003814696, 37.832429207817725],
                    [-112.49163627624512, 37.832564787218985],
                    [-112.49223709106445, 37.83337825839438],
                    [-112.49378204345702, 37.83368330777276],
                ],
                title: 'line#1',
                description: 'line#1 description here',
            },
        ],
    },
};

function MapBoxChart(props) {
    return (
        <div>
            <MapBox data={sampleInputs.data} map={sampleInputs.map} />
        </div>
    );
}

export default MapBoxChart;
Pitch and bearing
map: {
    canvas: {
       ...
    },
    camera: {
        center: [-77.04, 38.907],
        zoom: 11,
        pitch:60,
        bearing:-60
    },
    ...
}
Enable / disable scroll zoom
Default is disable.

map: {
    canvas: {
        scrollZoom: true
    },
6 types of Map style
- streets-v11 (default)
map: {
    canvas: {
style: 0,- light-v10

map: {
    canvas:{
style: 1,- dark-v10

map: {
    canvas: {
style: 2,- satellite-v9
map: {
    canvas: {
style: 3,- satellite-streets-v11

map: {
    canvas: {
style: 4,- outdoors-v11

map: {
    canvas: {
        style: 5,
Play map locations as a slide show

import React from 'react';
import { MapBox } from '@stickyboard/mapbox';

const sampleInputs = {
    data: {
        mapboxKey: 'YOUR MAPBOX KEY VALUE HERE!!!',
        title: 'Stickyboard-mapbox example',
        description: 'This component is one of stickers in Stickyboard',
    },
    map: {
        canvas: {
            style: 2,
            scrollZoom: true,
        },
        camera: {
            center: [-73.9499, 40.626],
            zoom: 11,
            pitch: 60,
            bearing: -60,
            centerTheMapOnAClick: true,
        },
    },
    slideshow: {
        maxZoom: 16,
        minZoom: 9,
        timeoutSec: 3,
        location: [
            {
                id: '2',
                title: 'The Bronx',
                description:
                    "This is where hip-hop was born, where the Yankees became a dynasty and where you can find New York City's leading zoo and botanical garden.",
                camera: {
                    center: [-73.8709, 40.8255],
                    zoom: 12.21,
                    pitch: 50,
                },
            },
            {
                id: '3',
                title: 'Brooklyn',
                description:
                    "No matter how hip it looks on TV, NYC's most populous borough is best experienced in person. Read on to find out about live music, Prospect Park, Nets basketball and more.",
                camera: {
                    center: [-73.9499, 40.626],
                    bearing: -8.9,
                    zoom: 11.68,
                },
            },
            {
                id: '1',
                title: 'Manhattan',
                description:
                    'Even if you think you know Manhattan—its world-class museums, fine dining and unforgettable views—the borough always has something new and exciting in store.',
                camera: {
                    center: [-74.007, 40.7437],
                    bearing: 25.3,
                    zoom: 11.5,
                },
            },
            {
                id: '4',
                title: 'Queens',
                description:
                    "Taste food from around the globe, watch Mets baseball and US Open tennis, see cutting-edge art and more in one of the world's most diverse places.",
                camera: {
                    center: [-73.8432, 40.6923],
                    bearing: 36,
                    zoom: 11.37,
                },
            },
            {
                id: '5',
                title: 'Staten Island',
                description:
                    'Take a free ferry ride to an island getaway filled with historic architecture, stunning views, gardens and many family-friendly attractions.',
                camera: {
                    center: [-74.1991, 40.5441],
                    bearing: 28.4,
                    zoom: 11.64,
                },
            },
            {
                title: 'Boroughs of new york',
                description:
                    'New York City is made up of five boroughs: the Bronx, Brooklyn, Manhattan, Queens and Staten Island. Each one has enough attractions—and enough personality—to be a city all its own.',
                camera: {
                    center: [-74.0315, 40.6989],
                    zoom: 9.68,
                    bearing: 0,
                    pitch: 0,
                },
            },
        ],
    },
};

function MapBoxChart(props) {
    return (
        <div>
            <MapBox
                data={sampleInputs.data}
                map={sampleInputs.map}
                slideshow={sampleInputs.slideshow}
            />
        </div>
    );
}

export default MapBoxChart;
Additional source and layers
- vector tile source
data: {
...
},
map: {
...
},
slideshow: {
...
},
source: [
{
name: 'mapbox-terrain',
type: 'vector',
url: 'mapbox://mapbox.mapbox-terrain-v2',
},
],
layer: [
{
id: 'terrain-data',
type: 'line',
source: 'mapbox-terrain',
'source-layer': 'contour',
layout: {
'line-join': 'round',
'line-cap': 'round',
},
paint: {
'line-color': '#ff69b4',
'line-width': 1,
},
},
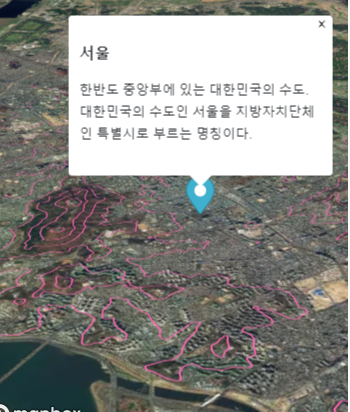
],3D building layers

You can simply set 3d building layers with building3d props value as true
data: {
      ...
},
map: {
    canvas: {
        ...
        building3d: true,
Here's an simple sample code of above picture.
import React from 'react';
import { MapBox } from '@stickyboard/mapbox';
const sampleInputs = {
data:{
mapboxKey:'YOUR MAPBOX KEY VALUE HERE!!!',
title:'Stickyboard-mapbox example',
description: 'This component is one of stickers in Stickyboard',
},
map:{
canvas:{
style:0,
building3d:true,
scrollZoom:true
},
camera:{
center: [126.939016, 37.519961],
zoom: 16.5,
pitch:30,
bearing:-20,
centerTheMapOnAClick:true
},
},
}
function MapBoxChart(props) {
return (
<div >
<MapBox data={sampleInputs.data} map={sampleInputs.map} />
</div>
);
}
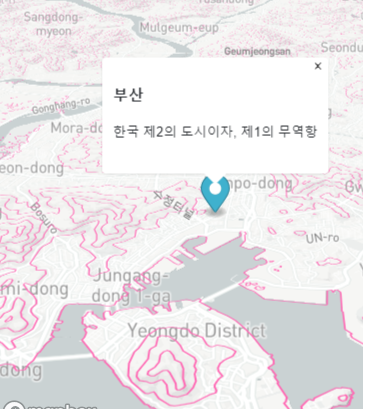
export default MapBoxChart;Geolocation enable
User can enable geolocation and map will fly to the location where the user is.
map:{
        canvas:{
              ...
            geoLocation:true,
If you put openweatherAPI key, weather information of the location will be popped up.

 data:{
        ...
        openweathermapKey:'OPENWEATHERMAP API KEY HERE'
License
This project is licenced under the MIT License. However, this project has a dependency on MapBox GL JS. For legitimate use, you have to check a 3-Clause BSD license.