
@wmaurer/otelscope
v0.1.1
Published
A terminal viewer for otelscope JSONL span files.


Readme
@wmaurer/otelscope
A terminal viewer for the span files that
@wmaurer/otelscope-effect writes. Browse runs, traces and
spans while the program runs, or after it has finished.
Requirements
- Node >= 26.9. The viewer draws through OpenTUI, which loads its native library with Node's
node:ffi. Node 26.9 turnsnode:ffion by default. On Node 26.1 to 26.8, run it with--experimental-ffi. On Node 24 or older, it prints the version it needs and exits 1. - Bun is not supported or tested. It probably works with
bunx --bun @wmaurer/otelscope. - A global install takes about 68 MB, most of it from OpenTUI's dependencies.
- The viewer keeps every record in memory and is sized for files of about 250,000 spans. Larger files load more slowly.
Usage
npx @wmaurer/otelscope traces/spans.jsonlotelscope <file> [--no-follow] [--run <id>] [--trace <id>]
otelscope --help | --version| Flag | Effect |
| -------------- | -------------------------------------------------------------------------------------------------- |
| --no-follow | Read the file once instead of following it. |
| --run <id> | Open the run's traces. The id is matched exactly or as a unique prefix (--run 2026-10-07T10-01). |
| --trace <id> | Open the trace. The id is matched exactly or as a unique prefix (--trace 9f3c). |
Without --no-follow, the viewer follows the file like tail -F. It shows records as the program writes them, waits
for a file that does not exist yet, and reloads the file when it is truncated or replaced.
To write the file, provide JsonlTrace.layer from
@wmaurer/otelscope-effect 0.3.0 or later. The viewer
skips records from older versions and counts them in the status bar.
Screens
The viewer opens on Runs and goes one level deeper with ⏎. Esc goes back.
- Runs lists every program run in the file, newest first, by service and start time, with its duration and its
trace, failure, span and log counts. While the viewer follows the file, a green
●marks a run that wrote a record in the last 5 seconds. - Traces lists the run's traces in start order. A root span name with 20 or more traces folds under one heading that shows the median duration, the failed traces and the most common error.
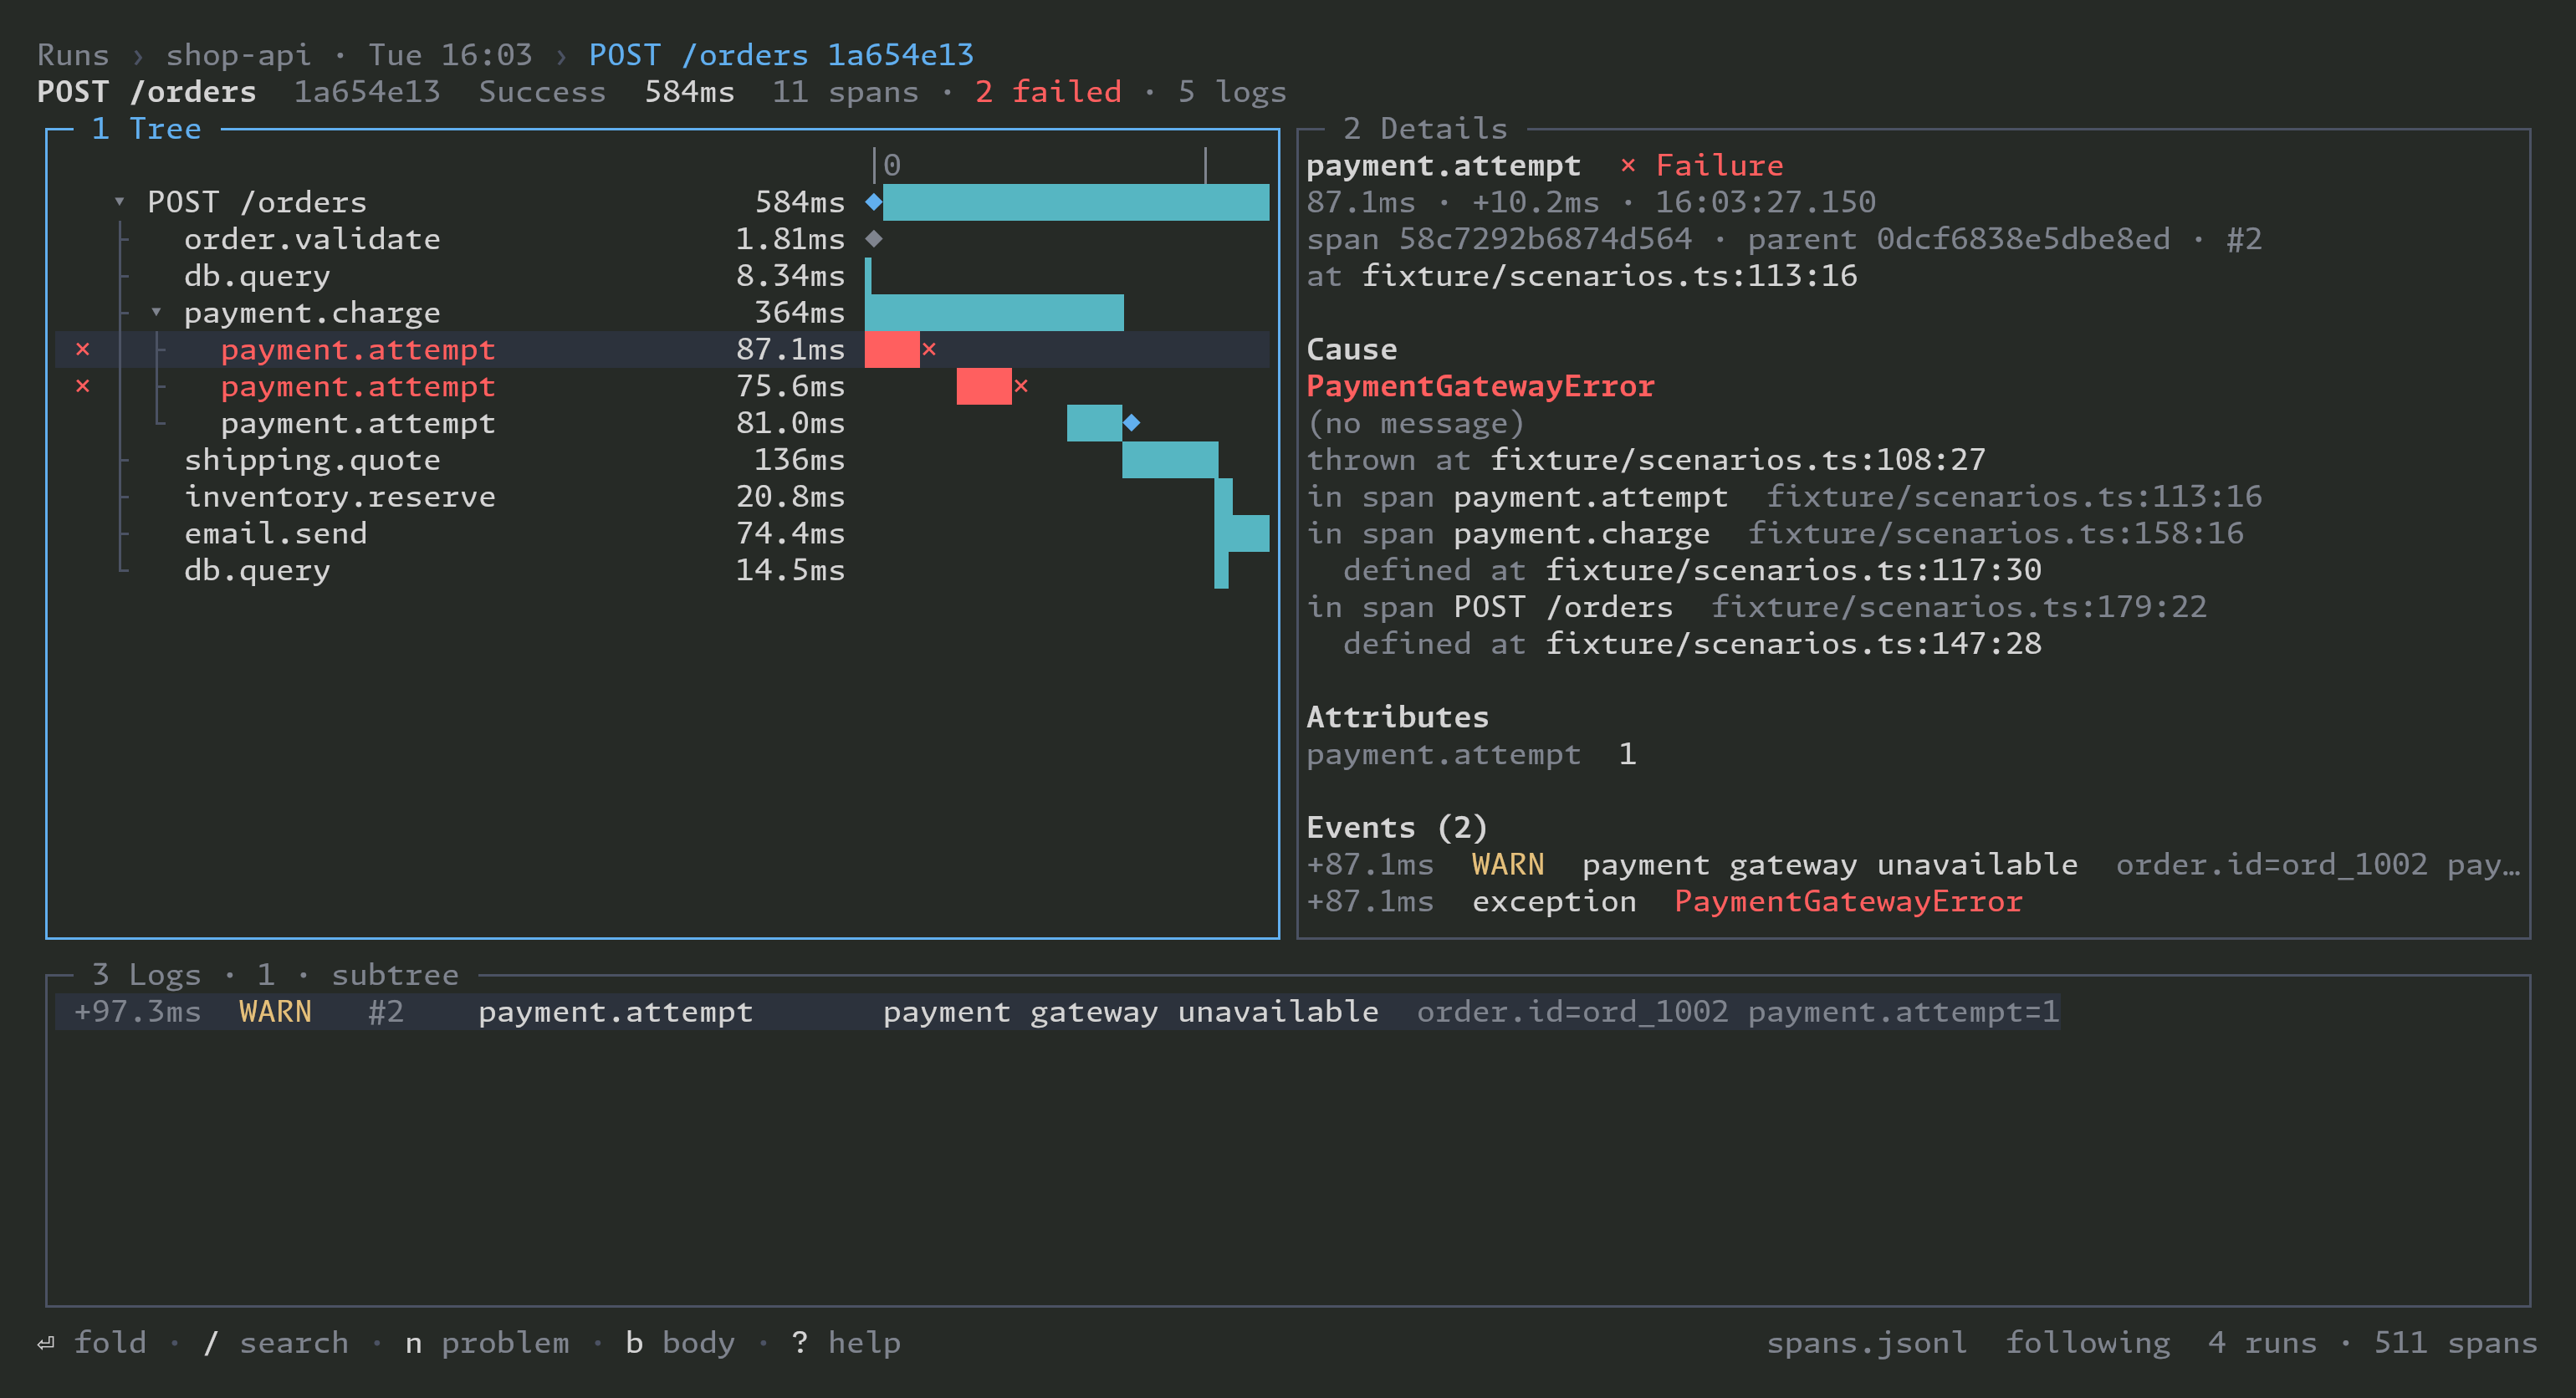
- Trace shows the span tree with waterfall bars, the selected span's details (timing, source location, the
Effect cause, attributes and events), and the logs of the selected span and its descendants. A red
✗marks the span where a failure started. A dim✗marks a span that only passed the failure up. - Body shows the
.bodyattributes of a span, such as an HTTP or LLM request body, that the writer moved tobodies/. JSON is pretty-printed and coloured. Pressbon a span to open it.
Search with /
/ filters the Runs and Traces lists and the logs pane. In the span tree, / highlights the matching spans and
n/N move between them. A query is a list of terms separated by spaces, and every term must match.
| Term | Matches |
| ---------------------------------------- | ------------------------------------------------------------------------------------------------ |
| payment | text in a span's name, attributes, events, exception, ids, service, source paths or fiber (#7) |
| "card declined" | the quoted text, spaces included |
| key=value | an attribute named exactly key whose value contains value |
| key= | an attribute named key |
| is:failed · is:interrupted · is:ok | the span's exit |
| is:<level> | a log line's level (trace, debug, info, warn, error, fatal), in the logs pane |
A term in lowercase ignores case. A term with a capital letter matches case exactly. On Traces, each term may match a
different span of the trace, so is:failed http.route=/orders finds the traces where some span served /orders and
some span failed. The Body screen searches its text for the plain string you type.
Keys
Press ? on any screen for its full list of keys.
| Key | Does |
| --------------- | ------------------------------------------------------------------------------------ |
| j k ↑ ↓ | move |
| ⏎ | open, or fold and unfold |
| Esc | close the input or overlay, then clear the query, then go back |
| / | search |
| n N | next and previous problem (a failed or interrupted row), or search match in the tree |
| 1 2 3 | focus the tree, details or logs pane on the Trace screen |
| b | open the selected span's bodies |
| e | open the span's source location, or the body file, in your editor |
| y | copy the body to the clipboard, on the Body screen |
| q · Ctrl-c | quit |
The mouse works too. A click selects a row, a click on the selected row opens it, and the wheel scrolls the pane under the pointer.
Environment
| Variable | Use |
| ----------------------- | -------------------------------------------------------------------------------------------------- |
| VISUAL, then EDITOR | The editor that e starts. |
| OPENTUI_LIBC | glibc or musl. On Linux, the viewer detects musl itself. Set the variable only to override it. |
e passes --goto file:line:col to code, cursor and codium, and +line file to any other editor.
y copies with the OSC 52 escape sequence, so it works over SSH in terminals that support OSC 52. Inside tmux, add
set -g set-clipboard on to your tmux configuration.
Exit codes
| Code | When |
| ---- | -------------------------------------------------------------------------------------------------- |
| 0 | You quit, the viewer got a signal, or --help or --version printed |
| 1 | The file cannot be opened, the terminal is not interactive, Node is too old, or the viewer crashed |
| 2 | The arguments are wrong |
License
MIT