
acryl-bias-hichart
v0.2.2
Published
It is a data visualization library based on hichart and d3.js.
Maintainers
 dawson04
Readme
Bias-Hichart
Highcharts와 d3.js 기반 데이터시각화 라이브러리 입니다.
git-pages: https://github.com/Dawson-Park/bias-hichart
Installation
npm i acryl-bias-hichartusage
Bar Chart

/* *.js || *.ts */
const data = [
	[1, 2, 3, 4, 5],
	[5, 4, 2, 3, 1],
	[8, 1, 6, -1, 4],
	[7, 6, 5, 2, 3],
];
const seriesName = [ "New Jersey", "Iowa", "Wisconsin", "Missouri" ];
const xAxis = ["up", "down", "left", "right"];

new Bar({
  data, // 차트에 표시할 데이터
  targetId: "BarTest", // 차트를 표시할 요소의 id(#제외)
  seriesName, // 각 데이터 그룹의 이름
  xAxis, // x축에 표시할 내용
  title: "Bar", // 차트의 제목
  subtitle: "BarTest", // 차트의 소제목
  legend: true // 데이터 그룹에 대한 표시 유무
}).show();

/* *.html */
<div id="BarTest" />
| Parameter | Type | Default |
|------------|--------------|-------------|
| data | number[][] | @required |
| targetId | string | @required |
| seriesName | string[] | [] |
| xAxis | string[] | undefined |
| colorSet | string[] | [] |
| title | string | undefined |
| subtitle | string | undefined |
| legend | boolean | undefined |
3d Bar Chart

/* *.js || *.ts */
const data = [
	[1, 2, 3, 4, 5],
	[5, 4, 2, 3, 1],
	[8, 1, 6, -1, 4],
	[7, 6, 5, 2, 3],
];
const seriesName = [ "New Jersey", "Iowa", "Wisconsin", "Missouri" ];
const xAxis = ["up", "down", "left", "right"];

new Bar3d({
  data, // 차트에 표시할 데이터
  targetId: "Bar3dTest", // 차트를 표시할 요소의 id(#제외)
  seriesName, // 각 데이터 그룹의 이름
  xAxis, // x축에 표시할 내용
  title: "Bar3d", // 차트의 제목
  subtitle: "Bar3dTest", // 차트의 소제목
  legend: true // 데이터 그룹에 대한 표시 유무
}).show();

/* *.html */
<div id="Bar3dTest" />
| Parameter | Type | Default |
|------------|--------------|-------------|
| data | number[][] | @required |
| targetId | string | @required |
| seriesName | string[] | [] |
| xAxis | string[] | undefined |
| colorSet | string[] | [] |
| title | string | undefined |
| subtitle | string | undefined |
| legend | boolean | undefined |
Spider Chart
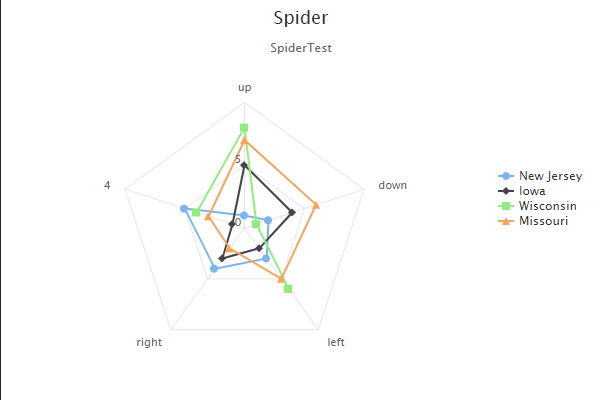
/* *.js || *.ts */
const data = [
	[1, 2, 3, 4, 5],
	[5, 4, 2, 3, 1],
	[8, 1, 6, -1, 4],
	[7, 6, 5, 2, 3],
];
const seriesName = [ "New Jersey", "Iowa", "Wisconsin", "Missouri" ];
const xAxis = ["up", "down", "left", "right"];

new Spider({
  data, // 차트에 표시할 데이터
  targetId: "SpiderTest", // 차트를 표시할 요소의 id(#제외)
  seriesName, // 각 데이터 그룹의 이름
  xAxis, // x축에 표시할 내용
  title: "Spider", // 차트의 제목
  subtitle: "SpiderTest", // 차트의 소제목
  legend: true // 데이터 그룹에 대한 표시 유무
}).show();

/* *.html */
<div id="SpiderTest" />
| Parameter | Type | Default |
|------------|--------------|-------------|
| data | number[][] | @required |
| targetId | string | @required |
| seriesName | string[] | [] |
| xAxis | string[] | undefined |
| colorSet | string[] | [] |
| title | string | undefined |
| subtitle | string | undefined |
| legend | boolean | undefined |
Polar Chart
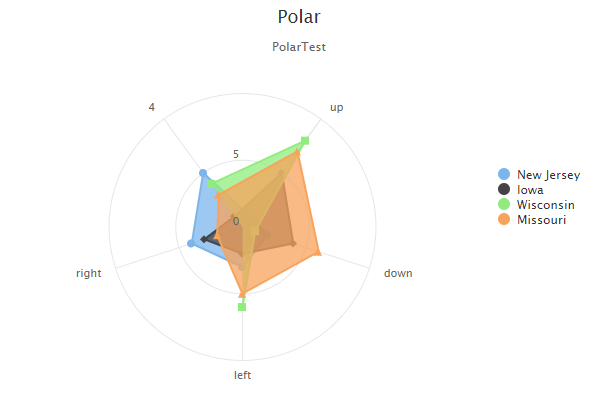
/* *.js || *.ts */
const data = [
	[1, 2, 3, 4, 5],
	[5, 4, 2, 3, 1],
	[8, 1, 6, -1, 4],
	[7, 6, 5, 2, 3],
];
const seriesName = [ "New Jersey", "Iowa", "Wisconsin", "Missouri" ];
const xAxis = ["up", "down", "left", "right"];

new Polar({
  data, // 차트에 표시할 데이터
  targetId: "PolarTest", // 차트를 표시할 요소의 id(#제외)
  seriesName, // 각 데이터 그룹의 이름
  xAxis, // x축에 표시할 내용
  title: "Polar", // 차트의 제목
  subtitle: "PolarTest", // 차트의 소제목
  legend: true // 데이터 그룹에 대한 표시 유무
}).show();

/* *.html */
<div id="PolarTest" />
| Parameter | Type | Default |
|------------|--------------|-------------|
| data | number[][] | @required |
| targetId | string | @required |
| seriesName | string[] | [] |
| xAxis | string[] | undefined |
| colorSet | string[] | [] |
| title | string | undefined |
| subtitle | string | undefined |
| legend | boolean | undefined |
Scatter Chart
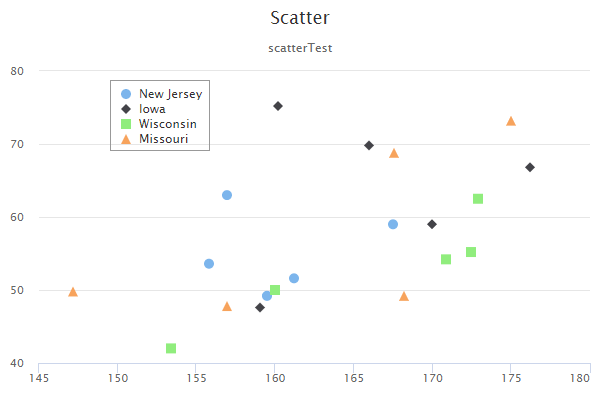
/* *.js || *.ts */
const scatterData = [
	[ [161.2, 51.6], [167.5, 59.0], [159.5, 49.2], [157.0, 63.0], [155.8, 53.6], ],
	[ [170.0, 59.0], [159.1, 47.6], [166.0, 69.8], [176.2, 66.8], [160.2, 75.2], ],
	[ [172.5, 55.2], [170.9, 54.2], [172.9, 62.5], [153.4, 42.0], [160.0, 50.0], ],
	[ [147.2, 49.8], [168.2, 49.2], [175.0, 73.2], [157.0, 47.8], [167.6, 68.8], ]
];
const seriesName = [ "New Jersey", "Iowa", "Wisconsin", "Missouri" ];

new Scatter({
  data: scatterData, // 차트에 표시할 데이터
  targetId: "scatterTest", // 차트를 표시할 요소의 id(#제외)
  seriesName, // 각 데이터 그룹의 이름
  xAxis: "xAxis", // label에 표시할 x축의 이름
	yAxis: "yAxis", // label에 표시할 y축의 이름
  title: "Scatter", // 차트의 제목
  subtitle: "scatterTest", // 차트의 소제목
  legend: true // 데이터 그룹에 대한 표시 유무
}).show();

/* *.html */
<div id="scatterTest" />
| Parameter | Type | Default |
|------------|----------------|-------------|
| data | number[][][] | @required |
| targetId | string | @required |
| xAxis | string | undefined |
| yAxis | string | undefined |
| seriesName | string[] | [] |
| colorSet | string[] | [] |
| title | string | undefined |
| subtitle | string | undefined |
| legend | boolean | undefined |
Network Chart

/* *.js || *.ts */
const networkData = {
	input: 8,
	hidden: 12,
	output: 6
};

new Network({
  node: networkData,
  targetId: "networkTest",
  accent: [1, 3, 5]
}).show();

/* *.html */
<div id="networkTest" />
| Parameter | Type | Default |
|-----------|-----------------------------|-------------|
| node | { input, hidden, output } | @required |
| targetId | string | @required |
| layer | string | 1 |
| accent | string | [] |
| colorSet | string[] | undefined |
Histogram Chart
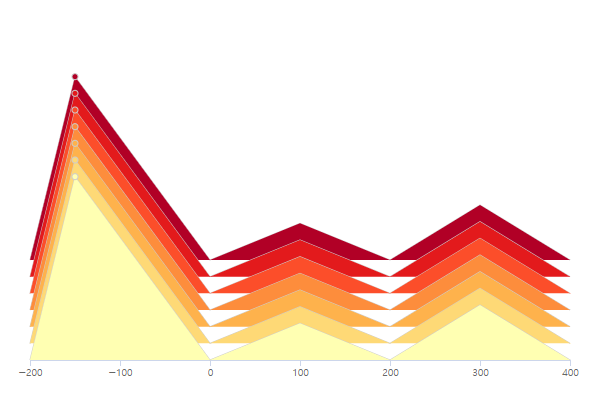
/* *.js || *.ts */
const histoData = [
	[ 0, 10, 0, 2, 0, 3, 0 ],
	[ 0, 10, 0, 2, 0, 3, 0 ],
	[ 0, 10, 0, 2, 0, 3, 0 ],
	[ 0, 10, 0, 2, 0, 3, 0 ],
	[ 0, 10, 0, 2, 0, 3, 0 ],
	[ 0, 10, 0, 2, 0, 3, 0 ],
	[ 0, 10, 0, 2, 0, 3, 0 ],
];
const histoAxis = [ -200, -150, 0, 100, 200, 300, 400 ];

new Histogram({
  node: histoData,
  targetId: "HistogramTest",
  xAxis: histoAxis,
}).show();

/* *.html */
<div id="HistogramTest" />
| Parameter | Type | Default |
|-------------|-----------------|-------------|
| data | number[][] | @required |
| targetId | string | @required |
| xAxis | number[] | @required |
| width | number | 600 |
| height | number | 400 |
| padding | number | 30 |
| innerHeight | number | 300 |
| margin | [top, bottom] | [40, 40] |