
adonis-debugbar
v1.1.1
Published
Per-request debug bar for AdonisJS: timing, SQL queries, route info, session, views, messages, exceptions and timeline markers. Works with any frontend stack.

Maintainers
 syedabdullah
Readme
adonis-debugbar




Per-request debug bar for AdonisJS 6 / 7. Captures timing, SQL queries, route info, session data, log messages, exceptions, and custom timeline markers, all scoped to the current HTTP request via AsyncLocalStorage. Zero overhead when disabled.
Works with any AdonisJS frontend: Edge templates, Inertia + React, Inertia + Vue, or API-only apps that render HTML.
Features
- Messages: manual logging via
Debugbar.log(...),.warn(...),.error(...); objects render as expandable JSON - Console:
console.log,.warn, and.errorcaptured automatically with file/line call-site location - Timeline: request-to-response with high-resolution timing, named markers (
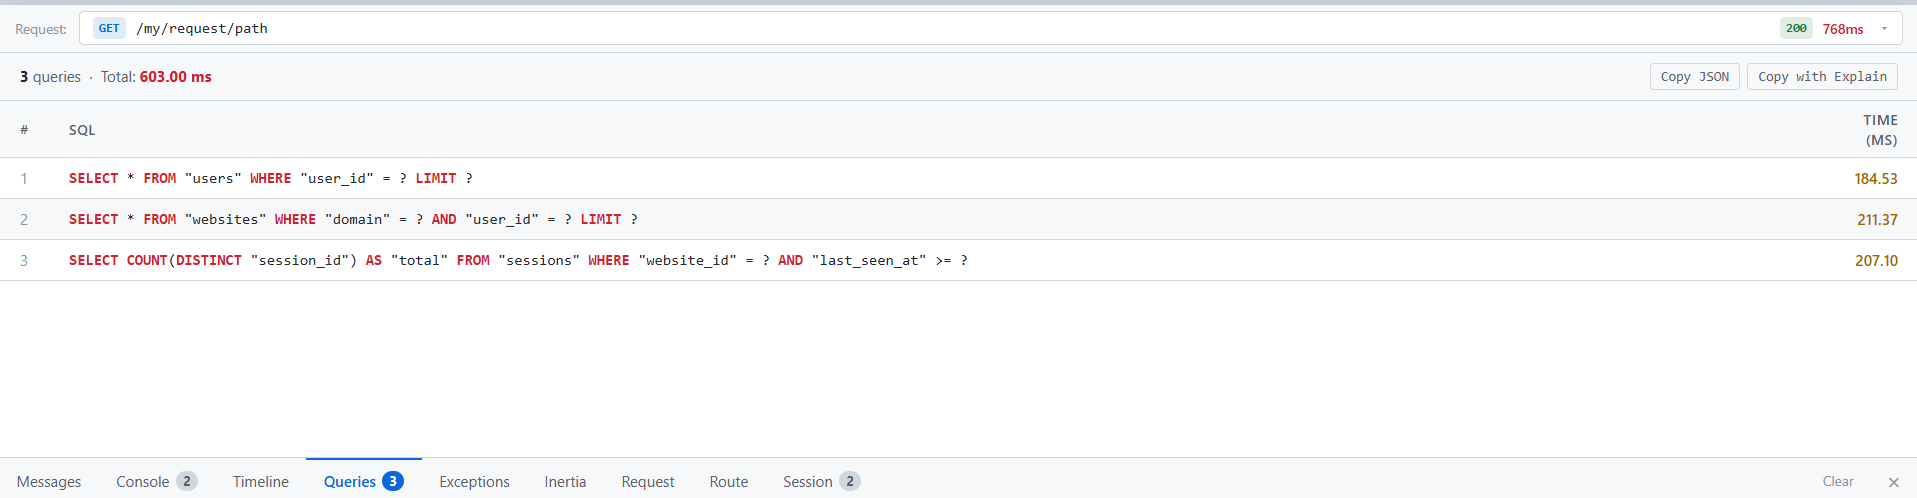
addMarker), and labelled measure spans (startMeasure/stopMeasure) - Queries: every SQL query with bindings, duration, and one-click EXPLAIN ANALYZE (PostgreSQL, MySQL, SQLite)
- Exceptions: caught exceptions via
Debugbar.addException(e)or the global exception handler - Inertia: component name and props snapshot for every Inertia render in the request
- Request: headers, query string, and parsed request body
- Route: matched pattern, handler class, and full middleware chain
- Session: session ID and stored key-value snapshot
Requirements
| Dependency | Version |
| ------------------- | --------------------------------------- |
| Node.js | ≥ 20 |
| @adonisjs/core | ^6.0.0 \|\| ^7.0.0 |
| @adonisjs/lucid | optional, enables SQL query collection |
| @adonisjs/session | optional, enables session snapshot |
No React, no Vue, no other frontend framework required.
Installation
npm install --save-dev adonis-debugbarInstall as a dev dependency; the debugbar is a development tool and should not run in production.
Setup
1: Register the provider
In adonisrc.ts, add the provider to the providers array:
providers: [
  // ...existing providers
  () => import('adonis-debugbar/provider'),
];
The provider exits immediately when DEBUG_BAR is not 'true', so it is safe to register unconditionally.
2: Register the middleware
Add DebugbarMiddleware as the first entry in server.use(...) so it wraps the entire request, including other middleware timing.
// start/kernel.ts
server.use([
  () => import('adonis-debugbar/middleware'),
  () => import('@adonisjs/core/bodyparser_middleware'),
  // ...rest of your server middleware
]);
3: Enable the environment variable
# .env
DEBUG_BAR=true
The middleware and provider both check process.env.DEBUG_BAR. When absent or any value other than 'true', all instrumentation is bypassed: no allocations, no listeners, no routes registered.
4: Add the script tags
Add these two lines anywhere in your HTML layout (Edge template, Inertia root template, etc.):
@if(process.env.DEBUG_BAR === 'true')
  <script>window.__DEBUGBAR_ID__ = "{{ debugbarId }}"</script>
  <script src="/__debugbar/static/debugbar.js"></script>
@end
The middleware automatically shares debugbarId with the Edge view for every request.
That's it. The debugbar will appear at the bottom of every page.
Debugbar API
Import Debugbar in any controller, service, or middleware:
import { Debugbar } from 'adonis-debugbar';Messages
Debugbar.log('Loaded user', user);
Debugbar.warn('Cache miss', { key });
Debugbar.error('Charge failed', { orderId, code: err.code });
Accepts any number of arguments of any type. Strings are shown inline; objects and arrays render as expandable JSON blocks in the Messages tab.
Exceptions
For caught exceptions, record them manually:
try {
  await riskyOperation();
} catch (e) {
  Debugbar.addException(e);
  // handle gracefully; the request continues
}
To capture all unhandled exceptions, add to app/exceptions/handler.ts:
async report(error: unknown, ctx: HttpContext) {
  Debugbar.addException(error)
  return super.report(error, ctx)
}
Timeline markers
Pin a named point in time relative to the start of the request:
Debugbar.addMarker('Auth complete');
Debugbar.addMarker('Cache warm');
Timeline measures
Measure a named span:
Debugbar.startMeasure('pdf');
await generatePdf(data);
Debugbar.stopMeasure('pdf');
Measures appear as labelled bars below the main timeline, offset from the request start. Unclosed measures display an OPEN badge.