
agenttap
v0.5.3
Published
AgentTap — agent-native, local-first LLM observability in one process: four capture channels (OTLP traces/logs ingest, built-in LLM tracing proxy, Claude Code transcript import with input reconstruction), SQLite store, and a LangSmith-style three-pane das

Maintainers
 harveyli
Readme
AgentTap



Tap into your coding agents' LLM traffic — agent-native, local-first observability in a single process.
npx agenttap # then open http://127.0.0.1:4318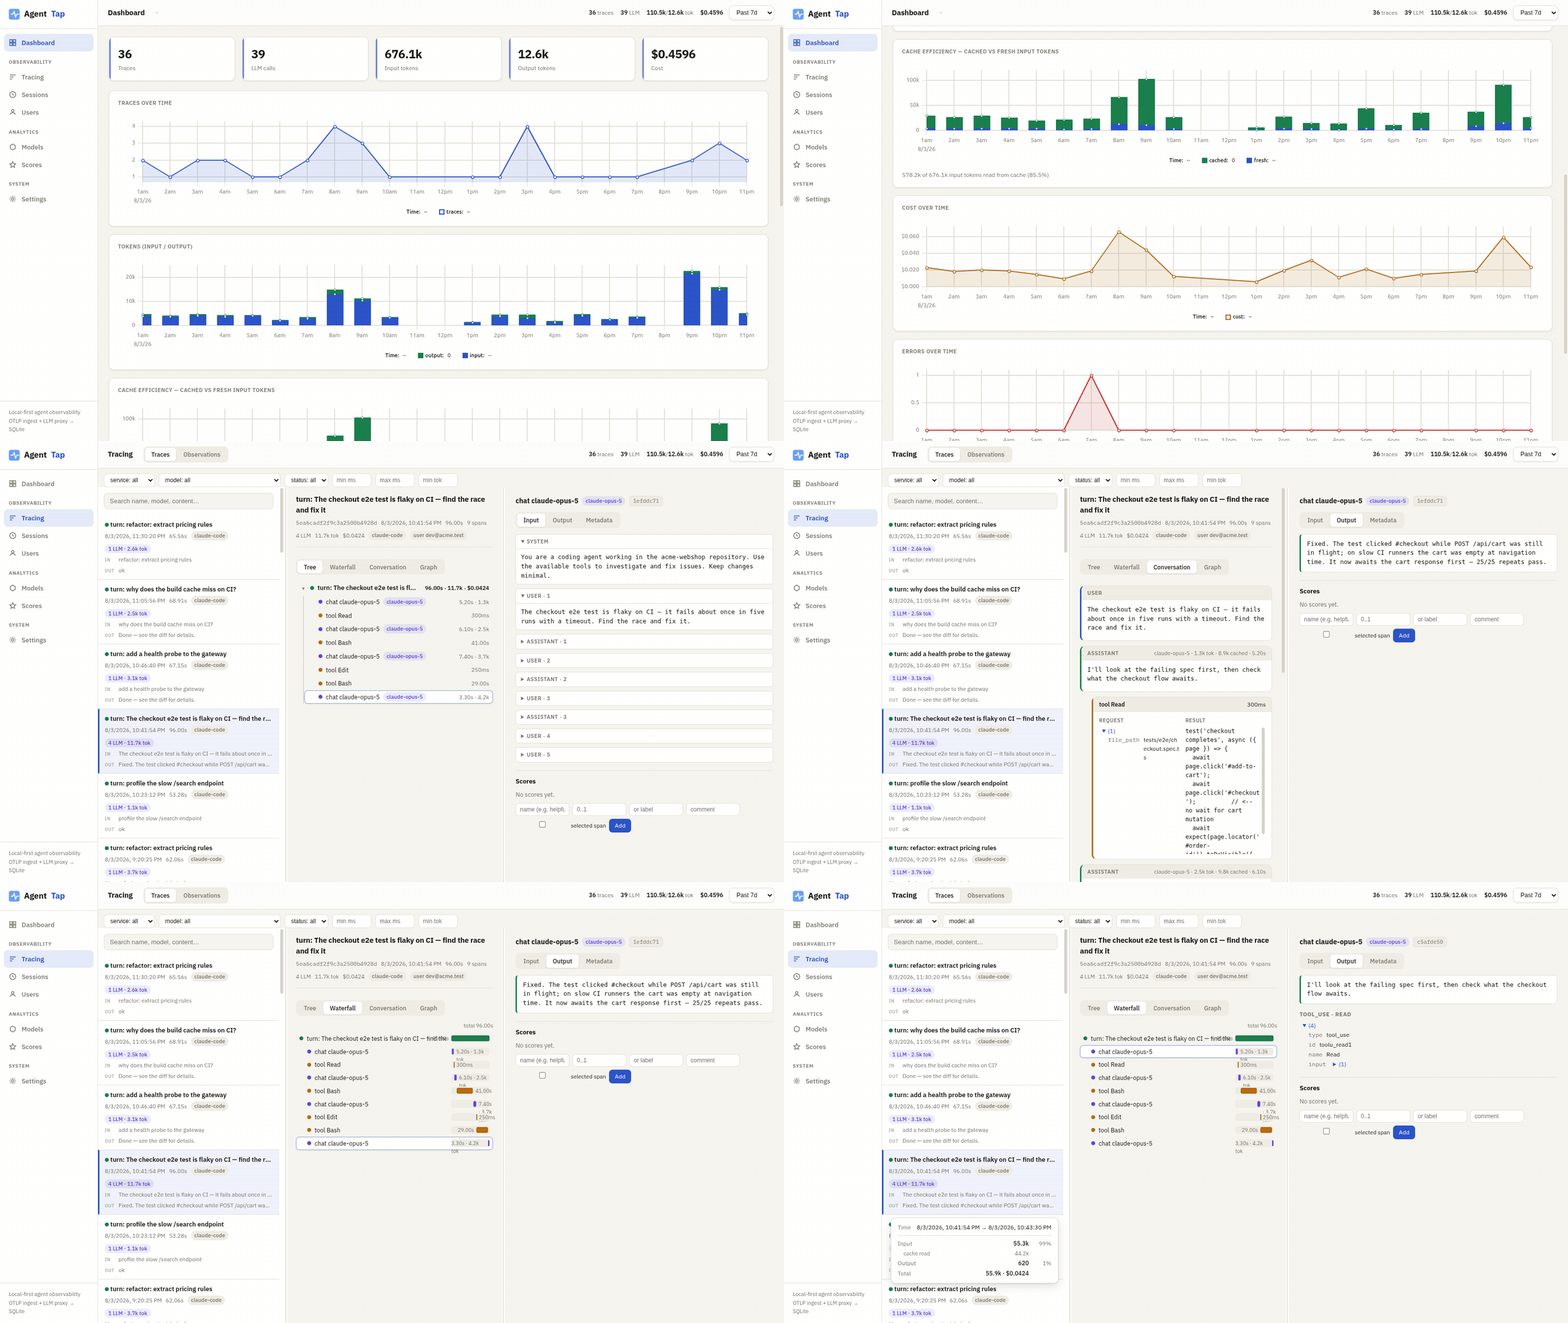
Cache-efficiency dashboard → three-pane tracing (metrics tree · waterfall · conversation) → Input/Output span detail → hover cost card — all local, all from one npx. (Demo data is synthetic.)
A tiny capture-and-visualize platform purpose-built for coding-agent power users — Claude Code, Codex, OpenClaw, opencode, Hermes, pi — who want to see every LLM call, token count, and tool execution their agents make, without running a fleet of containers. Agent-native means it speaks the OTLP dialects agents actually emit (GenAI, OpenInference, NeMo Relay) out of the box; local-first means everything — capture, storage, dashboard — runs on your machine and your prompts never leave it.
Inspired by two great projects, absorbing what each does best:
- Langfuse — the gold standard for LLM trace visualization, but self-hosting requires Postgres + ClickHouse + Redis + MinIO (5 containers).
- NVIDIA NeMo Relay — a brilliant protocol-agnostic capture layer for agent runtimes, but it has no UI or storage by design.
AgentTap combines both roles — NeMo Relay-style capture and Langfuse-style storage/visualization — in one Node.js process with one SQLite file and one dependency.
                        ┌──────────────────── AgentTap ──────────────────────┐
                        │                                                    │
  any coding agent      │   capture channels (mix freely)                    │
  ────────────────────► │   ┌───────────────────────────────────┐            │
  Claude Code, Codex,   │   │ OTLP traces  :4318/v1/traces      │──┐         │
  OpenClaw, opencode,   │   │ OTLP logs    :4318/v1/logs        │──┼► SQLite ► dashboard
  Hermes, pi, ...       │   │ LLM proxy    :4318/proxy/*        │──┤         │
                        │   │ transcripts  ~/.claude/projects/  │──┘         │
                        │   └───────────────────────────────────┘            │
                        │        all produce identical span records          │
                        └────────────────────────────────────────────────────┘
One framework, four capture channels
Agent monitoring here is a single pipeline — capture → normalize → SQLite → dashboard. The only per-agent question is which capture channels to plug in, and channels combine freely; they all produce identical span records downstream:
- OTLP trace ingest (
:4318/v1/traces) — for agents/runtimes with a telemetry exporter: NeMo Relay plugins (OpenClaw), Codex's[otel]config, any OpenTelemetry SDK. Captures from inside the runtime, so it can carry richer detail (tool spans, agent lifecycle). - OTLP log ingest (
:4318/v1/logs) — Claude Code's native telemetry route. Its per-request log events become LLM/tool spans with model, tokens, cost, and latency — but the events carry metrics only, not content (see the table below and the Claude Code guide). - LLM tracing proxy (
:4318/proxy/openai,:4318/proxy/anthropic) — for any agent at all: point its provider base URL at AgentTap. Requests forward verbatim (your API key passes through untouched, streaming included) and every LLM call is recorded on the side. Zero instrumentation, full request/response content — but settingANTHROPIC_BASE_URLdisables Claude Code's subscription OAuth, so this channel is unavailable to subscription users. - Transcript import (
~/.claude/projects/) — reads Claude Code's own session transcripts from disk. Because transcript records carry the same identifiers as the OTLP log events (promptId,requestId,tool_use_id,sessionId), the importer derives byte-identical trace and span IDs, so imported content merges into the OTLP-derived rows via upsert instead of duplicating them. This is the channel that supplies full prompts, completions, and tool input/output for subscription users. Runs automatically when the server starts (opt out with--no-import-transcripts) or on demand viaagenttap import.
What each channel yields:
| Channel | Metrics (model, tokens, cost, latency) | Prompt / completion text | Tool input & output content | Works with Claude subscription (OAuth) |
|---|---|---|---|---|
| OTLP traces /v1/traces | ✅ | depends on the exporter | depends on the exporter | n/a |
| OTLP logs /v1/logs (Claude Code) | ✅ | ❌ — only assistant_response text; user prompts only with OTEL_LOG_USER_PROMPTS=1 | ❌ — byte sizes only | ✅ |
| LLM proxy /proxy/* | ✅ | ✅ full bodies | ✅ (as sent in API requests) | ❌ — custom base URL disables OAuth |
| Transcript import | fills gaps on merge | ✅ full | ✅ full | ✅ — reads local files, no agent config |
# proxy interface: one env var, any agent
export ANTHROPIC_BASE_URL=http://127.0.0.1:4318/proxy/anthropic   # Anthropic-API agents
export OPENAI_BASE_URL=http://127.0.0.1:4318/proxy/openai         # OpenAI-compatible agents

# the openai upstream is configurable — put the proxy in front of LiteLLM, Ollama, NIM, ...
agenttap --openai-upstream http://127.0.0.1:4000
Which interface each agent supports today:
| Agent | OTLP ingest | LLM proxy | Notes |
|---|---|---|---|
| Claude Code | ✅ (OTel env vars) | ✅ ANTHROPIC_BASE_URL (API-key billing only) | native OTel carries metrics only — pair it with transcript import for content; proxy gives full request/response but breaks subscription OAuth |
| Codex | ✅ ([otel] config) | ✅ OPENAI_BASE_URL | either works |
| OpenClaw | ✅ (NeMo Relay plugin) | ✅ (provider baseUrl) | NeMo Relay adds tool/agent lifecycle spans; conversation content and cache tokens are extracted from its payloads |
| opencode | — | ✅ (provider baseURL) | proxy is the path |
| Hermes | depends on build | ✅ | proxy is the safe default |
| pi | manual OTLP possible | ✅ | proxy is the easy path |
(Streamed OpenAI responses report token counts when the client sends stream_options: {"include_usage": true}; message content is always captured.)
Transcript import (Claude Code)
Claude Code's OTel log events report that things happened, not what was
said: measured over 24 h on a live database, its tool_result events carried
only byte sizes, its api_request events carried tokens and cost but no
prompt or completion, and only assistant_response events had any text.
Transcript import closes that gap by reading the session transcripts Claude
Code already writes to ~/.claude/projects/ — including subagent
conversations nested under <project>/<session-id>/subagents/, which on a
real machine were the majority of the files (332 of 379).
# one-shot import into the default DB
agenttap import

# custom transcript dir and/or DB, limited to the last 7 days
agenttap import --dir ~/.claude/projects --since 7 --db ~/.agenttap/traces.db
In server mode the same import runs automatically on startup and then polls
every 30 seconds (byte-offset cursors detect changes, so a pass over unchanged
files is a no-op; a file that did change is re-read in full — see
Input reconstruction below). Disable it
with --no-import-transcripts.
Because the importer derives the same trace/span IDs the OTLP log route uses,
content lands in the same rows: on a real database the import added full
structured content to 25,033 spans (0 before, 93% of claude-code spans
after), and merged spans kept every pre-existing OTLP attribute key. The full
import — 379 files, 30,015 spans — took 8.1 seconds. (This figure and the
growth figure below are 0.4.0-era measurements taken before 0.5.1's input
reconstruction, which makes a full import slower and grows the database
substantially more — see below.)
Two things to know before you turn it on:
- The import blocks the event loop. The initial import and each 30 s poll run synchronously — roughly 2 seconds per 100 transcript files on the first pass. The dashboard and ingest are unresponsive for that window. Subsequent polls skip unchanged files and re-read only the files that changed (typically the one live session).
- The database grows substantially. The measured full import grew
traces.dbfrom 38.8 MB to 187.3 MB. Back up the file before your first 0.4.0 start (see the upgrade note under Install).
Input reconstruction (LLM spans)
Claude Code's transcript records every response but never the request, so
transcript-derived LLM spans used to have an empty Input tab. Since 0.5.1 the
importer reconstructs each call's input from the transcript itself: every
record carries uuid/parentUuid, and the exact conversation thread that
preceded a call is its request. The walk follows the call's own branch, so
sidechains and forks scope themselves correctly.
- Histories are kept under a 128 KB tail budget per call: the newest
messages are kept, older ones dropped, and when anything was dropped the
messages start with one marker:
[reconstructed from transcript — showing last M of N messages; system
prompt and tool schemas are not recorded by Claude Code]
. Storage is bounded by calls × budget, not by history length — measured on a real 1,104-line / 2.7 MB session, reconstruction added 26 MB to the database (228 llm calls, ~113 KB average tail). - Every reconstructed input sets the span attribute
agenttap.input_reconstructed: true(visible in the Metadata tab), so provenance is always inspectable — marker or not. - The honest gap: the system prompt and tool schemas are not in the transcript and are not fabricated. Only the proxy channel captures the true full request. The marker says so explicitly.
- Live-session cost: because a thread's earlier records sit before the byte-offset cursor, a changed file is re-read from offset 0 on every poll. For a long live session (thousands of calls) each 30 s poll therefore re-parses and re-serializes every call's history — transiently hundreds of MB of string allocations for a 4,000-call session — before the store's first-fill-wins merge discards the re-fills in one transaction. The DB does not grow from re-polls; the cost is CPU/allocation churn on the poll, and only for files that changed. Dormant sessions imported before 0.5.1 keep their empty inputs unless their file changes again.
Privacy — set
--authbefore binding beyond loopback. Imported transcripts put your full prompts, file contents, and tool output into~/.agenttap/traces.db. The dashboard and every/api/*endpoint are unauthenticated by default —--tokenprotects only OTLP ingest and the proxy routes, not the dashboard. Pass--auth user:pass(see Dashboard authentication) before binding a non-loopback host (--host 0.0.0.0), or don't bind one at all.
Dashboard authentication
--auth user:pass (env AGENTTAP_AUTH) puts HTTP Basic auth in front of the
dashboard (/, /ui/*) and every /api/* endpoint. Browsers prompt for
credentials natively, so there is no login page, cookie, or session store;
the comparison is constant-time. It is deliberately separate from --token,
which guards the write side (OTLP ingest and the proxy routes) — an agent's
exporter never needs your dashboard password:
- The six ingest paths stay under
--token, including the three Langfuse-compatible/api/public/otel/v1/*aliases — they live under/api/but are exempt from the--authgate so exporters keep working. /healthstays open for liveness probes.- Starting with a non-loopback
--hostand no--authprints a startup warning.
Note that HTTP Basic over plain http:// sends the credentials effectively in
cleartext (base64-encoded, not encrypted) on every request — on untrusted
networks, pair --auth with an SSH tunnel or a TLS-terminating reverse proxy.
The dashboard
A zero-build dashboard (static HTML + ES modules, no framework, charts by a vendored uPlot — no build step, no CDN; uPlot lives under src/ui/vendor/ with its MIT license alongside) modeled on Langfuse's information architecture:
- Dashboard — stat cards plus six time-series charts: traces, tokens in/out (stacked), cache efficiency (cached vs fresh input tokens as stacked bars, with a headline cache-hit ratio), cost, errors, latency p50/p95 band
- Filters — model, status, duration, and token filters on Traces/Observations, combinable with search and the time range
- Tracing → Traces — a LangSmith-style three-pane page: trace table | metrics tree | span detail. The vertical dividers between panes are draggable (widths persist; double-click a divider to reset); below ~1250px viewport width the tree and detail stack instead.
- Trace table — one row per trace with Input and Output preview lines; hovering a row raises a cost card: time plus the Input (cache read broken out) / Output / Total token split with percentages and the trace cost.
- The middle pane has four views:
- Tree (default) — a metrics tree: type dots, model badges, per-node duration and tokens, collapse chevrons with hidden-descendant counts, and a sticky root roll-up
- Waterfall — Gantt bars (offsets, durations, token labels)
- Conversation — the trace rendered as the dialogue it was: user/assistant turns with tool-call cards in between, payloads as collapsible JSON trees
- Graph — mind-map style execution flow (root → LLM/tool calls fanning out)
- Span detail — selecting a span fills the right pane with Input / Output / Metadata tabs: messages as collapsible role sections, conversation-style output blocks, and metadata combining the kv summary (tokens, cache read/write, cost) with raw OTLP attributes (embedded JSON auto-parsed) and events. Span ids copy on click; the default tab follows what the span actually has.
- Tracing → Observations — flat table of every LLM/tool call across all traces
- Sessions — traces grouped by conversation (
session.id,gen_ai.conversation.id, NeMo RelaysessionId, or anx-session-idproxy header) - Users — traces grouped by end-user (
user.id/gen_ai.user.id/enduser.id, or OpenClaw's Feishu open-id from message content) - Models — per-model calls, tokens, average latency, cost; sortable columns and per-model call sparklines
- Scores — per-name score summaries, distribution histogram, scores over time, recent scores linking back to traces
- Settings — LLM judge endpoint config, evaluator management, batch evaluation
- Global time-range filter (1h / 24h / 7d / 30d / all) across every view
Scores & evals
Attach quality scores to traces — numeric (0..1) or categorical — from three sources:
- Manual annotation — a score panel in the trace detail pane; scored traces show ★ badges in the trace list.
- External writers — anything can
POST /api/scoreswithsource: "api"(a CI job, a test harness, your own eval script). - LLM-as-judge — point AgentTap at any OpenAI-compatible chat-completions endpoint (NIM, OpenRouter, Ollama, LiteLLM, ...) via the Settings page or env vars (
AGENTTAP_JUDGE_BASE_URL,AGENTTAP_JUDGE_API_KEY,AGENTTAP_JUDGE_MODEL— env wins over Settings when both the base-URL and model vars are set). The base URL works with or without the/v1suffix — AgentTap normalizes. Three built-in evaluators ship seeded (and you can define your own prompt + score name). The judge only fires when you explicitly run it — Settings' "evaluate last N traces" batch or aPOST /api/judge/run— never automatically, and never on your captured traffic. Unconfigured, everything degrades gracefully to manual scoring.
Judge API keys are stored unencrypted in the local SQLite file; prefer the AGENTTAP_JUDGE_API_KEY env var if key exposure is a concern. Any user who can reach the dashboard can trigger judge runs (relevant only if you bind beyond 127.0.0.1).
How it differs from Langfuse
Langfuse is excellent — and if you need team features, evaluations, prompt management, or production scale, use it. The two tools sit at different points:
| | Langfuse (self-hosted) | AgentTap |
|---|---|---|
| Positioning | Full LLM engineering platform (tracing, evals, prompt mgmt, teams) | Agent-native local tracing for one developer's machines |
| Processes | 6 containers | 1 Node process |
| Storage | Postgres + ClickHouse + Redis + MinIO | 1 SQLite file |
| Dependencies | Docker Compose | protobufjs (only) |
| Setup | env file with 10+ secrets | npx agenttap |
| RAM footprint | ~2 GB+ | ~50 MB |
| Built-in capture | SDKs + OTLP | SDKs + OTLP plus a built-in LLM tracing proxy |
| Semantic conventions | GenAI, OpenInference, Langfuse SDK | GenAI, OpenInference, NeMo Relay |
| Agent nemo_relay.* traces | Stored but Input/Output show null (data buried in Metadata) | Input/Output parsed and rendered natively |
| Data location | Your containers | One local file you can cp, grep, or delete |
And from NeMo Relay: NeMo Relay captures from inside the agent runtime (hooks/plugins) and exports — no storage or UI by design. AgentTap includes its own capture (the network-boundary tracing proxy) plus storage and dashboard, so it works standalone with any agent. When a runtime has deep NeMo Relay integration (like OpenClaw), the two compose: NeMo Relay captures richer runtime detail and exports it into AgentTap's OTLP ingest.
Install
Requires Node.js ≥ 22.13 (uses the built-in node:sqlite — no database server needed).
Run it instantly with npx — no clone, no install:
npx agenttapOr install globally for a persistent agenttap command:
npm install -g agenttap
agenttap
Or from source (to hack on it):
git clone https://github.com/HongguangLi/agenttap
cd agenttap
npm install
npm start
Any of these prints:
AgentTap listening on http://127.0.0.1:4318
  dashboard     http://127.0.0.1:4318/
  OTLP ingest   http://127.0.0.1:4318/v1/traces
  LLM proxy     http://127.0.0.1:4318/proxy/openai -> https://api.openai.com
  db            ~/.agenttap/traces.db
Verify it works — send a synthetic agent trace and open the dashboard:
node examples/send-test-trace.js
# then open http://127.0.0.1:4318
Connect your agent — point its OTLP exporter at http://127.0.0.1:4318/v1/traces, or its provider base URL at http://127.0.0.1:4318/proxy/* (see the per-agent guides below).
Run it persistently (optional) — keep it running across reboots/logouts as a background service. Copy-paste setup for macOS (launchd) and Linux (systemd) is in docs/running-as-a-service.md.
Updating a service install is two steps:
npm install -g agenttap@latestupdates the files, then restart the service to load the new code (systemctl --user restart agenttapon Linux,launchctl kickstart -k gui/$(id -u)/com.agenttapon macOS).
Upgrading to 0.2.0: the database migrates additively on first start — back up
~/.agenttap/traces.dbfirst if you want a rollback path (cpthe file while the service is stopped).
Upgrading to 0.3.0: adds two tables (
scores,evaluators) via the same additive migration on first start — same backup advice as above.
Upgrading to 0.4.0: back up
~/.agenttap/traces.dbbefore the first start (cpthe file while the service is stopped). The first start runs the transcript import, which both migrates the schema additively and grows the database substantially — a measured full import went from 38.8 MB to 187.3 MB. If you don't want transcript content in the database at all, start with--no-import-transcripts.
Upgrading to 0.5.0: adds three token-accounting columns (
cache_read_tokens,cache_write_tokens,input_tokens_total) via the same additive migration on first start — same backup advice as above.
What it understands
Every agent speaks a different OTLP dialect. AgentTap normalizes three semantic conventions into one unified view (model, input/output, token usage, session, user) — spans keep their raw attributes too:
| Convention | Namespace | Emitted by |
|---|---|---|
| OpenTelemetry GenAI | gen_ai.* | OTel auto-instrumentation, Codex, most SDKs |
| OpenInference | llm.*, input.value, openinference.span.kind | Arize/Phoenix ecosystem, NeMo Relay (openinference exporter) |
| NeMo Relay native | nemo_relay.* (incl. *_json payloads) | NeMo Relay (opentelemetry exporter) via OpenClaw etc. |
Unknown spans still get stored and displayed with heuristic typing (llm / tool / agent), so nothing is dropped on the floor.
NeMo Relay's native exporter carries conversation content inside *_json
payload attributes; AgentTap extracts it into first-class structured
input/output. OpenClaw LLM spans get the messages array and the assistant
reply with usage; tool spans get the full request and result. Measured on a
real OpenClaw database: 257/257 LLM spans and 387/387 tool spans yielded
structured content — so the conversation view works for relay traces the
same way it does for transcript-imported Claude Code traces.
Cache token accounting
Every span carries cache_read_tokens, cache_write_tokens, and a
normalized input_tokens_total (added by 0.5.0's migration). The two capture
channels report prompt_tokens with opposite conventions — Anthropic's usage
block counts fresh input only with cache reads additional, while NeMo Relay
reports the total including cache reads — so input_tokens_total is
normalized to fresh + cached for every channel, and
fresh = input_tokens_total − cache_read_tokens holds everywhere. Measured
cache hit rates on a live database: ≈95.8% for claude-code traffic, ≈68.5%
for relay traffic. The dashboard's cache-efficiency panel, the trace-row cost
card, span detail, and conversation meta all read these columns.
Langfuse-compatible ingest path
AgentTap also answers on /api/public/otel/v1/traces — the same path as Langfuse's OTLP endpoint. If your agent is already configured to export to a Langfuse instance, switching to AgentTap is a one-line host change. Authorization headers are accepted (and ignored unless you set --token).
Agent integration guides
CLI
agenttap [options]
agenttap import [--dir <path>] [--since <days>] [--db <path>]

  --port <n>                  Listen port (default 4318, the OTLP/HTTP standard port)
  --host <h>                  Bind address (default 127.0.0.1; use 0.0.0.0 to expose)
  --db <path>                 SQLite file (default ~/.agenttap/traces.db)
  --token <t>                 Require this token on ingest and proxy routes
                              (does NOT protect the dashboard or /api/* — that is --auth)
  --auth <user:pass>          Require HTTP Basic auth on the dashboard and /api/*
                              (separate from --token; ingest paths and /health stay open)
  --openai-upstream <url>     Upstream for /proxy/openai (default https://api.openai.com)
  --anthropic-upstream <url>  Upstream for /proxy/anthropic (default https://api.anthropic.com)
  --dir <path>                Transcript directory (default ~/.claude/projects)
  --since <days>              import only: skip transcripts older than N days (default 0 = all)
  --no-import-transcripts     server mode: don't import or poll transcripts
The import subcommand runs a one-shot transcript import and exits, printing
how many spans came from how many files and how many lines were skipped. In
server mode the import runs on startup and re-polls every 30 seconds unless
--no-import-transcripts is given.
Environment variables: AGENTTAP_PORT, AGENTTAP_HOST, AGENTTAP_DB, AGENTTAP_TOKEN, AGENTTAP_AUTH, AGENTTAP_OPENAI_UPSTREAM, AGENTTAP_ANTHROPIC_UPSTREAM, AGENTTAP_TRANSCRIPT_DIR, plus AGENTTAP_JUDGE_BASE_URL, AGENTTAP_JUDGE_API_KEY, AGENTTAP_JUDGE_MODEL (see Scores & evals). When --token is set, ingest expects it as Authorization: Bearer/Basic <token> and proxy routes expect it as an x-agenttap-token header (Authorization on proxy routes is reserved for the upstream API key). The token does not gate the dashboard or /api/* — that is --auth's job (see Dashboard authentication).
HTTP API
| Method | Path | Description |
|---|---|---|
| POST | /v1/traces | OTLP/HTTP trace ingest (protobuf or JSON) |
| POST | /v1/logs | OTLP logs ingest — log events with model/token data become spans (Claude Code) |
| POST | /v1/metrics | Accepted and ignored (AgentTap visualizes traces, not metrics) |
| POST | /api/public/otel/v1/{traces,logs,metrics} | Langfuse-compatible aliases of the above |
| ANY | /proxy/openai/* | Tracing proxy → --openai-upstream (records LLM calls) |
| ANY | /proxy/anthropic/* | Tracing proxy → --anthropic-upstream (records LLM calls) |
| GET | /api/traces?limit&offset&q&service&session&user&since&model&status&minDuration&maxDuration&minTokens | List traces (aggregated; rows carry input_preview/output_preview and cache-token totals) |
| GET | /api/traces/:traceId | All spans for a trace |
| GET | /api/observations?limit&offset&type&q&since&service&model&status&minDuration&maxDuration&minTokens | Flat list of individual spans |
| GET | /api/sessions | Traces grouped by session |
| GET | /api/users | Traces grouped by end-user |
| GET | /api/stats?since | Totals, per-service and per-model breakdowns |
| GET | /api/timeseries?since&bucket&service&model | Bucketed time series: traces, LLM calls, tokens, cost, errors, latency count/avg/p50/p95 per point (latency fields only on buckets with timed LLM spans) |
| GET | /api/latency?since&service&model | Overall latency percentiles: {count, p50, p90, p95, p99} |
| POST | /api/scores | Add a score: {trace_id, name, value \| string_value, source: "manual"\|"api", span_id?, comment?} |
| GET | /api/scores?trace&name&since&limit&offset | List scores |
| GET | /api/scores/summary?since | Per-name aggregates: {name, count, avg, histogram} |
| DELETE | /api/scores/:id | Delete a score |
| GET/POST | /api/evaluators | List / create evaluators ({name, prompt, score_name}) |
| DELETE | /api/evaluators/:id | Delete an evaluator |
| GET/PUT | /api/settings | Judge endpoint config (API key returned masked; env vars override) |
| POST | /api/judge/run | Run an evaluator: {evaluator_id, trace_ids} (max 100) → per-trace ok/error |
| GET | /health | Liveness check (never gated by --auth) |
| GET | / | Dashboard |
(since is a look-back window in milliseconds; omit or 0 for all time.)
With --auth set, /, /ui/*, and /api/* require HTTP Basic credentials —
except the /api/public/otel/v1/* ingest aliases and /health, which stay on
their own rules (see Dashboard authentication).
Filter parameters combine freely: model matches the span model, status is
ok or error, minDuration/maxDuration are in milliseconds, and
minTokens is a total-token floor. On /api/timeseries, bucket is the
bucket width in milliseconds (auto-sized from since when omitted).
q searches names, inputs, and outputs via SQLite FTS5 (terms are ANDed,
prefix-matched; model names match via LIKE), falling back to plain LIKE when
FTS5 isn't available or the query contains characters outside letters, digits,
spaces, and ._-. On the FTS5 path, mid-word substrings and non-prefix CJK
fragments no longer match.
Avoid manual VACUUM on traces.db: it can renumber rowids and desync
full-text search. AgentTap checks for this at startup and rebuilds the index
automatically; if search ever looks stale mid-run, restart AgentTap (or drop
the spans_fts table and reopen — the backfill re-runs on open).
Design principles
- Local-first. Binds to loopback by default. Your prompts and outputs never leave your machine.
- Zero infrastructure. No Docker, no database server, no message queue.
node:sqlitein WAL mode handles a developer's trace volume with ease. - Protocol over product. Standard OTLP in; if you outgrow this tool, re-point the same exporter at Langfuse, Phoenix, Jaeger, or any OTLP backend. No lock-in either direction.
- Dialect-tolerant. Semantic conventions are treated as hints, not requirements. Raw attributes are always preserved and inspectable.
Non-goals
Team collaboration, prompt management, production-scale ingestion, full eval pipelines (datasets, experiment runs, regression tracking — AgentTap's scores are trace annotations, not an experimentation platform). That's Langfuse's territory — graduate to it when you need it.
License
Apache-2.0. Not affiliated with Langfuse GmbH or NVIDIA; named in homage to the two projects that inspired the architecture.