
agentxray
v0.3.0
Published
DevTools for your AI agents - see where your agent burns time, tokens and money.

Maintainers
 mert7nr
Readme
agentxray

DevTools for your AI agents — find out where your agent burns time, tokens and money.
Your coding agent worked for 20 minutes and you have no idea what happened in between. agentxray reads the session transcript and shows you: which tools ran, where they failed, where the agent got stuck in a loop, and what it all cost.
Pointed at 56 real Claude Code sessions — 2,992 tool calls across 9 projects over 20 days — here is what it found:
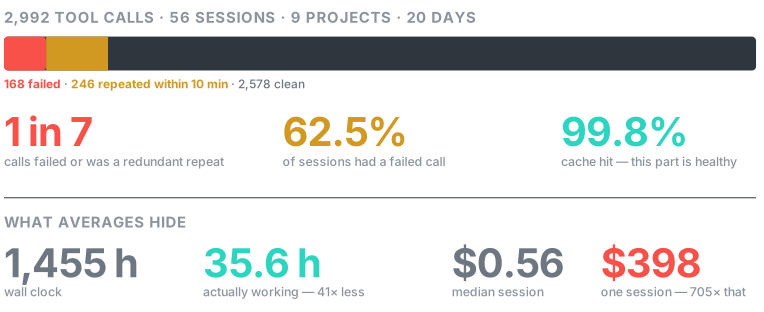
Every number above is reproducible on your own machine with npx agentxray benchmark. Method, caveats and the full table: docs/BENCHMARK.md.

Run it inside your agent (MCP)
agentxray also runs as an MCP server, so Claude Code, Cursor, or any MCP client can inspect the current session instead of a human running the CLI afterward.
{
  "mcpServers": {
    "agentxray": { "command": "npx", "args": ["agentxray", "mcp"] }
  }
}
Then just ask the agent: "how much did this session waste?" — it calls find_waste and reads the transcript that's still open. Three tools are exposed: analyze_session, find_waste, generate_report. All default to the most recently modified transcript on the machine if you don't name one.
Why
AI agents are black boxes. You give Claude Code a task, it runs hundreds of tool calls, and all you see is the final answer. When something goes wrong — a task that took 3× longer than it should, a bill that surprised you — the evidence is buried in a JSONL file nobody wants to read. agentxray is the window into that box, the way browser DevTools is a window into a webpage.
Install
npx agentxray stats <transcript.jsonl>Usage
Claude Code stores session transcripts under ~/.claude/projects/. Point agentxray at one:
# The full breakdown: tokens, cost, tools, loop smells
agentxray stats ~/.claude/projects/my-project/session.jsonl

# Timeline: every message and tool call, in order
agentxray view ~/.claude/projects/my-project/session.jsonl

# Machine-readable
agentxray stats session.jsonl --json
Real output from a real session:
session  1375 events, 830 assistant turns
tokens
  output            999,728
  cache read    142,094,564
  cache hit           99.9%  (healthy)
  est. cost          $92.44
tools
  Bash                    114 calls 15 errors
  Edit                     57 calls
⚠ repeated calls (possible loops)
  8× within 10min  Bash: python -m pytest tests/ -q
  13× within 10min Edit: src/orchestrator/intent.py
That warning section is the point: the same test command running 8 times in 10 minutes means the agent was stuck. Now you know where.
Session x-ray
agentxray report session.jsonl writes a single self-contained HTML file — no server, no network — with a call-by-call timeline strip (color-coded clean/repeated/failed), a tool breakdown, and the loop bursts. Open it in a browser or attach it to a PR as the receipt for "the agent got stuck here."
agentxray report session.jsonl -o report.htmlWhat it detects
| Signal | What it means | |---|---| | Loop smells | Identical tool call repeated 3+ times within 10 minutes. Spread-out repeats (normal iteration) don't flag. | | Cache hit ratio | Below ~50% means cold context — you're paying full price for tokens that could be cached. | | Tool error rates | A tool failing 30% of the time is where your agent's minutes go. | | Cost estimate | Per-model pricing, including cache read/write rates. Unknown models are reported, never guessed. |
Supported formats
- ✅ Claude Code session transcripts (
~/.claude/projects/**/*.jsonl) - 🔜 LangChain, OpenAI agents, OTel GenAI — the adapter layer is format-agnostic; open an issue for the format you need
How it works
Transcripts are parsed into a normalized event model (streaming, tolerant of unknown line types — unparseable lines are counted and reported, never silently dropped). Everything downstream — stats, timeline, loop detection — only sees that model, so new formats are one adapter away.
Two runtime dependencies (@modelcontextprotocol/sdk, zod), needed only for the mcp command. Your transcripts never leave your machine — every tool call, stats, report, and MCP response is computed locally.
License
MIT