
ai-live-log-bridge
v1.4.3
Published
A bridge between AI assistants and your live logs. Monitors terminal output and browser console/network activity. Run commands with `ai` and your AI can read the logs automatically.
Downloads
157
Maintainers
 flowengine.cloud
Readme
AI Live Log Bridge
Give your AI complete visibility into your development environment- terminal and browser.
A bridge between AI coding assistants and your live logs. Monitor and fix terminal commands, browser console logs, and network requests automatically.
Table of Contents
Quick Start Guides
Documentation
- The Problem
- The Solution
- MCP Tools
- What Gets Monitored
- Real-World Examples
- Configuration
- Security
- Troubleshooting
- FAQ
The Problem
Modern AI coding creates a "Split Brain" development experience. You work in one environment, the AI works in another, and neither side can clearly see what the other is doing.
1. The AI is Blind to Your Terminal
When you run code in your main terminal, the AI has zero visibility.
It cannot see your server logs, runtime errors, or test failures.
The Pain: You are forced into a loop of manual copy-pasting just to give the AI eyes.
2. You are Blind to the AI's Terminal
AI tools often execute commands in hidden tabs, cramped side panes, or background threads.
It is hard to follow the live execution, catch warnings, or see the full colored output.
The Pain: You lose control of your environment because you can't easily monitor what the AI is actually running.
3. The AI is Blind to Your Browser
When debugging frontend issues, the AI cannot see browser console errors, network failures, or JavaScript exceptions.
You must manually open DevTools (F12), switch between Console and Network tabs, and copy-paste everything.
The Pain: Frontend debugging becomes a multi-step manual process: check console → copy error → check network → copy request → check server logs → copy again.
4. The Broken Feedback Loop
Because of these blind spots, the AI blindly assumes its code works as long as the syntax is correct.
It marks tasks as "Fixed" while your local server is crashing or your browser is throwing errors.
The Pain: You are the only one checking reality, manually bridging the gap between three disconnected worlds: your terminal, the AI's terminal, and your browser.
The Solution
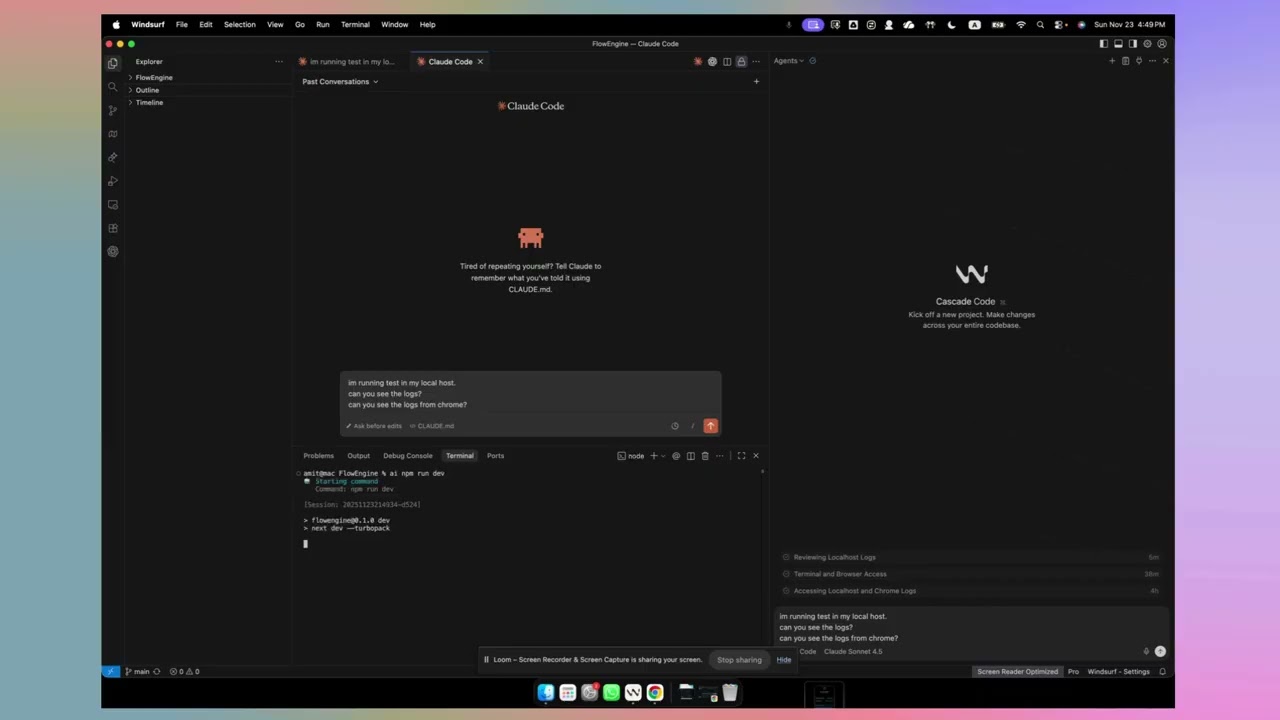
AI Live Log Bridge creates automatic visibility into BOTH your terminal AND browser:
Terminal Monitoring
- Wrap commands with
ai npm test- everything gets logged - AI reads logs automatically via MCP tools
- No more copy-pasting terminal output
Browser Monitoring
- Chrome extension captures console logs automatically
- Network requests monitored in real-time
- AI reads browser errors directly
- No more copy-pasting from F12 DevTools
Unified AI Debugging
You: "Login button doesn't work"

AI: [Calls view_browser_logs]
    [Calls view_logs]

AI: "I see three issues:
1. Frontend: TypeError at UserProfile.jsx:42
2. Network: POST /api/login → 401
3. Backend: Authentication token expired

Here's the complete fix..."
No scrolling. No copy-pasting. AI sees everything.
Setup Guides
Claude Desktop / Claude Code Setup
1. Install the tool
npm install -g ai-live-log-bridge2. Configure Claude
Edit ~/Library/Application Support/Claude/claude_desktop_config.json:
{
  "mcpServers": {
    "ai-live-log-bridge": {
      "command": "ai",
      "args": ["--server"]
    }
  }
}
Restart Claude Desktop/Claude Code completely.
3. Install Chrome Extension (Optional - for browser monitoring)
Install from Chrome Web Store: AI Live Terminal Bridge
Then run the native host setup:
npm run install-native-host4. Test It
ai echo "Hello Claude"
# Ask Claude: "What's in the terminal logs?"
Cursor Setup
1. Install the tool
npm install -g ai-live-log-bridge2. Configure Cursor
Settings → Features → Model Context Protocol:
{
  "ai-live-log-bridge": {
    "command": "ai",
    "args": ["--server"]
  }
}
Restart Cursor completely.
3. Install Chrome Extension (Optional - for browser monitoring)
Install from Chrome Web Store: AI Live Terminal Bridge
Then run the native host setup:
npm run install-native-host4. Test It
ai echo "Hello Cursor"
# Ask Cursor: "What's in the terminal logs?"
Windsurf Setup
1. Install the tool
npm install -g ai-live-log-bridge2. Configure Windsurf
Navigate to MCP configuration in settings:
{
  "ai-live-log-bridge": {
    "command": "ai",
    "args": ["--server"]
  }
}
Restart Windsurf completely.
3. Install Chrome Extension (Optional - for browser monitoring)
Install from Chrome Web Store: AI Live Terminal Bridge
Then run the native host setup:
npm run install-native-host4. Test It
ai echo "Hello Windsurf"
# Ask Windsurf: "What's in the terminal logs?"
Cline Setup
1. Install the tool
npm install -g ai-live-log-bridge2. Configure Cline
VS Code Settings → Extensions → Cline → MCP Settings:
{
  "ai-live-log-bridge": {
    "command": "ai",
    "args": ["--server"]
  }
}
Restart VS Code completely.
3. Install Chrome Extension (Optional - for browser monitoring)
Install from Chrome Web Store: AI Live Terminal Bridge
Then run the native host setup:
npm run install-native-host4. Test It
ai echo "Hello Cline"
# Ask Cline: "What's in the terminal logs?"
Cody Setup
1. Install the tool
npm install -g ai-live-log-bridge2. Configure Cody
Cody Settings → MCP Configuration:
{
  "ai-live-log-bridge": {
    "command": "ai",
    "args": ["--server"]
  }
}
Restart your IDE completely.
3. Install Chrome Extension (Optional - for browser monitoring)
Install from Chrome Web Store: AI Live Terminal Bridge
Then run the native host setup:
npm run install-native-host4. Test It
ai echo "Hello Cody"
# Ask Cody: "What's in the terminal logs?"
Other MCP Tools Setup
For Continue, Zed, or any MCP-compatible tool:
1. Install the tool
npm install -g ai-live-log-bridge2. Add MCP Configuration
Find your tool's MCP settings and add:
{
  "ai-live-log-bridge": {
    "command": "ai",
    "args": ["--server"]
  }
}
3. Install Chrome Extension (Optional - for browser monitoring)
Install from Chrome Web Store: AI Live Terminal Bridge
Then run the native host setup:
npm run install-native-host4. Restart your tool and test
Seven Powerful MCP Tools
Terminal Monitoring
view_logs - View all recent terminal output
- Full command history, output, errors
- Use when: "What's in the logs?" or "What happened?"
get_crash_context - View only errors and crashes
- Filtered error lines, exceptions, stack traces
- Use when: "What caused the crash?"
auto_fix_errors - Automatically detect and analyze ALL errors
- Scans all failures, provides specific fixes
- Use when: "Auto fix this"
get_usage_instructions - Get comprehensive usage guide
- Installation, troubleshooting, best practices
- AI calls automatically when confused
Browser Monitoring
view_browser_logs - View browser console logs and network activity
- Console logs (log, warn, error) + network requests
- Use when: "What's happening in the browser?"
get_browser_errors - View only browser errors and failed requests
- Only console.error, exceptions, HTTP 4xx/5xx errors
- Use when: "Any errors in the browser?"
get_browser_instructions - Get browser setup and troubleshooting guide
- Extension installation, connection help
- AI calls when browser monitoring isn't working
What Gets Monitored?
Terminal Monitoring
✅ All Command Output
- stdout and stderr (colors preserved in terminal)
- Exit codes
- Timestamps
- Full command history
✅ Secret Redaction
- API keys →
[REDACTED] - Tokens →
[REDACTED] - Passwords →
[REDACTED] - Database credentials →
[REDACTED] - 15+ secret patterns covered
✅ Session Isolation
- Each command gets unique session ID
- Parallel commands don't interleave
- Clean, organized logs
Browser Monitoring
✅ Console Logs
- console.log(), console.warn(), console.error(), console.debug()
- JavaScript errors with full stack traces
- Unhandled promise rejections
✅ Network Activity
- Fetch and XMLHttpRequest calls
- HTTP methods, URLs, status codes
- Request/response timing
- Failed requests (4xx, 5xx errors)
✅ Performance Metrics (Optional)
- Memory usage
- Page load times
✅ Security
- Development sites only - Monitors
localhost:*,127.0.0.1:*, and development tunnels (ngrok, localtunnel, Cloudflare Tunnel) - Cannot access regular websites (Google, GitHub, production sites, etc.)
- Cookies redacted
- Authorization headers redacted
- All data stays on your machine
Real-World Examples
Example 1: Test Failures
Before:
npm test
# 15 tests fail
# You scroll, copy first error
# AI asks for more context
# You copy more errors
# AI asks about line 47
# Repeat...
After:
ai npm test
# 15 tests fail

You: "Auto fix this"
AI: [Calls auto_fix_errors]
AI: "Found 15 test failures:
1. TypeError at user.test.ts:42 - Add null check
2. ReferenceError at api.test.ts:15 - Import mockData
3. Port 3000 EADDRINUSE - Kill existing process
[...and 12 more with specific fixes]

Would you like me to apply these fixes?"
No scrolling. No copy-pasting. AI sees ALL errors at once.
Example 2: Frontend Bug
Before:
You: "Login button doesn't work"
AI: "Check the browser console"
You: [F12, copies] "TypeError: Cannot read property 'id'"
AI: "Check the network tab"
You: [Network, copies] "POST /api/login → 401"
AI: "Check server logs"
You: [Terminal, scrolls, copies] "Invalid token"
After:
You: "Login button doesn't work"

AI: [Calls view_browser_logs]
    [Calls view_logs]

AI: "I see the complete picture:
- Frontend: TypeError at UserProfile.jsx:42 (missing null check)
- Network: POST /api/login → 401 Unauthorized
- Backend: Authentication token expired

Here's the fix for all three layers..."
AI sees terminal AND browser. Instantly.
Example 3: Hidden Terminal Problem
Before:
# Claude Code runs in hidden terminal
npm run dev

# You try to run your app
npm start
# Error: EADDRINUSE port 3000

# You have no idea what's running
# AI can't see the hidden terminal
After:
# Run with ai wrapper
ai npm run dev

You: "What's on port 3000?"
AI: [Calls view_logs]
AI: "Your dev server is running on port 3000 (started 2 minutes ago)"
How It Works
Terminal Flow
You run: ai npm run dev
       ↓
Terminal shows full output (colors preserved)
       ↓
Session isolation: unique session ID
       ↓
Secret redaction: API_KEY=sk-xxx → [REDACTED]
       ↓
Logs written to: ~/.mcp-logs/active/session-<id>.log
       ↓
AI reads via: view_logs / auto_fix_errors / get_crash_context tools
Browser Flow
You open: localhost:3000 in Chrome
       ↓
Extension captures: console logs, network requests, errors
       ↓
Sent to: Native messaging host (Node.js)
       ↓
Secret redaction: Cookies/tokens → [REDACTED]
       ↓
Logs written to: ~/.mcp-logs/browser/active/browser-<id>.log
       ↓
AI reads via: view_browser_logs / get_browser_errors tools
Configuration
Log Retention
Control how long logs are kept using AI_KEEP_LOGS environment variable (in days):
# Delete logs immediately when command completes (cleanest)
export AI_KEEP_LOGS=0

# Keep logs for 1 day (default)
export AI_KEEP_LOGS=1

# Keep logs for 7 days
export AI_KEEP_LOGS=7

# Keep logs for 30 days
export AI_KEEP_LOGS=30
Why control retention?
AI_KEEP_LOGS=0: AI only sees live/running commands (cleanest, recommended for LLMs)AI_KEEP_LOGS=1: Keep recent logs for debugging (balanced, default)AI_KEEP_LOGS=7+: Keep logs longer for audit trails
CLI Mode (For Non-MCP Tools)
If your AI tool doesn't support MCP (Aider, Continue, older tools), use CLI mode:
Setup
Create .prompts/ai-wrapper.md (or .cursorrules, .windsurfrules, etc.):
# Terminal Command Rules

Always run terminal commands using the `ai` wrapper.

Format: ai <command>

Examples:
- ai npm test
- ai npm start
- ai python script.py

When debugging, run `ai --last 200` to see recent output.
Usage
# Run commands with ai wrapper
ai npm test

# AI manually reads logs
ai --last 100

# Watch live in another terminal
ai live
MCP mode is recommended - automatic, faster, more powerful.
Security Features
Secret Redaction
Terminal patterns (15+):
- API keys: AWS, GitHub, OpenAI, Anthropic, Stripe
- Tokens: Bearer, JWT, session tokens
- Passwords: Database URLs, export statements
- Private keys: PEM, OpenSSH
- Credit cards: Basic validation
Browser patterns (12+):
- Cookies: Session IDs, auth cookies
- Headers: Authorization, X-API-Key, Set-Cookie
- Storage: localStorage/sessionStorage tokens
- JSON responses: access_token, refresh_token
- Session IDs: PHPSESSID, JSESSIONID
How it works:
- Secrets redacted BEFORE writing to logs
- Your terminal shows real output
- Logs contain
[REDACTED] - Secrets never reach AI models
Session Isolation
- Each terminal command → unique session ID
- Each browser session → unique session ID
- Parallel commands don't interleave
- Clean, organized logs per task
Project-Based Filtering
- Logs filtered by project directory (
process.cwd()) - AI only sees logs from current project
- No cross-project contamination
Troubleshooting
ai: command not found
Restart terminal:
hash -r   # Bash/Zsh
rehash    # Fish
MCP tools not showing up
- Check JSON syntax in config
- Run
which aito verify installation - Test:
ai --servershould start without errors - Restart AI tool completely
Extension not connecting
- Make sure you installed from Chrome Web Store: AI Live Terminal Bridge
- Run:
npm run install-native-host - Refresh your localhost page
No browser logs appearing
- Make sure you're on a localhost page
- Extension only monitors
localhost:*and127.0.0.1:* - Check extension enabled in chrome://extensions/
- Try:
cat ~/.mcp-logs/browser/active/*.log
FAQ
Does this slow down my commands?
No. Overhead is less than 1ms. Commands run at full speed.
Can I see the logs manually?
Yes:
# Terminal logs
ls ~/.mcp-logs/active/
cat ~/.mcp-logs/active/session-*.log

# Browser logs
ls ~/.mcp-logs/browser/active/
cat ~/.mcp-logs/browser/active/browser-*.log

# View all recent (terminal and browser)
ai --last 100
What if I forget to use ai?
Commands still work, just won't be logged. AI won't be able to read output.
Does browser monitoring work on all sites?
No - development sites only (by design, for security):
- ✅
localhost:3000,localhost:8080, etc. - ✅
127.0.0.1:* - ✅
https://*.ngrok.io(ngrok tunnels) - ✅
https://*.ngrok-free.app(ngrok free) - ✅
https://*.loca.lt(localtunnel) - ✅
https://*.trycloudflare.com(Cloudflare Tunnel) - ❌ Regular websites (google.com, github.com, etc.)
- ❌ Production sites
This prevents the extension from tracking your general browsing while supporting common development workflows like ngrok for mobile testing, webhook testing, and sharing with teammates.
Want to add custom domains? See Custom Domains Guide for instructions on adding staging environments, Vercel/Netlify previews, or other tunnel services.
Does this work with Docker?
Yes. ai docker-compose up, ai docker run, etc. all work.
Can other AI tools use this?
Yes!
- MCP Mode: Any AI supporting Model Context Protocol
- CLI Mode: Any AI with terminal access
Works with: Claude Desktop, Claude Code, Cursor, Windsurf, Aider, Continue, ChatGPT with code interpreter, and more.
What about CI/CD?
This is designed for local development. In CI, use native logging.
Uninstall
# Remove tool
npm uninstall -g ai-live-log-bridge

# Remove logs
rm -rf ~/.mcp-logs

# Remove Chrome extension
# Go to chrome://extensions/ and remove "AI Live Terminal Bridge"
Remove from your AI tool's MCP config if added.
License
MIT License - See LICENSE for details.
Contributing
Issues and PRs welcome at GitHub.
Stop coding blind. Give your AI complete visibility - terminal AND browser.