
altech-run-api-inspector
v1.0.3
Published
Mini API/network inspector overlay for React Native apps (fetch + axios) during development.
Downloads
124
Maintainers
 altech2026
Readme
altech-run-api-inspector
altech-run-api-inspector is a React Native debugging package to inspect API traffic directly from your app runtime.
It helps teams debug fetch and axios requests without depending on Flipper, Reactotron, or extra native plugins.
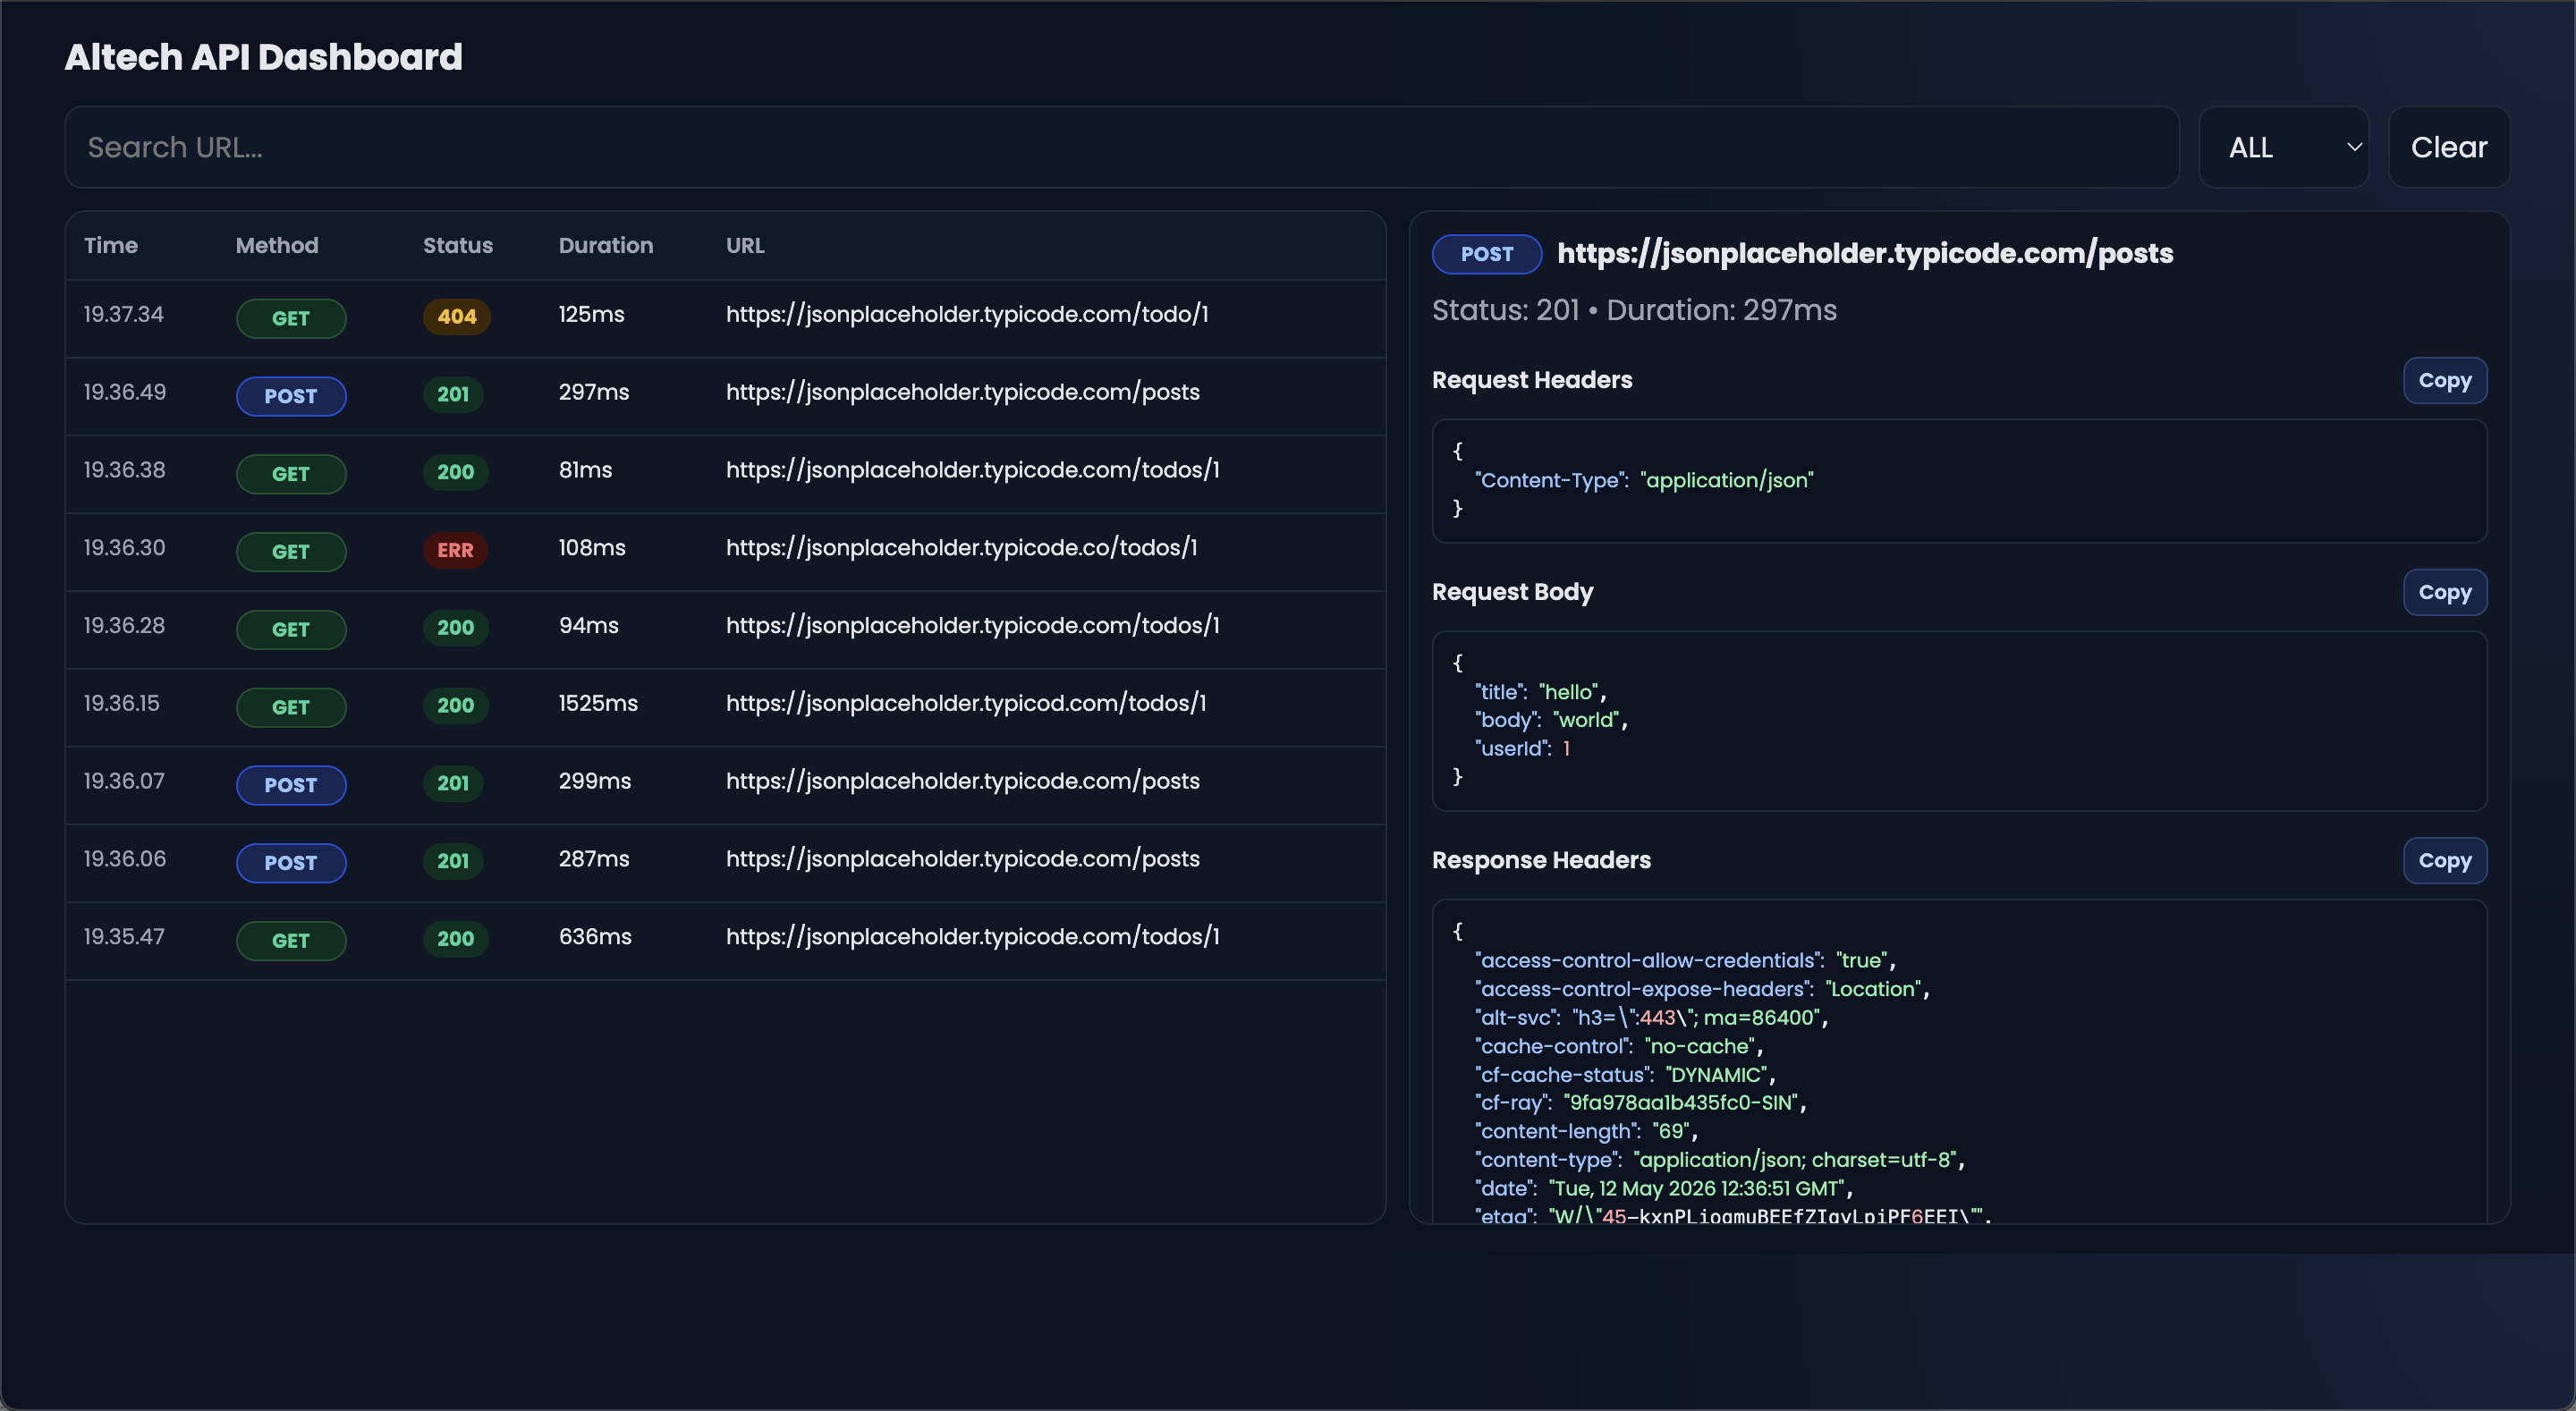
Dashboard preview
This is the current browser dashboard UI:
Why use this package
Most React Native API debugging workflows are fragmented:
- one tool for network logs
- another tool for request body/headers
- extra setup for emulator/device bridge
This package gives one focused workflow for API inspection with minimal setup and safe dev-only behavior.
Main advantages
- Works in app runtime (
fetch+axios) - Dev-safe by default (
__DEV__guard) - Multiple output modes:
- in-app overlay UI
- Metro console
- browser dashboard
- Request details ready for debugging:
- method, URL, status, duration
- request/response headers
- request/response body
- error message
- Productivity helpers:
- search and status filter
- clear logs
- retry request
- copy JSON
- open URL in browser (absolute URL only)
What you can inspect
GET,POST,PUT,PATCH,DELETE, and other HTTP methods- Status groups with colors (
2xx,3xx,4xx,5xx) - Network errors (timeout/offline/server unreachable)
- JSON payloads with formatted output
Choose your workflow
1) Browser dashboard (recommended for no-UI-trigger debugging)
Use this when you want logs in browser table view and do not want to open inspector from in-app floating button.
2) In-app overlay UI
Use this when you want to inspect requests directly inside the app screen (floating API button).
3) Console mode
Use this when you prefer terminal-first logs in Metro.
Installation
npm install altech-run-api-inspector zustand @react-native-clipboard/clipboardIf your app uses Axios:
npm install axiosStage-by-stage setup (recommended)
This is the fastest setup for most teams. The setup command is optional, but it is the easiest path for browser dashboard workflow.
Step 1: Run auto setup
npx altech-api-inspector setupThis generates:
scripts/altech-api-inspector-dashboard.jsscripts/altech-api-inspector-adb-reverse.jsapi-inspector.bootstrap.js
And updates:
- app entry import (
import './api-inspector.bootstrap';) package.jsonscripts:api-inspector:dashboardapi-inspector:reverseapi-inspector:startapi-inspector:dev
Important:
- Generated bootstrap is configured for dashboard-first flow.
- It forwards logs to browser dashboard automatically.
- It does not require floating button trigger.
- It does not print full API payload logs to Metro terminal.
Step 2: Install any newly added deps
npm installStep 3: Start dashboard + Metro
npm run api-inspector:devStep 4: Run your app
npm run android
# or
npm run ios
Step 5: Verify it works
In terminal, you should see something like:
[dashboard] running at http://localhost:3939[dashboard] received #1 GET 200 ...
In browser dashboard, request rows should appear automatically when API calls happen.
This is already a dashboard-only workflow for daily use.
Manual integration (without setup CLI)
Use this section only if you want custom behavior. If you are happy with browser dashboard, you can keep using auto setup and skip manual mode configuration.
In-app UI mode
import { AltechApiInspector } from "altech-run-api-inspector";

export default function App() {
  return (
    <>
      <MainApp />
      {__DEV__ && <AltechApiInspector />}
    </>
  );
}
Console-only mode (no floating button)
import { useEffect } from "react";
import { initApiInspector } from "altech-run-api-inspector";

export default function App() {
  useEffect(() => {
    const cleanup = initApiInspector({
      mode: "console",
      maxLogs: 100,
      console: {
        verbosity: "compact",
        maxBodyLength: 800,
      },
    });

    return cleanup;
  }, []);

  return <MainApp />;
}
Both UI + console
<AltechApiInspector mode="both" />Axios integration
For default axios import:
import axios from "axios";
import { attachAxiosInspector } from "altech-run-api-inspector";

if (__DEV__) {
  attachAxiosInspector(axios, { mode: "console" });
}
For custom axios instances (axios.create), call attachAxiosInspector(instance) for each instance.
API reference
AltechApiInspector props
type AltechApiInspectorProps = {
  enabled?: boolean;
  maxLogs?: number;
  position?: "bottom-right" | "bottom-left" | "top-right" | "top-left";
  defaultOpen?: boolean;
  allowOpenInBrowser?: boolean;
  allowCopy?: boolean;
  mode?: "ui" | "console" | "both";
  showFloatingButton?: boolean;
  console?: {
    maxBodyLength?: number;
    verbosity?: "compact" | "detailed";
    showHeaders?: boolean;
    showTimestamp?: boolean;
    onLog?: (log: ApiLog) => void | Promise<void>;
  };
};
Note:
mode("ui" | "console" | "both") is relevant when you use component/manual integration directly.- For auto setup dashboard flow, you usually do not need to touch
mode.
Defaults:
enabled = __DEV__maxLogs = 100position = "bottom-right"defaultOpen = falseallowOpenInBrowser = trueallowCopy = truemode = "ui"showFloatingButton = true
initApiInspector(options)
type InitApiInspectorOptions = {
  enabled?: boolean;
  maxLogs?: number;
  mode?: "ui" | "console" | "both";
  interceptFetch?: boolean;
  console?: ConsoleLoggerOptions;
};
Default behavior:
enabled = __DEV__mode = "console"interceptFetch = true
Returns cleanup function.
Exported functions
AltechApiInspectorinitApiInspector(options?)attachFetchInspector(options?)restoreFetchInspector()isFetchInspectorAttached()attachAxiosInspector(axiosInstance, options?)
Browser dashboard behavior
When using setup CLI dashboard flow:
- dashboard starts at
3939by default - if port is busy, it auto-fallbacks to
3940,3941, etc. - app-side forwarding scans the same range
- method badges are colorized (
GET,POST,PUT,PATCH,DELETE, etc.) - JSON detail blocks support per-section copy buttons
Environment vars:
API_INSPECTOR_DASHBOARD_PORT(default3939)API_INSPECTOR_DASHBOARD_HOSTAPI_INSPECTOR_DASHBOARD_SCAN(default20)API_INSPECTOR_DASHBOARD_TIMEOUT_MS(default700)
Troubleshooting
Dashboard is empty
- Ensure app actually sends requests.
- Ensure dashboard terminal shows
[dashboard] received #.... - Restart clean:
npx altech-api-inspector setup --force
pkill -f "altech-api-inspector-dashboard.js" || true
pkill -f "react-native.*start" || true
npm run api-inspector:dev- Hard refresh browser (
Cmd+Shift+Ron macOS).
Port already in use (EADDRINUSE)
Kill old process or let dashboard fallback.
Check active ports:
lsof -nP -iTCP:3939 -sTCP:LISTEN
lsof -nP -iTCP:3940 -sTCP:LISTEN
Android device/emulator cannot reach dashboard
- Emulator usually uses
10.0.2.2. - Physical Android requires
adb reverse. api-inspector:startalready runs reverse for8081and dashboard ports.
Metro stuck at 70-90% bundle
Usually not an inspector issue. Wait until app is loaded and then trigger API calls.
Security notes
- Development-only by design (
__DEV__checks). - No persistent storage by default (in-memory logs).
- Do not intentionally expose secrets in dev payloads if avoidable.
- Disable inspector in production builds.
Dashboard layout notes
Dashboard includes:
- left panel: searchable request table (time, method, status, duration, URL)
- right panel: selected request details with copy buttons per section
- status and method color badges for quick scanning
Roadmap
- Export/import logs
- HAR-like output support
- Optional request grouping
- Optional plugin hooks for custom transport targets
License
MIT
Links
- Repository:
https://github.com/Luxxn12/altech-run-api-inspector - Issues:
https://github.com/Luxxn12/altech-run-api-inspector/issues
Keywords
- react-native
- api-inspector
- network-inspector
- fetch-interceptor
- axios-interceptor
- debugging-tools
- devtools
- api-monitoring
- mobile-debugging
- altech