
angular-gantt-chart
v1.2.0
Published
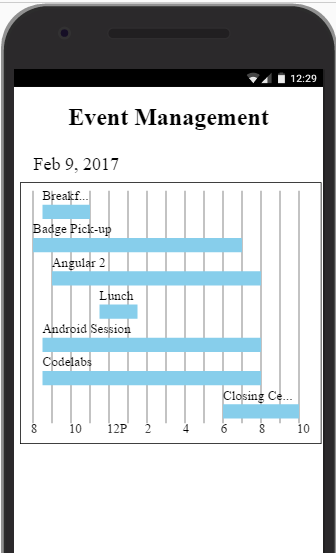
This library can be used in Angular 2 application for creating responsive gantt chart. The chart component consists of inline SVG. The component accepts input data from child component using input decorator of Angular 2.
Downloads
62


Keywords
Readme
angular-gantt-chart
This library can be used in Angular 2 application for creating responsive gantt chart. The chart component consists of inline SVG. The component accepts input data from child component using input decorator of Angular 2.
Angular2
The sources for this package are in (https://github.com/kumarranjansingh/angular-gantt-chart) repo. Please file issues and pull requests against this repo.
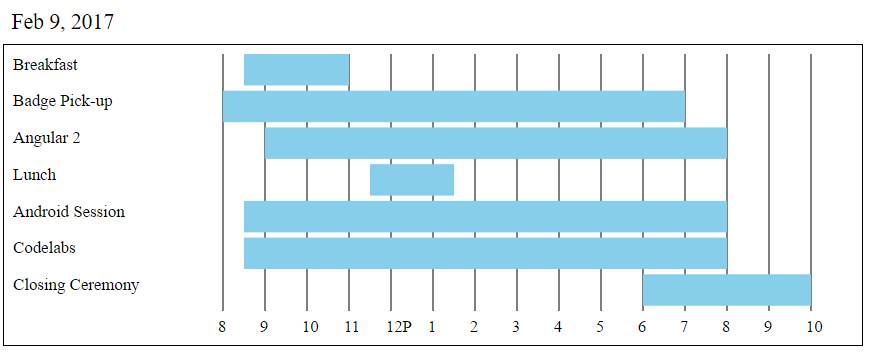
Demo Output
Installation
To install this library, run:
$ npm install angular-gantt-chart --saveHow to use this library
After installing this library, you can import your library in any Angular application by running:
$ npm install angular-gantt-chartand then from your Angular AppModule:
import { BrowserModule } from '@angular/platform-browser';
import { NgModule } from '@angular/core';
import { AppComponent } from './app.component';

// Import your library
import { GanttChart } from 'angular-gantt-chart';
@NgModule({
  declarations: [
    AppComponent
  ],
  imports: [
    BrowserModule,

    // Specify GanttChart library as an import
    GanttChart
  ],
  providers: [],
  bootstrap: [AppComponent]
})
export class AppModule { }
Once the library is imported,
<!-- one can now use this library component in app.component.html -->
<h1> Event Management</h1>
<div  [chartData]="gantt_ChartData" [chartOptions]="gantt_chart_options" GanttChart>
</div>
<!-- gant_chartData and gantt_chart_options has to be supplied from the componet class -->
Format of Data and Chart Options
export class AppComponent {
public gantt_ChartData={
"date":"2017-02-09",
"taskArray":[
{
"task":"Breakfast",
"startTime":"8:30am",
"endTime":"11:00am"
},
{
"task":"Badge Pick-up",
"startTime":"8:00am",
"endTime":"7:00pm"
},
{
"task":"Angular 2",
"startTime":"9:00am",
"endTime":"8:00pm"
},
{
"task":"Lunch",
"startTime":"11:30am",
"endTime":"1:30pm"
},
{
"task":"Android Session",
"startTime":"8:30am",
"endTime":"8:00pm"
},
{
"task":"Codelabs",
"startTime":"8:30am",
"endTime":"8:00pm"
},
{
"task":"Closing Ceremony",
"startTime":"6:00pm",
"endTime":"10:00pm"
}
]
}
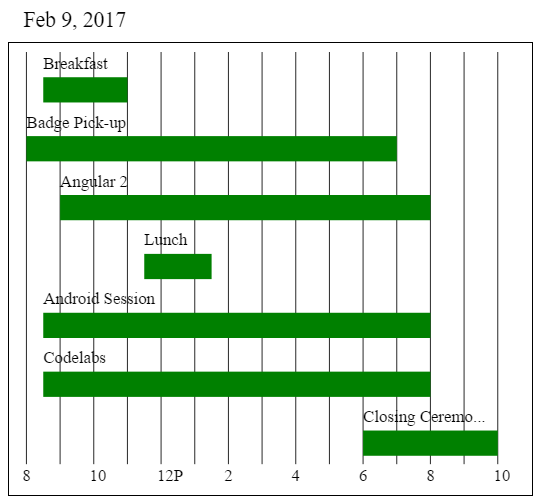
public gantt_chart_options={
rectColor:"red", //Hex code or color name can be given
lineColor:"black",
labelColor:"green"
}
}License
MIT © Ranjan Singh