
angular-performance
v0.1.1
Published
AngularJS directive to measure perceived page load time

Readme
##Page Load vs Perceived Page Load
In a traditional page, measuring the page performance is quite easy; a request is made, the server responds with some HTML and the browser renders it. Done.
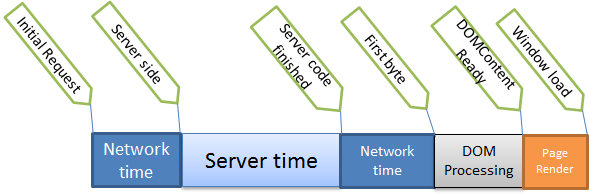
A lot of the rendering logic is taken care of as part of the server processing and so looking at Window Load and DOMContentReady are good indicators of page performance.
In a Single Page Application, things get trickier. The Window Load is only the beginning - that's when the JavaScript has been delivered to the browser, at which point the client-side logic - all the real work - kicks in and begins rendering the page, making API calls and setting up listeners, events, etc.
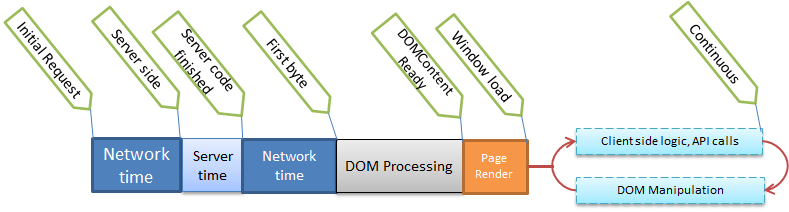
The DOM is then continuously manipulated as part of user interaction or monitoring, polling and other events. As you can see, the traditional definition of a page being 'done' doesn't apply here.
The perceived page performance is how long the user thinks the major elements of the page took to load. By definition it is highly subjective - some users may think that the page is loaded just because the initial furniture appears. But for most users this will be the parts of the page they consider most important.
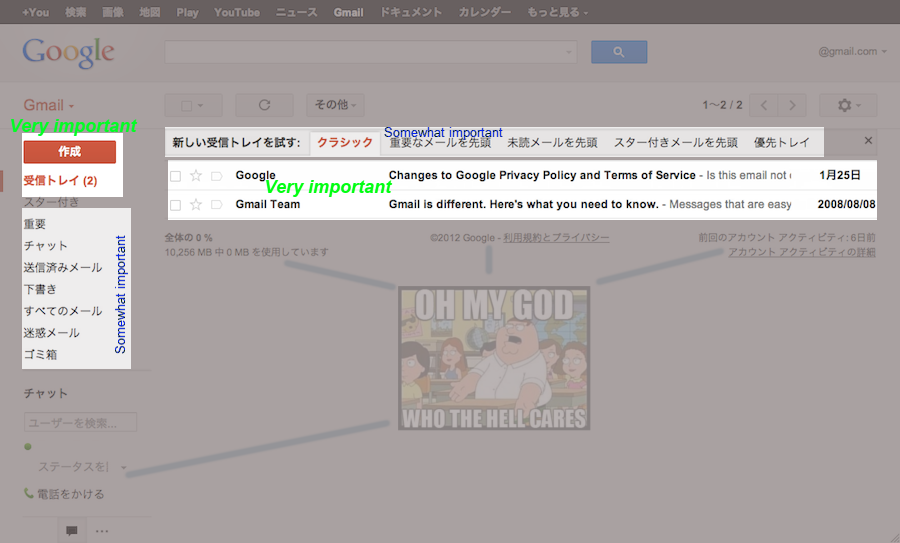
Taking GMail as an example, most users will consider the page ready when the list of emails appear. Whether or not the social tabs, filters, navigation or GTalk appears is less important.
Similarly, on a news website, the title and body of the news article matter the most. Related articles and featured stories aren't that important, but top stories may matter.

The images above are just examples with arbitrarily assigned regions of importance. The point here is, the definition of page done has to be defined on a per-case basis. The most common definition is usually something like "The page is done when this particular div is filled with content" - indicating that the page loaded, an API call was made and the contents were rendered. On a heavier page, this would be when three or four divs have all been filled with content. You could even choose to ignore certain parts of the page as being less important.
##So how do we measure perceived page performance?
The perceived page load is when all of the important dynamic parts of the page have been filled. This requires the developers to agree upon what the most important parts are, and to programmatically indicate when the specific portions are done. It's an inexact science and the results will vary from user to user due to machine specs, network latency and other environmental factors, but you get a good idea of the timings involved and what users are actually experiencing.
Because this is a client side operation, a few components are required:
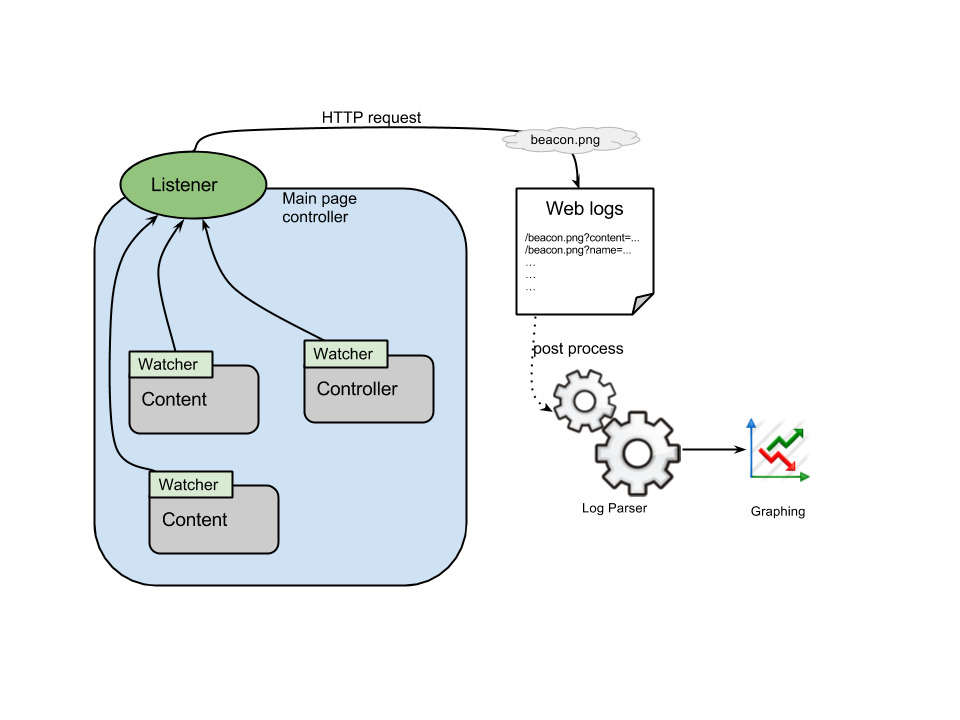
An indicator placed on various parts of the page to watch that specific portion of the page (eg. article body, top articles, but not header or featured stories).
A listener which waits to be informed by all of the indicators; internally the listener can set up various timers as necessary.
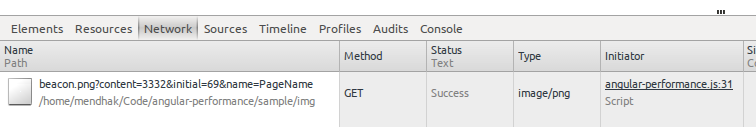
A beacon which the listener can send the aggregate information to once it is satisfied that all of the indicators have reported to it. This beacon usually takes the form of an empty image, with timings passed in the querystring.
/beacon.png?content=3913&name=ArticleView&initial=1011The above means it took the ArticleView page 1011 milliseconds for its initial load and 3913 milliseconds to load the actual content (the perceived load time).
The beacon requests will be stored in your web server logs, and a log parsing application (eg. logster) can retrospectively process it, grab the information and store it your aggregating service (eg. graphite).
##Using the performance directives
The listener shown above is the performance directive. Place this attribute at the beginning of your angular view.
<div performance="PageName" performance-beacon="/sample/img/beacon.png">The performance-beacon indicates where the HTTP request should go when perceived page load is complete.
The watchers above are the performance-loaded directives. Place these attributes anywhere within the view and set its value to an object on the $scope. For example, you can do this
performance-loaded="ProductsFromAPI"This directive will watch the $scope.ProductsFromAPI object and mark loading as done when this object contains a value. You can control this further by using an object just for this directive:
performance-loaded="Loaded"And in your controller, only set $scope.Loaded = true when you feel that all the processing is complete. This is useful when your controller makes multiple API calls and you need to wait for all of them to complete before indicating that loading is complete.
Ensure that the performance loaded directives sit within the scope of the performance directive. In other words, the performance-loaded directives should be in the same controller as performance or in a 'sub-controller' inside it.
Correct:
<div ng-controller="MyController" performance="PageName">
    <div performance-loaded="ProductsFromAPI">
</div>
Correct:
<div ng-controller="MyController" performance="PageName">
    <div ng-controller="SomeOtherController" performance-loaded="ProductsFromAPI">
</div>
Incorrect:
<div ng-controller="MyController" performance="PageName">
    ....
</div>
<div performance-loaded="ProductsFromAPI">
Incorrect:
<div ng-controller="MyController" performance="PageName">
    ....
</div>
<div ng-controller="SomeOtherController" performance-loaded="ProductsFromAPI">
Demo/Code
See this page for a demo. Be sure to open your networks tab or Fiddler to see the beacon request.
Look at index.html and controllers.js to see how it's done.
You can use angular-performance.js or its minified version.