
arc-chart
v1.0.3
Published
Customizable arc-style gauge chart built on Chart.js

Readme
Arc Chart
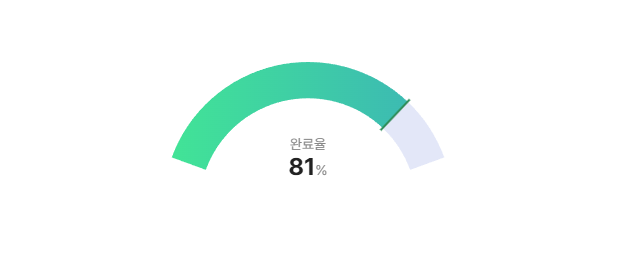
Chart.js 기반의 아크(arc) 형태 게이지 컴포넌트입니다.
- 진행률(0~1) 표시
- 임계값 기준 warning / normal / success 색상 자동 전환
- 시작색 / 끝색 / 바(bar) 색상 커스터마이징
- 중앙 라벨 / 퍼센트 표시 on/off
- 애니메이션 on/off 및 설정
- 런타임 업데이트 API 제공
설치
npm install arc-chart chart.jschart.js는 peer dependency입니다.
npm 없이 사용하기 (dist 직접 로드)
npm install이 어려운 환경에서는 dist 파일을 직접 포함해서 사용할 수 있습니다.
<link rel="stylesheet" href="./dist/arc-chart.css" />

<div class="chart-view">
	<canvas id="chart"></canvas>
</div>

<script src="https://cdn.jsdelivr.net/npm/chart.js"></script>
<script src="./dist/arc-chart.js"></script>
<script>
	const chart = new ArcChart("#chart");
</script>
사용 방법
<canvas id="chart"></canvas>import ArcChart from "arc-chart";
import "arc-chart/dist/arc-chart.css";
const chart = new ArcChart("#chart", {
value: 0.25,
label: "완료율",
showLabel: true,
showPercentage: true,
animation: true,
gapDegree: 220,
cutout: "75%",
thresholds: {
warning: 0.3,
success: 0.8,
},
trackColor: "#E3E7F8",
colors: {
warning: { start: "#FF8E53", end: "#FF5F1F", bar: "#FF4500" },
normal: { start: "#556DFF", end: "#2F4CFF", bar: "#1233FF" },
success: { start: "#42E695", end: "#3BB2B8", bar: "#2E8B57" },
},
});옵션
| 옵션 | 타입 | 기본값 | 설명 |
| --- | --- | --- | --- |
| value | number | 0 | 진행률 값 (0~1) |
| label | string | "" | 중앙 라벨 텍스트 |
| showLabel | boolean | true | 중앙 라벨 표시 여부 |
| showPercentage | boolean | true | 중앙 퍼센트 표시 여부 |
| gapDegree | number | 220 | 비어 있는 각도(0~300 권장) |
| cutout | string | "75%" | 도넛 두께 비율 |
| thresholds.warning | number | 0.3 | warning 기준(미만) |
| thresholds.success | number | 0.8 | success 기준(이상) |
| trackColor | string | "#E3E7F8" | 배경 트랙 색상 |
| colors.warning.start/end/bar | string | "#FF8E53 / #FF5F1F / #FF4500" | warning 상태 색상 |
| colors.normal.start/end/bar | string | "#556DFF / #2F4CFF / #1233FF" | normal 상태 색상 |
| colors.success.start/end/bar | string | "#42E695 / #3BB2B8 / #2E8B57" | success 상태 색상 |
| animation | boolean | object | true | false면 비활성화, 객체면 Chart.js animation 옵션 일부 반영 |
상태 판정 규칙
value < thresholds.warning-> warningvalue >= thresholds.success-> success- 그 외 -> normal
런타임 API
updateValue(newValue)
값만 빠르게 업데이트합니다.
chart.updateValue(0.67);updateOptions(newOptions)
옵션을 부분 업데이트합니다.
chart.updateOptions({
	label: "진행도",
	showLabel: true,
	showPercentage: false,
	animation: false,
	gapDegree: 180,
	cutout: "70%",
	trackColor: "#222",
	thresholds: { warning: 0.2, success: 0.9 },
	colors: {
		normal: { start: "#4A6CFA", end: "#1C40F2", bar: "#0E2BD9" },
	},
});colors, thresholds는 부분 병합(merge)됩니다.
개발
npm install
npm run dev
npm run dev: Rollup watch 빌드npm run build: 배포용 dist 생성
데모
docs/index.html에 인터랙티브 데모가 포함되어 있습니다.