arcgis-echarts
v0.1.1
Published
A plugin for ArcGIS JS API to load echarts map and Make big data visualization easier.
Maintainers
 wandergis
Readme
arcgis-echarts
A plugin for ArcGIS JS API to load echarts map and Make big data visualization easier.
基于ArcGIS Javascript API 扩展 Echarts,使Echarts的地图可以加到ArcGIS Javascript API的地图上
鉴于之前写了一个leaflet加载echarts的扩展传送门,由此萌生了结合ArcGIS Javascript Api和echarts来制作炫酷的可视化地图,没想到整个实现的过程相当顺利,花费了一个多小时写出来这个扩展,加载效果也还不错。强烈建议大家使用谷歌浏览器来查看示例,我试了几个浏览器,只有在谷歌浏览器才能得到最好的效果展现。
Just visit it by
chrome!!!
在线访问(Demo)
使用方法(Usage)
Confirm you have import
ArcGIS Javascript API and Cssfirst, 引入ArcGIS的JS Api和css库自然不用说Add this code before
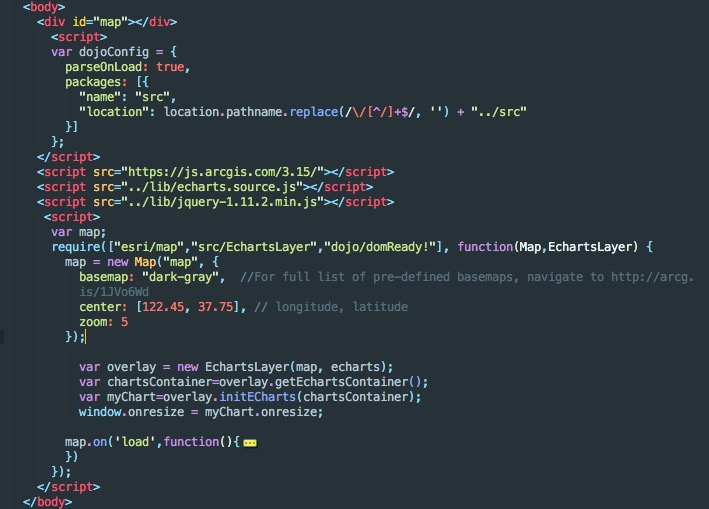
ArcGIS Javascript APIto config the plugin.在引入Arcgis JS api之前添加下面的代码,根据自己项目的路径修改下面的name和locationvar dojoConfig = { parseOnLoad: true, packages: [{ "name": "src", "location": location.pathname.replace(/\/[^/]+$/, '') + "../src" }] };As you can use this plugin like this,按照下面的方法使用
var map=new Map("map",{});
var overlay = new EchartsLayer(map, echarts);
var chartsContainer=overlay.getEchartsContainer();
var myChart=overlay.initECharts(chartsContainer);
map.on('load',function(){
	var option={};//这里跟百度echarts的map的option一样,the option is same as echarts map
	overlay.setOption(option);
	});
})
If you don't konw how to use this plugin,hava a look at
/src/index.html,如果你不会用,看看demo目录下的index.html
截图示例(snapshot)