
awesome-pivot-table
v0.1.17
Published
Awesome Pivot Table Component!

Maintainers
 pravinrd
Readme
Awesome Pivot Table
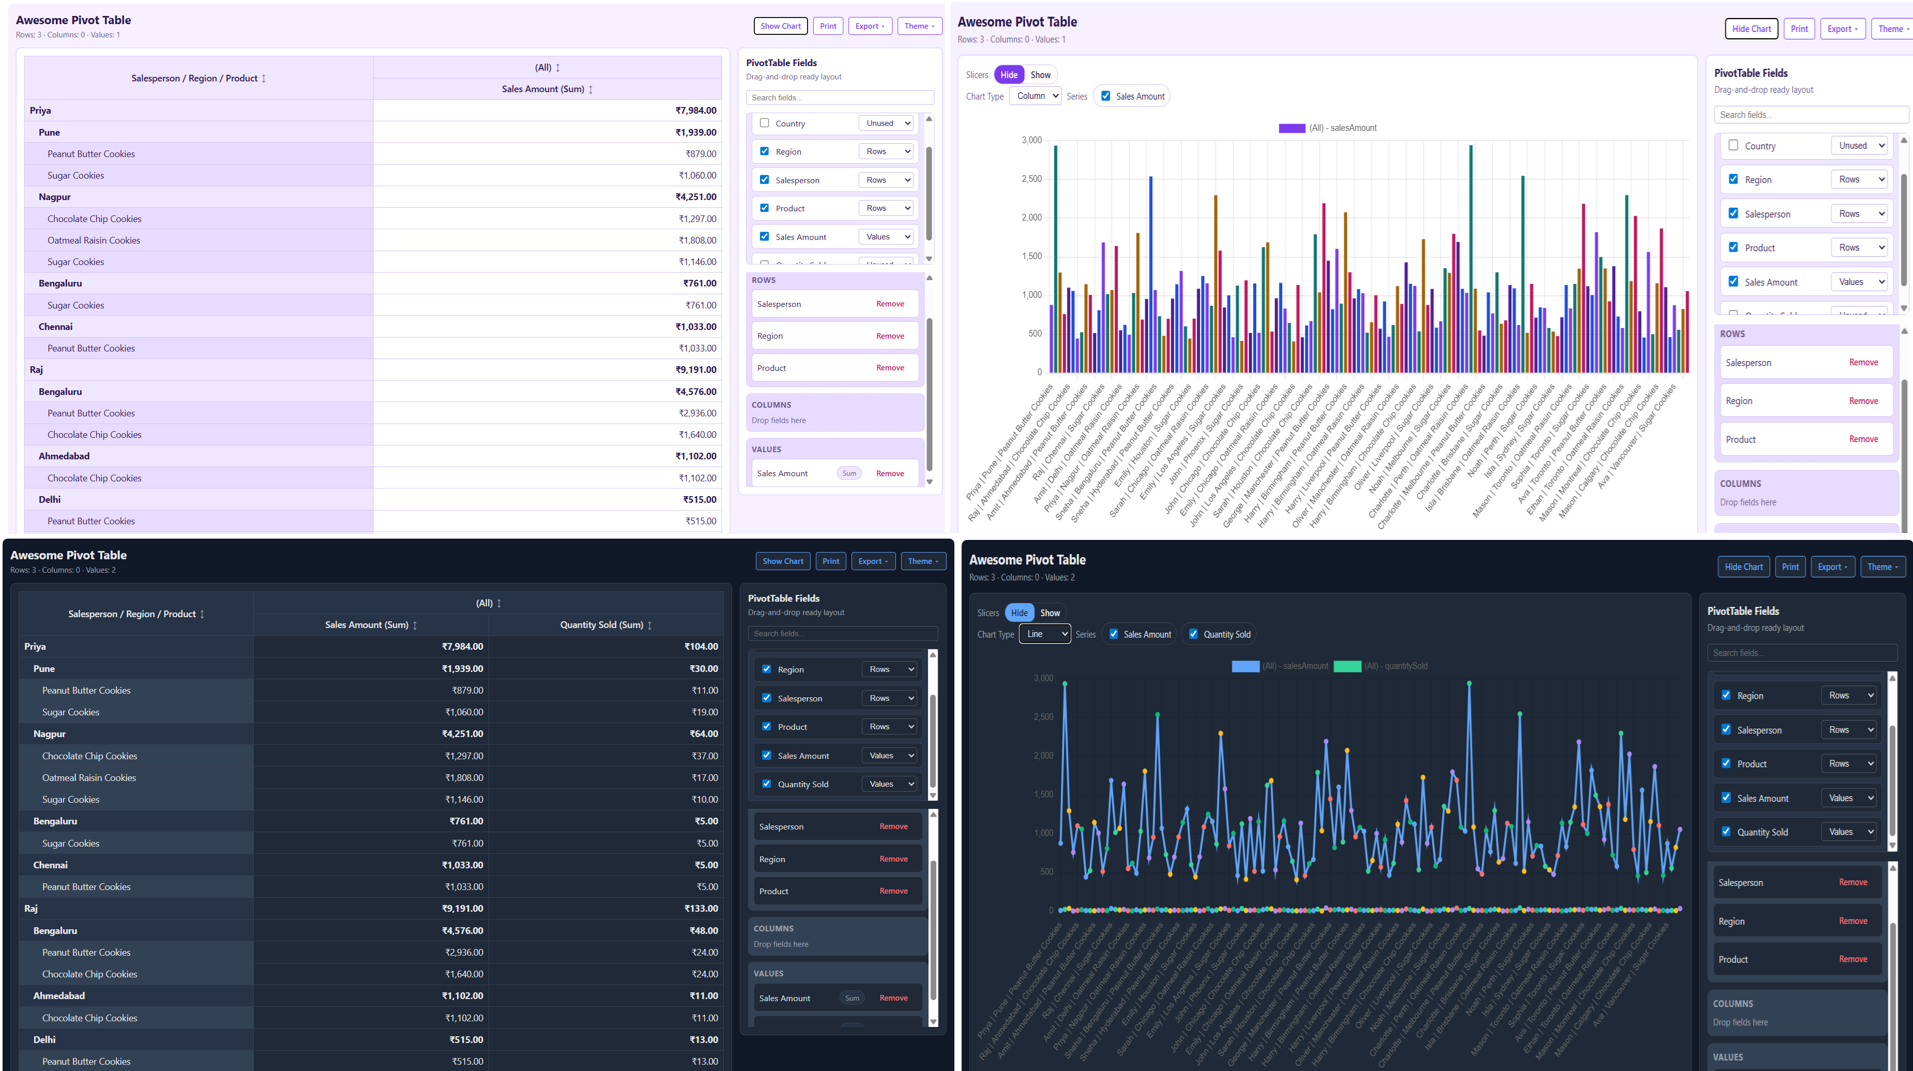
The Awesome Pivot Table is Excel-like pivot table component for React with slicers, charts, exports, and a right-side field pane. It also persist all the user settings/actions locally in IndexedDB of the browser for Personalization experience. Along with export, you can also Print. You will experience as if you are working with Excel Pivot table!
Features
- Drag/drop fields into Filters, Rows, Columns, Values
- Hierarchical rows with totals
- Summarize Values By Context Menu [Sum, Min, Max, Avg, Count]
- Show Values By Context Menu [In %]
- Slicers for chart filtering
- Built-in chart types (Column, Bar, Line, Area, Pie)
- Export CSV / Export Image / Print
- Theme support (Light, Dark, Purple)
- Persistent preferences via IndexedDB
- Charts are lazy‑loaded to keep initial bundle size small [Column/Bar/Line/Area/Pie]
Install
npm install awesome-pivot-tableWatch the demo here
Usage
import React from "react";
import { AwesomePivotTable } from "awesome-pivot-table";
import "awesome-pivot-table/style.css";

export default function App() {
  return (
    <div style={{ padding: 24 }}>
      <AwesomePivotTable
        title="Awesome Pivot Table"
        theme="light"
        apiEndpoint="/pivot-data.json"
        currency="USD"
        currencyLocale="en-US"
        storageKey="my-pivot"
      />
    </div>
  );
}
Props
| Prop | Type | Default | Description |
| --- | --- | --- | --- |
| title | string | "Pivot Table" | Title displayed above the table. |
| theme | "light" \| "dark" \| "purple" | "light" | Visual theme. |
| apiEndpoint | string | "/pivot-data.json" | URL for JSON data: { data: [] }. |
| data | array | [] | Provide data directly instead of apiEndpoint. |
| currency | string | "USD" | Currency code for values (e.g., "USD", "INR"). |
| currencyLocale | string | "en-US" | Locale for numeric formatting (e.g., "en-US", "en-IN"). |
| storageKey | string | "awesome-pivot" | IndexedDB key for persisting preferences. |
Persistence (IndexedDB)
The component persists the following using storageKey:
- Theme selection
- Field layout (Rows/Columns/Values/Filters)
- Slicer selections + chosen slicer fields
- Chart visibility and series selection
- Chart type
Chart Export Rules
- Export Image exports:
- Chart + Table when the chart is visible
- Table only when the chart is hidden
- Chart export uses
html-to-image.
CSS Import
The build emits dist/style.css inside the package. Import it like this:
import "awesome-pivot-table/style.css";Data format
The component expects:
{
  "data": [
    {
      "Date": "2024-01-01T00:00:00",
      "Country": "India",
      "Region": "Pune",
      "Salesperson": "Priya",
      "Product": "Peanut Butter Cookies",
      "Sales Amount": 879,
      "Quantity Sold": 11
    }
  ]
}
📊 Mock Data
If you need sample data to test your integration, you can use our pre-configured JSON mock file.
Direct Download
Click the button below to view or save the mock data file:
Note: If the file opens in your browser, just right-click and select "Save As..."
Keys are normalized to camelCase internally.
Notes
- Chart export requires
html-to-image. - Charting uses
chart.js+react-chartjs-2. - Charts are loaded on demand (lazy-loaded), improving initial load performance for users who only need the pivot table.
License
MIT